

Passing the Test: A Model-Based Analysis of Safe School-Reopening Strategies
- PMID: 34097433
- PMCID: PMC8252151
- DOI: 10.7326/M21-0600
Passing the Test: A Model-Based Analysis of Safe School-Reopening Strategies
Erratum in
-
Correction: Model-Based Analysis of Safe School-Reopening Strategies.Ann Intern Med. 2021 Aug;174(8):1195. doi: 10.7326/L21-0417. Ann Intern Med. 2021. PMID: 34399083 No abstract available.
Abstract
Background: The COVID-19 pandemic has induced historic educational disruptions. In April 2021, about 40% of U.S. public school students were not offered full-time in-person education.
Objective: To assess the risk for SARS-CoV-2 transmission in schools.
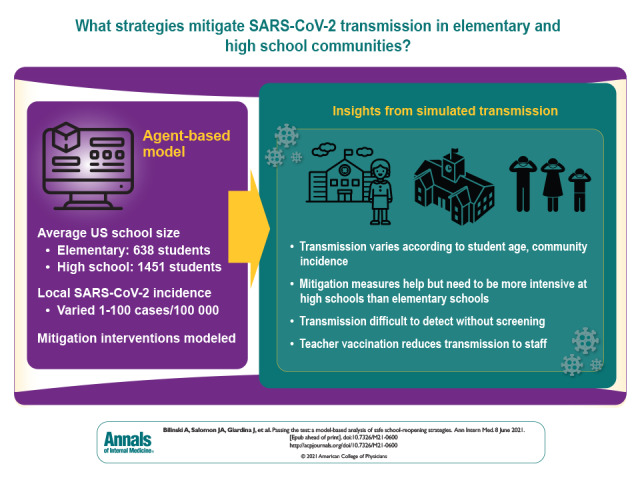
Design: An agent-based network model was developed to simulate transmission in elementary and high school communities, including home, school, and interhousehold interactions.
Setting: School structure was parametrized to reflect average U.S. classrooms, with elementary schools of 638 students and high schools of 1451 students. Daily local incidence was varied from 1 to 100 cases per 100 000 persons.
Participants: Students, faculty, staff, and adult household members.
Intervention: Isolation of symptomatic individuals, quarantine of an infected individual's contacts, reduced class sizes, alternative schedules, staff vaccination, and weekly asymptomatic screening.
Measurements: Transmission was projected among students, staff, and families after a single infection in school and over an 8-week quarter, contingent on local incidence.
Results: School transmission varies according to student age and local incidence and is substantially reduced with mitigation measures. Nevertheless, when transmission occurs, it may be difficult to detect without regular testing because of the subclinical nature of most children's infections. Teacher vaccination can reduce transmission to staff, and asymptomatic screening improves understanding of local circumstances and reduces transmission.
Limitation: Uncertainty exists about the susceptibility and infectiousness of children, and precision is low regarding the effectiveness of specific countermeasures, particularly with new variants.
Conclusion: With controlled community transmission and moderate mitigation, elementary schools can open safety, but high schools require more intensive mitigation. Asymptomatic screening can facilitate reopening at higher local incidence while minimizing transmission risk.
Primary funding source: Centers for Disease Control and Prevention through the Council of State and Territorial Epidemiologists, National Institute of Allergy and Infectious Diseases, National Institute on Drug Abuse, and Facebook.
Conflict of interest statement
Figures


Update of
-
Passing the Test: A model-based analysis of safe school-reopening strategies.medRxiv [Preprint]. 2021 Jan 29:2021.01.27.21250388. doi: 10.1101/2021.01.27.21250388. medRxiv. 2021. Update in: Ann Intern Med. 2021 Aug;174(8):1090-1100. doi: 10.7326/M21-0600. PMID: 33532804 Free PMC article. Updated. Preprint.
Comment in
-
Resuming In-Person Learning: Safe and Imperative.Ann Intern Med. 2021 Aug;174(8):1167-1168. doi: 10.7326/M21-2291. Epub 2021 Jun 8. Ann Intern Med. 2021. PMID: 34097432 Free PMC article.
References
-
- Map: coronavirus and school closures. Education Week. 6 March 2020. Accessed at www.edweek.org/ew/section/multimedia/map-coronavirus-and-school-closures... on 11 June 2020.
-
- K-12 school opening tracker. Burbio. 2020. Accessed at https://cai.burbio.com/school-opening-tracker on 25 November 2020.
-
- 2020-2021 dashboard. Boston Public Schools. 2021. Accessed at http://datastudio.google.com/reporting/77e82eef-349a-4f00-bd50-0824cd0df... on 21 April 2021.
-
- Shapiro E. Over 50,000 N.Y.C. public school students will return to classrooms, including in middle and high school. New York Times. 12 April 2021. Accessed at www.nytimes.com/2021/04/12/nyregion/nyc-public-schools-students.html on 21 April 2021.
-
- Shapiro E. How de Blasio backed himself into a corner on closing schools. New York Times. 24 November 2020. Accessed at www.nytimes.com/2020/11/24/nyregion/deblasio-school-reopening.html on 25 November 2020.
MeSH terms
Substances
Grants and funding
LinkOut - more resources
Full Text Sources
Medical
Miscellaneous