. 2021 Aug 17;65(9):e0268020.
doi: 10.1128/AAC.02680-20. Epub 2021 Aug 17.

Hepatitis C Virus Protease Inhibitors Show Differential Efficacy and Interactions with Remdesivir for Treatment of SARS-CoV-2 In Vitro

Affiliations

Hepatitis C Virus Protease Inhibitors Show Differential Efficacy and Interactions with Remdesivir for Treatment of SARS-CoV-2 In Vitro

Karen A Gammeltoft et al. Antimicrob Agents Chemother. .

Abstract

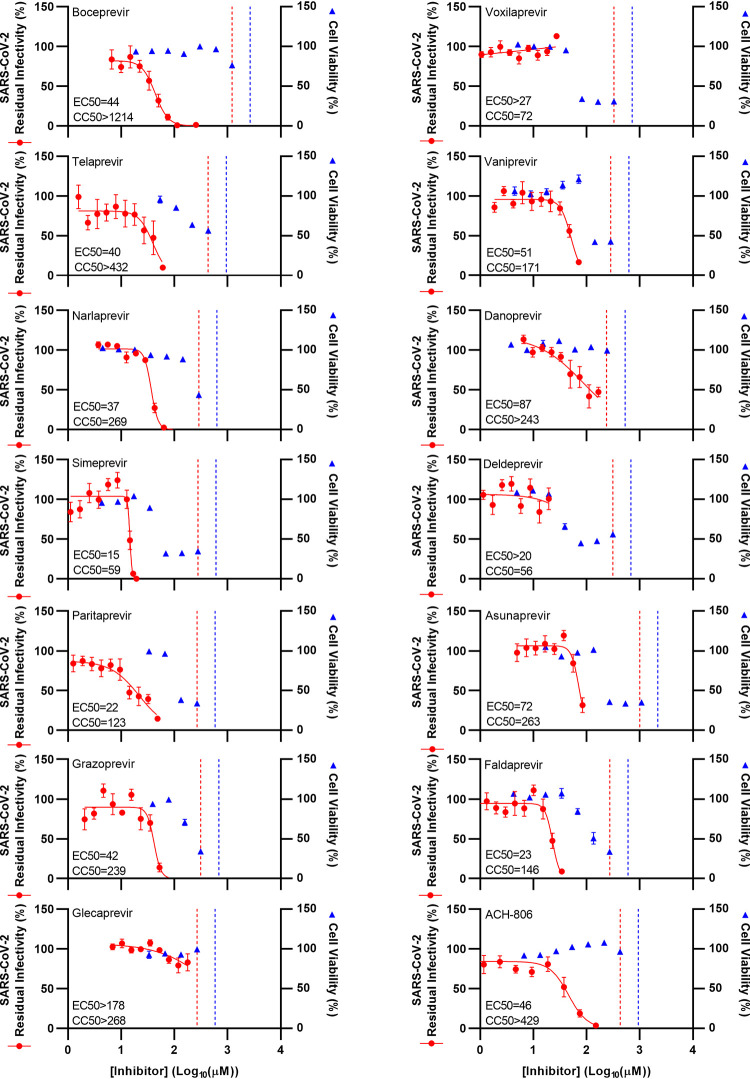
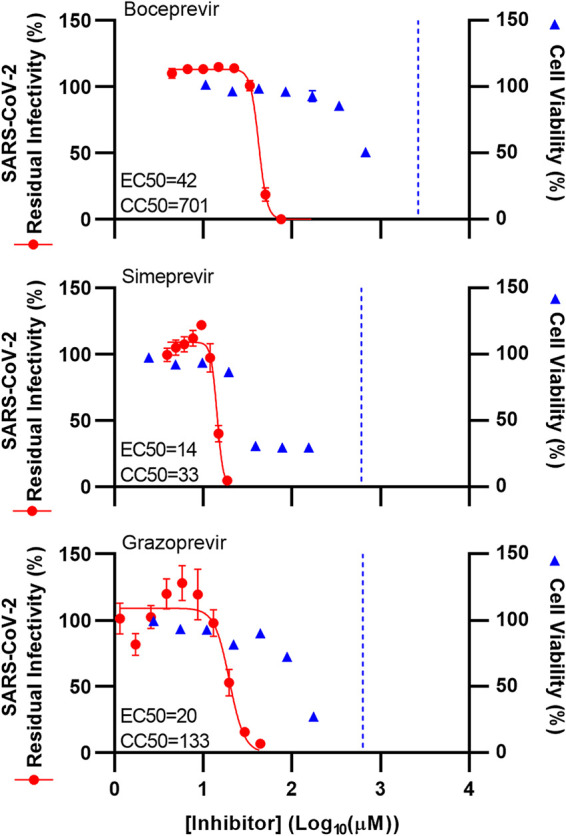
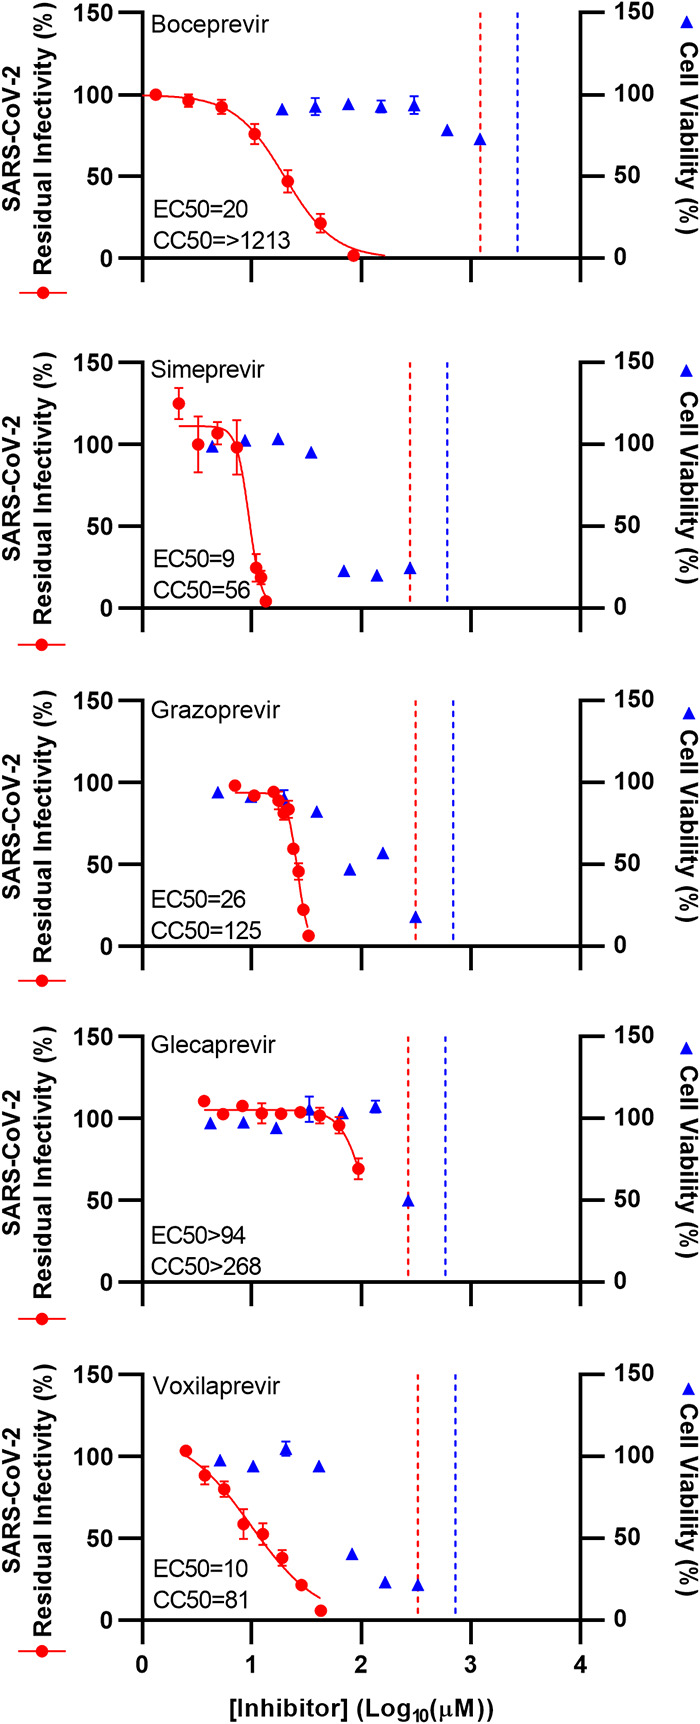
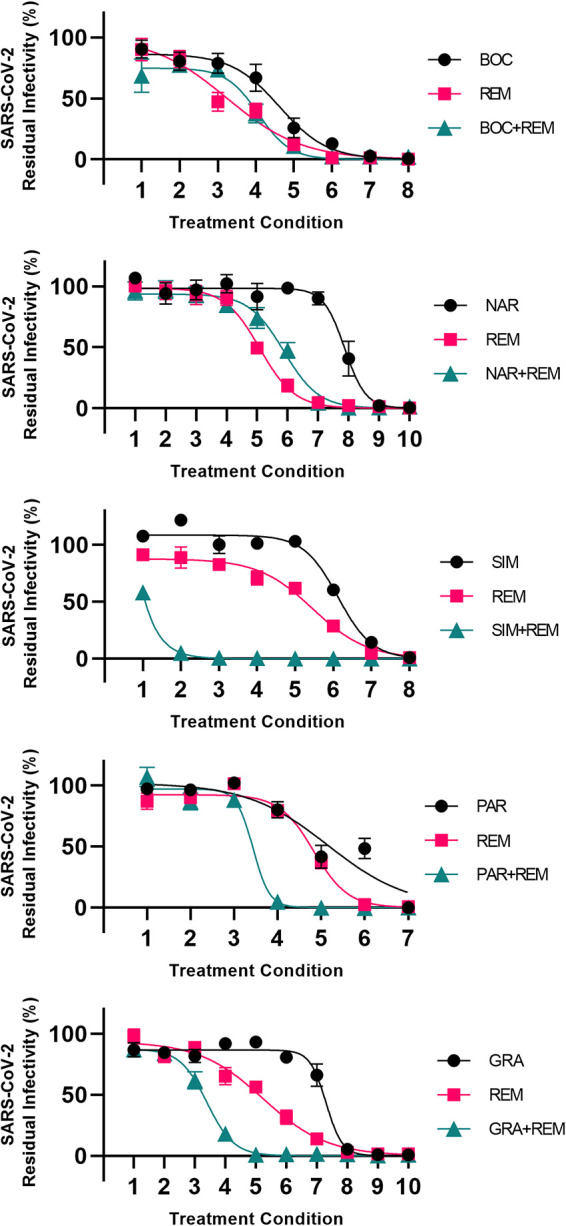
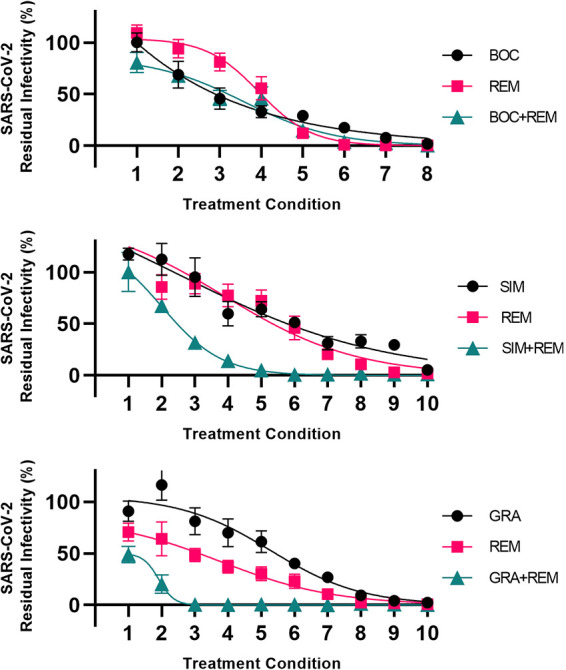
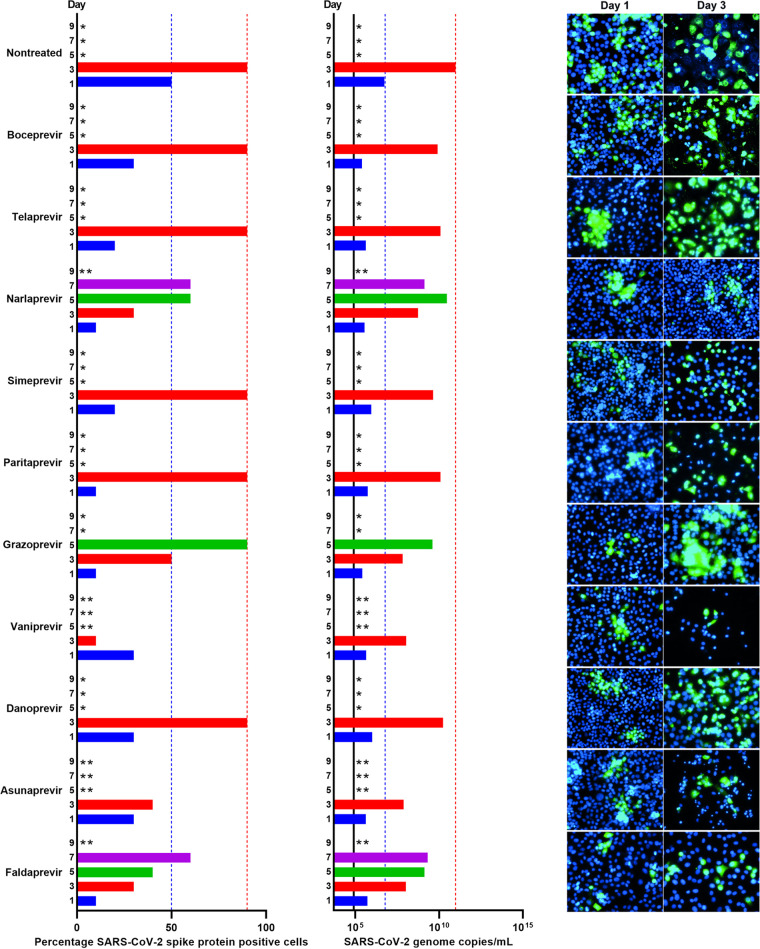
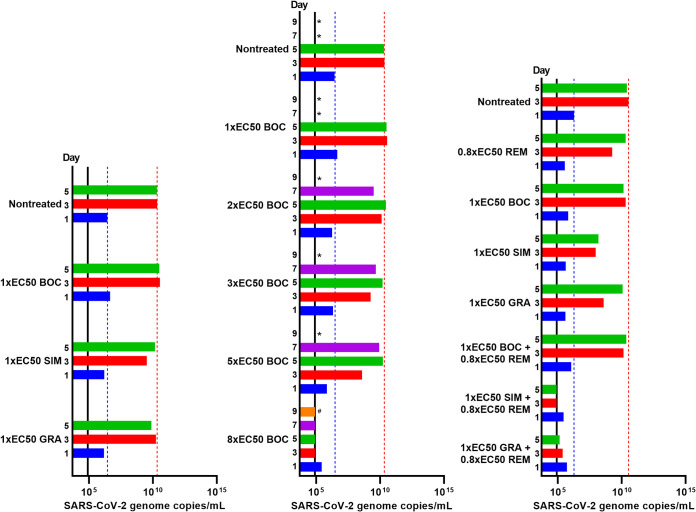
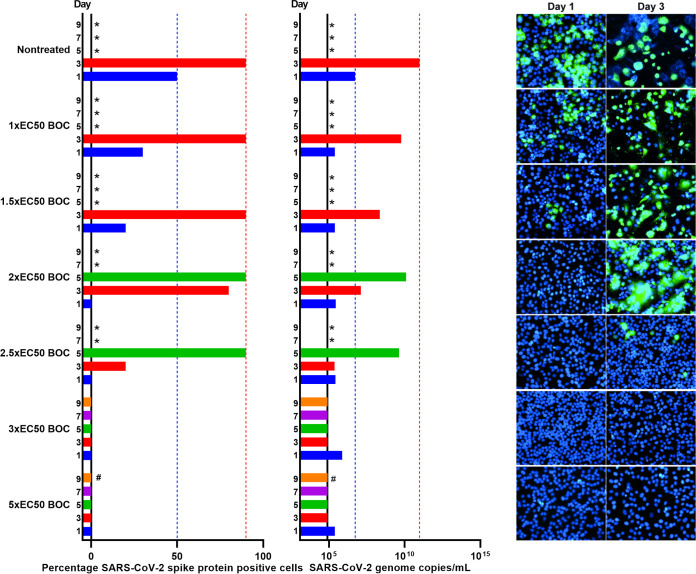
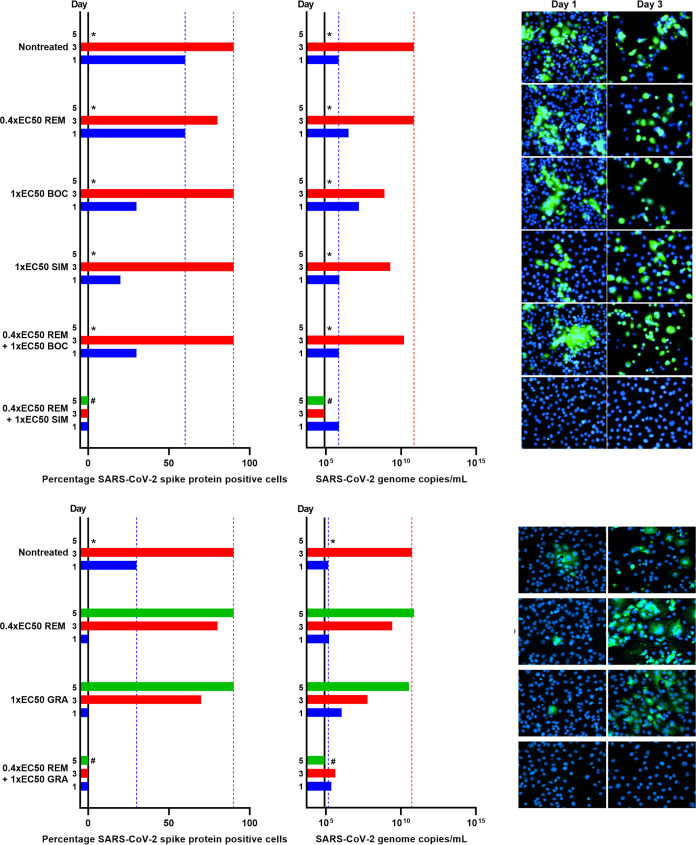
Antivirals targeting severe acute respiratory syndrome coronavirus 2 (SARS-CoV-2) could improve treatment of COVID-19. We evaluated the efficacy of clinically relevant hepatitis C virus (HCV) NS3 protease inhibitors (PIs) against SARS-CoV-2 and their interactions with remdesivir, the only direct-acting antiviral approved for COVID-19 treatment. HCV PIs showed differential potency in short-term treatment assays based on the detection of SARS-CoV-2 spike protein in Vero E6 cells. Linear PIs boceprevir, telaprevir, and narlaprevir had 50% effective concentrations (EC50) of ∼40 μM. Among the macrocyclic PIs, simeprevir had the highest (EC50, 15 μM) and glecaprevir the lowest (EC50, >178 μM) potency, with paritaprevir, grazoprevir, voxilaprevir, vaniprevir, danoprevir, and deldeprevir in between. Acyclic PIs asunaprevir and faldaprevir had EC50s of 72 and 23 μM, respectively. ACH-806, inhibiting the HCV NS4A protease cofactor, had an EC50 of 46 μM. Similar and slightly increased PI potencies were found in human hepatoma Huh7.5 cells and human lung carcinoma A549-hACE2 cells, respectively. Selectivity indexes based on antiviral and cell viability assays were highest for linear PIs. In short-term treatments, combination of macrocyclic but not linear PIs with remdesivir showed synergism in Vero E6 and A549-hACE2 cells. Longer-term treatment of infected Vero E6 and A549-hACE2 cells with 1-fold EC50 PI revealed minor differences in the barrier to SARS-CoV-2 escape. Viral suppression was achieved with 3- to 8-fold EC50 boceprevir or 1-fold EC50 simeprevir or grazoprevir, but not boceprevir, in combination with 0.4- to 0.8-fold EC50 remdesivir; these concentrations did not lead to viral suppression in single treatments. This study could inform the development and application of protease inhibitors for optimized antiviral treatments of COVID-19.

Keywords: COVID-19; antiviral; combination treatment; coronavirus; repurposing; synergy.


Figures

FIG 1
FIG 1
Potency of a panel of HCV PIs and an HCV NS4A inhibitor against SARS-CoV-2 in Vero E6 cells. Vero E6 cells were seeded in 96-well plates and, the following day, infected with SARS-CoV-2 at an MOI of 0.002 followed by treatment with specified concentrations of the PIs boceprevir, telaprevir, narlaprevir, simeprevir, paritaprevir, grazoprevir, glecaprevir, voxilaprevir, vaniprevir, danoprevir, deldeprevir, asunaprevir, and faldaprevir as well as HCV NS4A inhibitor ACH-806, as described in Materials and Methods. After 46 to 50 h of incubation, SARS-CoV-2-infected cells were visualized by immunostaining for the SARS-CoV-2 spike protein and quantified by automated counting, as described in Materials and Methods. Data points (red dots) are means of counts from 7 replicate cultures ± standard errors of the means (SEMs) and represent percent residual infectivity, determined as percent SARS-CoV-2-positive cells relative to means of counts from 14 replicate infected nontreated control cultures. Sigmoidal concentration-response curves (red lines) were fitted and EC50 values were determined, as described in Materials and Methods. Cell viability data were obtained in replicate assays with noninfected cells using a colorimetric assay, as described in Materials and Methods. Data points (blue triangles) are means from 3 replicate cultures ± SEMs and represent percent cell viability relative to mean absorbance from 12 replicate nontreated control cultures. Sigmoidal concentration-response curves were fitted and CC50 values were determined as shown in Fig. S4 in the supplemental material. The red dotted lines represent the drug concentrations at which DMSO is expected to induce antiviral effects with reduction of residual infectivity to <70%, according to Fig. S2. The blue dotted lines represent the drug concentrations at which DMSO is expected to induce cytotoxicity with reduction of cell viability to <90%, according to Fig. S2.
FIG 2
FIG 2
Potency of selected HCV PIs against SARS-CoV-2 was confirmed in Huh7.5 cells. Huh7.5 cells were seeded in 96-well plates and, the following day, infected with SARS-CoV-2 at an MOI of 0.02 followed by treatment with specified concentrations of the PIs boceprevir, simeprevir, and grazoprevir, as described in Materials and Methods. After 70 to 74 h of incubation, SARS-CoV-2-infected cells were visualized by immunostaining for the SARS-CoV-2 spike protein and quantified by automated counting, as described in Materials and Methods. Data points (red dots) are means from 7 replicates ± SEMs and represent percent residual infectivity, determined as percent SARS-CoV-2-positive cells relative to means of counts from 14 replicate infected nontreated control cultures. Sigmoidal concentration-response curves (red lines) were fitted and EC50 values were determined, as described in Materials and Methods. Cell viability data were obtained in replicate assays with noninfected cells using a colorimetric assay as described in Materials and Methods. Data points (blue triangles) are means from 3 replicate cultures ± SEMs and represent percent cell viability relative to mean absorbance from 12 nontreated controls. Sigmoidal concentration-response curves were fitted and CC50 values were determined, as shown in Fig. S5. The blue dotted line represents the drug concentrations at which DMSO is expected to induce cytotoxicity with reduction of cell viability to <90%, according to Fig. S2; DMSO did not induce antiviral effects in the tested concentration ranges (Fig. S2).
FIG 3
FIG 3
Potency of selected HCV PIs against SARS-CoV-2 was confirmed in A549-hACE2 cells. A549-hACE2 cells were seeded in 96-well plates and, the following day, infected with SARS-CoV-2 at an MOI of 0.003 followed by treatment with specified concentrations of the PIs boceprevir, simeprevir, grazoprevir, glecaprevir, and voxilaprevir, as described in Materials and Methods. After 46 to 50 h of incubation, SARS-CoV-2-infected cells were visualized by immunostaining for the SARS-CoV-2 spike protein and quantified by automated counting, as described in Materials and Methods. Data points (red dots) are means from 7 replicates ± SEMs and represent percent residual infectivity, determined as percent SARS-CoV-2-positive cells relative to means of counts from 14 replicate infected nontreated control cultures. Sigmoidal concentration-response curves (red lines) were fitted and EC50 values were determined, as described in Materials and Methods. Cell viability data were obtained in replicate assays with noninfected cells using a colorimetric assay as described in Materials and Methods. Data points (blue triangles) are means from 3 replicate cultures ± SEMs and represent percent cell viability relative to mean absorbance from 12 nontreated controls. Sigmoidal concentration-response curves were fitted and CC50 values were determined, as shown in Fig. S6. The red dotted lines represent the drug concentrations at which DMSO is expected to induce antiviral effects with reduction of residual infectivity to <70%, according to Fig. S2. The blue dotted lines represent the drug concentrations at which DMSO is expected to induce cytotoxicity with reduction of cell viability to <90%, according to Fig. S2.
FIG 4
FIG 4
Analysis of interactions of selected HCV PIs with remdesivir in Vero E6 cells. Vero E6 cells seeded in 96-well plates were infected the following day with SARS-CoV-2 at an MOI of 0.002 followed by treatment with serial dilutions of the linear PI boceprevir (BOC) or narlaprevir (NAR), the macrocyclic PI simeprevir (SIM), paritaprevir (PAR), or grazoprevir (GRA), polymerase inhibitor remdesivir (REM), or a combination of these PIs and remdesivir, as described in Materials and Methods. After 46 to 50 h of incubation, SARS-CoV-2-infected cells were visualized by immunostaining for the SARS-CoV-2 spike protein and quantified by automated counting, as described in Materials and Methods. For each inhibitor pair to be evaluated, 7 to 10 treatment conditions were used (indicated on x axes). Each treatment condition was defined by a given concentration of PI applied singly, a given concentration of remdesivir applied singly, and a combination of these same concentrations of PIs and remdesivir, as specified in Table S2, resulting in 3 data points per treatment condition. Data points are means from 6 or 7 replicates ± SEMs and represent percent residual infectivity, determined as percent SARS-CoV-2-positive cells relative to means of counts from infected nontreated control cultures. Sigmoidal concentration-response curves were fitted as described in Materials and Methods. The tested inhibitor concentrations did not impact cell viability (Fig. S8). DMSO did not induce antiviral effects in the tested concentration ranges (Fig. S2).
FIG 5
FIG 5
Analysis of interactions of selected HCV PIs with remdesivir in A549-hACE2 cells. A549-hACE2 cells seeded in 96-well plates were infected the following day with SARS-CoV-2 at an MOI of 0.003 followed by treatment with serial dilutions of the linear PI boceprevir (BOC), the macrocyclic PI simeprevir (SIM) or grazoprevir (GRA), polymerase inhibitor remdesivir (REM), or a combination of these PIs and remdesivir, as described in Materials and Methods. After 46 to 50 h of incubation, SARS-CoV-2-infected cells were visualized by immunostaining for the SARS-CoV-2 spike protein and quantified by automated counting, as described in Materials and Methods. For each inhibitor pair to be evaluated, 8 to 10 treatment conditions were used (indicated on x axes). Each treatment condition was defined by a given concentration of PI applied singly, a given concentration of remdesivir applied singly, and a combination of these same concentrations of PIs and remdesivir, as specified in Table S2, resulting in 3 data points per treatment condition. Data points are means from 7 replicates ± SEMs and represent percent residual infectivity, determined as percent SARS-CoV-2-positive cells relative to means of counts from infected nontreated control cultures. Sigmoidal concentration-response curves were fitted as described in Materials and Methods. DMSO was kept constant in all cultures. The tested inhibitor concentrations did not impair cell viability (Fig. S8). DMSO did not induce antiviral effects in the tested concentration ranges (Fig. S2).
FIG 6
FIG 6
Comparison of barriers to escape for HCV PIs at equipotent concentrations in Vero E6 cells. Vero E6 cells seeded the previous day in T25 flasks were infected with SARS-CoV-2 at an MOI of 0.00002 followed by treatment with 1-fold EC50 of boceprevir, telaprevir, narlaprevir, simeprevir, paritaprevir, grazoprevir, vaniprevir, danoprevir, asunaprevir, and faldaprevir, which were administered immediately after infection and subsequently at the indicated time points postinfection when cells were split, as described in Materials and Methods. (Left) Percentages of SARS-CoV-2-infected cells on the specified days postinfection were determined by anti-spike protein immunostaining of replicate cultures derived following cell splitting and treatment. (Middle) SARS-CoV-2 RNA titers determined in cell culture supernatants as genome copies per milliliter on the specified days postinfection were determined by RT-qPCR assays. The black line indicates the lower limit of quantification (LLOQ). In the left and middle panels, to facilitate comparisons, bars are color coded according to the day postinfection, and blue and red dotted lines were inserted to highlight day 1 and 3 values of the nontreated culture, respectively. (Right) Replicate cultures were derived following cell splitting and treatment, immunostained for the SARS-CoV-2 spike protein (green) and counterstained with Hoechst dye (blue), and images were acquired, as described in Materials and Methods. Cultures summarized in this figure are derived from different experimental setups, each including an infected nontreated control culture, which showed viral spread comparable to that in the depicted representative culture. *, culture was terminated, or infection data not recorded, due to virus-induced cell death; **, culture was terminated due to drug-induced cytotoxicity, possibly enhanced by viral infection.
FIG 7
FIG 7
Comparison of barriers to escape for HCV PIs in A549-hACE2 cells. A549-hACE2 cells seeded the previous day in T25 flasks were infected with SARS-CoV-2 at an MOI of 0.0005, followed by treatment with indicated concentrations of specified inhibitors administered immediately after infection and subsequently at the listed time points when cells were split, as described in Materials and Methods. BOC, boceprevir; SIM, simeprevir; GRA, grazoprevir; REM, remdesivir. Upon splitting of cells, cell culture supernatant was harvested and subjected to RT-qPCR for determination of SARS-CoV-2 RNA titers determined as genome copies per milliliter. The black lines indicate the LLOQs. To facilitate comparisons, bars are color coded according to the day postinfection, and blue and red dotted lines were inserted to highlight day 1 and 3 values of the nontreated culture, respectively. Cultures summarized in this figure are derived from different experimental setups, each including an infected nontreated control culture, which showed viral spread comparable to that in the depicted representative culture. (Left) Treatment with 1-fold EC50 boceprevir, simeprevir, or grazoprevir. (Middle) Treatment with 1-, 2-, 3-, 4-, 5-, and 8-fold EC50 boceprevir. *, culture was terminated due to virus- or drug-induced cytotoxicity; #, culture was maintained for a total of 13 days without indication of infection (RNA titers were around the LLOQ and no observation of single SARS-CoV-2 spike protein-positive cells). (Right) Treatment with 0.8-fold EC50 remdesivir, 1-fold EC50 boceprevir, 1-fold EC50 simeprevir, or 1-fold EC50 grazoprevir singly or with a combination of remdesivir with either of the PIs.
FIG 8
FIG 8
Boceprevir was capable of completely suppressing SARS-CoV-2 in Vero E6 cells. Vero E6 cells seeded the previous day in T25 flasks were infected with SARS-CoV-2 at an MOI of 0.00002 followed by treatment with 1-, 1.5-, 2-, 2.5-, 3-, and 5-fold EC50 boceprevir, which was administered immediately after infection and subsequently at the indicated time points when cells were split, as described in Materials and Methods. (Left) Percentages of SARS-CoV-2-infected cells on the specified days postinfection were determined by anti-spike protein immunostaining of replicate cultures derived following cell splitting and treatment. (Middle) SARS-CoV-2 RNA titers determined in cell culture supernatants as genome copies per milliliter on the specified days postinfection were determined by RT-qPCR assays. The black line indicates the LLOQ. In the left and middle panels, to facilitate comparisons, bars are color coded according to the day postinfection, and blue and red dotted lines were inserted to highlight day 1 and 3 values of the nontreated culture, respectively. (Right) Replicate cultures were derived following cell splitting and treatment, immunostained for the SARS-CoV-2 spike protein (green) and counterstained with Hoechst dye (blue), and images were acquired, as described in Materials and Methods. Cultures summarized in this figure are derived from different experimental setups, each including an infected nontreated control culture, which showed viral spread comparable to that in the depicted representative culture. *, culture was terminated, or infection data not recorded, due to virus-induced cell death; #, culture was maintained for a total of 17 days without indication of infection (no observation of single SARS-CoV-2 spike protein-positive cells and RNA titers were around the LLOQ).
FIG 9
FIG 9
At equipotent concentrations, simeprevir and grazoprevir but not boceprevir synergized with remdesivir to completely suppress viral infection in Vero E6 cells. Vero E6 cells seeded the previous day in T25 flasks were infected with SARS-CoV-2 at an MOI of 0.00002 followed by treatment with 0.4-fold EC50 remdesivir (REM), 1-fold EC50 boceprevir (BOC), 1-fold EC50 simeprevir (SIM), or 1-fold EC50 grazoprevir (GRA) singly or with a combination of remdesivir with either of the PIs, which were administered immediately after infection and subsequently at the indicated time points when cells were split, as described in Materials and Methods. (Left) Percentages of SARS-CoV-2-infected cells on the specified days postinfection were determined by anti-spike protein immunostaining of replicate cultures derived following cell splitting and treatment. (Middle) SARS-CoV-2 RNA titers determined in cell culture supernatants as genome copies per milliliter on the specified days postinfection were determined by RT-qPCR assays. The black lines indicate the LLOQs. In the left and middle panels, to facilitate comparisons, bars are color coded according to the day postinfection, and blue and red dotted lines were inserted to highlight day 1 and 3 values of the nontreated culture, respectively. (Right) Replicate cultures were derived following cell splitting and treatment, immunostained for the SARS-CoV-2 spike protein (green) and counterstained with Hoechst dye (blue), and images were acquired, as described in Materials and Methods. Cultures summarized in this figure are derived from two different experimental setups (REM/BOC/SIM and REM/GRA experiments), each including the respective depicted nontreated control culture. *, culture was terminated, or infection data not recorded, due to virus-induced cell death; #, culture was maintained for a total of 15 days without indication of infection (no observation of single SARS-CoV-2 spike protein-positive cells and RNA titers were around the LLOQ).

Similar articles

Cited by

References

    1. Zhou P, Lou Yang X, Wang XG, Hu B, Zhang L, Zhang W, Si HR, Zhu Y, Li B, Huang CL, Chen HD, Chen J, Luo Y, Guo H, Jiang R, Di Liu MQ, Chen Y, Shen XR, Wang X, Zheng XS, Zhao K, Chen QJ, Deng F, Liu LL, Yan B, Zhan FX, Wang YY, Xiao GF, Shi ZL. 2020. A pneumonia outbreak associated with a new coronavirus of probable bat origin. Nature 579:270–273. 10.1038/s41586-020-2012-7. - DOI - PMC - PubMed
    1. Zhu N, Zhang D, Wang W, Li X, Yang B, Song J, Zhao X, Huang B, Shi W, Lu R, Niu P, Zhan F, Ma X, Wang D, Xu W, Wu G, Gao GF, Tan W. 2020. A novel coronavirus from patients with pneumonia in China. N Engl J Med 382:727–733. 10.1056/NEJMoa2001017. - DOI - PMC - PubMed
    1. Wu F, Zhao S, Yu B, Chen YM, Wang W, Song ZG, Hu Y, Tao ZW, Tian JH, Pei YY, Yuan ML, Zhang YL, Dai FH, Liu Y, Wang QM, Zheng JJ, Xu L, Holmes EC, Zhang YZ. 2020. A new coronavirus associated with human respiratory disease in China. Nature 579:265–269. 10.1038/s41586-020-2008-3. - DOI - PMC - PubMed
    1. Xie J, Tong Z, Guan X, Du B, Qiu H. 2020. Clinical characteristics of patients who died of coronavirus disease 2019 in China. JAMA Netw Open 3:e205619. 10.1001/jamanetworkopen.2020.5619. - DOI - PMC - PubMed
    1. Guan W, Ni Z, Hu Y, Liang W, Ou C, He J, Liu L, Shan H, Lei C, Hui DSC, Du B, Li L, Zeng G, Yuen KY, Chen R, Tang C, Wang T, Chen P, Xiang J, Li S, Wang JL, Liang Z, Peng Y, Wei L, Liu Y, Hu YH, Peng P, Wang JM, Liu J, Chen Z, Li G, Zheng Z, Qiu S, Luo J, Ye C, Zhu S, Zhong N, China Medical Treatment Expert Group for Covid-19. 2020. Clinical characteristics of coronavirus disease 2019 in China. N Engl J Med 382:1708–1720. 10.1056/NEJMoa2002032. - DOI - PMC - PubMed

Publication types