. 2021 Jun;40(6):945-950.
doi: 10.1377/hlthaff.2021.00118.

Growth In Medicare Advantage Greatest Among Black And Hispanic Enrollees

Affiliations

Growth In Medicare Advantage Greatest Among Black And Hispanic Enrollees

David J Meyers et al. Health Aff (Millwood). 2021 Jun.

Abstract

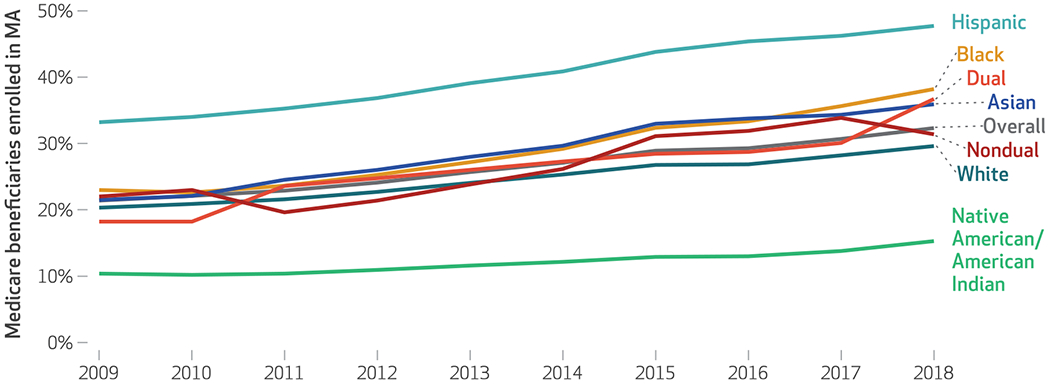
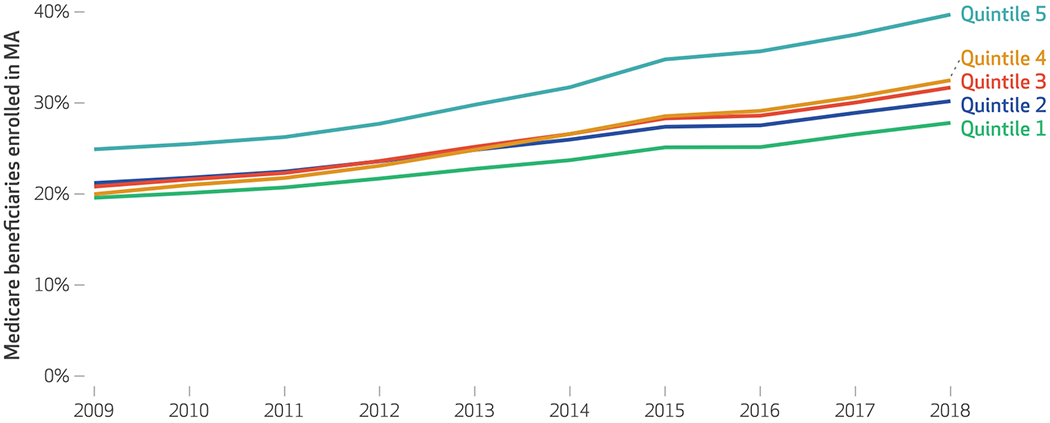
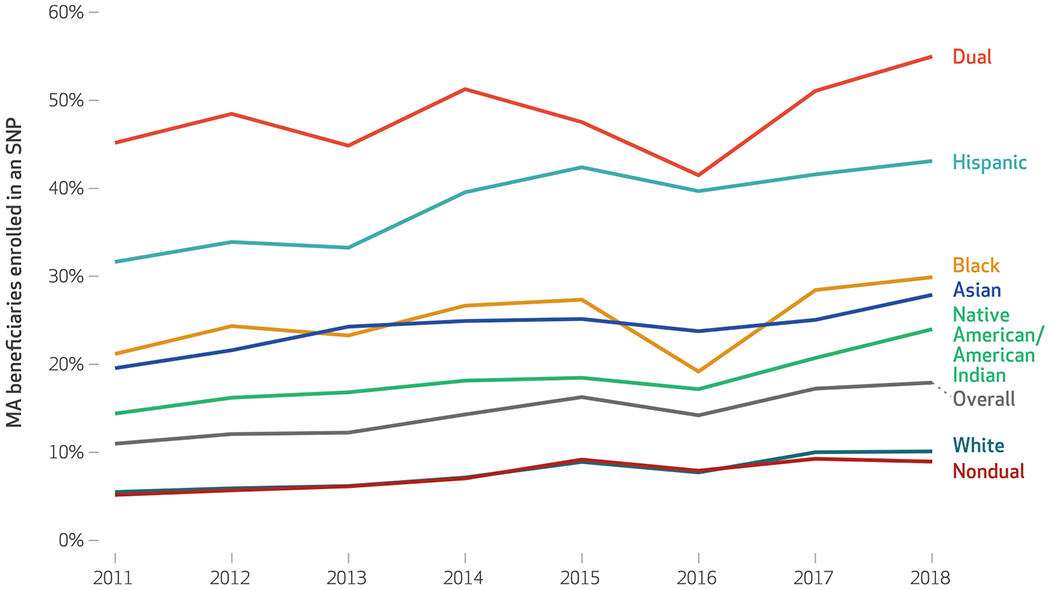
Expansion of the Medicare Advantage program during 2009-18 saw greater enrollment among racial/ethnic minorities and other traditionally marginalized groups. Growth was more rapid among Black, Hispanic, and dually enrolled beneficiaries than among White and nondual beneficiaries. The implications of greater heterogeneity in the program for enrollee outcomes are uncertain.


Figures

EXHIBIT 1
EXHIBIT 1. Enrollment in Medicare Advantage (MA), by race/ethnicity and dual enrollment status, 2009–18
source Authors’ analysis of data from the Medicare Beneficiary Summary File, 2009–18. notes For each data point, the denominator is the number of all beneficiaries of that type in Medicare each year. The numerator is the number of those beneficiaries enrolled in an MA plan. Race/ethnicity variables are from the Research Triangle Institute race code. “Dual” indicates beneficiaries who are enrolled in both Medicaid and Medicare and includes those with both partial and full Medicaid coverage. “Nondual” indicates MA enrollees who are not enrolled in Medicaid. The average annual growth rate is 1.7 percent for Black, 1.6 percent for Hispanic, 1.0 percent for White, 1.6 percent for Asian, 0.5 percent for Native American/American Indian, 2.1 percent for dual, and 1.0 percent for nondual.
EXHIBIT 2
EXHIBIT 2. Enrollment in Medicare Advantage (MA), by quintile of neighborhood disadvantage, 2009–18
source Authors’ analysis of data from the Medicare Beneficiary Summary File, 2009–18. notes For each data point, the denominator is the number of all beneficiaries of that type in Medicare each year. The numerator is the number of those beneficiaries enrolled in an MA plan. Each beneficiary was assigned a Social Deprivation Index on the basis of their residence’s nine-digit ZIP code. The index was then classified into quintiles. Each line represents a quintile of social deprivation (quintile 1: Social Deprivation Index, 1–20; quintile 2: 21–40; quintile 3: 41–60; quintile 4: 61–80; quintile 5: 81–100). The average annual growth rate was 0.9 percent for the first quintile (representing the lowest level of deprivation) and 1.6 percent for the fifth quintile (representing the highest level of deprivation).
EXHIBIT 3
EXHIBIT 3. Enrollment in Medicare Advantage (MA) Special Needs Plans (SNPs), by race/ethnicity and dual enrollment status, 2011–18
source Authors’ analysis of data from the Medicare Beneficiary Summary File and the Centers for Medicare and Medicaid Services Plan Characteristics Files, 2011–18. notes For each data point, the denominator is the number of all beneficiaries of that type in Medicare Advantage each year. The numerator is the number of those beneficiaries enrolled in any type of SNP “Dual” and “nondual” are defined in the notes to exhibit 1.

References

    1. Neuman P, Jacobson GA. Medicare Advantage checkup. N Engl J Med. 2018;379(22):2163–72. - PubMed
    1. Meyers DJ, Durfey SNM, Gadbois EA, Thomas KS. Early adoption of new supplemental benefits by Medicare Advantage plans. JAMA. 2019;321(22):2238–40. - PMC - PubMed
    1. Eicheldinger C, Bonito A. More accurate racial and ethnic codes for Medicare administrative data. Health Care Financ Rev. 2008; 29(3):27–42. - PMC - PubMed
    1. Robert Graham Center. Social Deprivation Index (SDI) [Internet]. Washington (DC): The Center; [cited 2021 Apr 14]. Available from: https://www.graham-center.org/rgc/maps-data-tools/sdi/social-deprivation...
    1. Butler DC, Petterson S, Phillips RL, Bazemore AW. Measures of social deprivation that predict health care access and need within a rational area of primary care service delivery. Health Serv Res. 2013;48(2 Pt 1):539–59. - PMC - PubMed

Publication types

LinkOut - more resources