Observational Study
. 2021 Jun 7:10:e65663.
doi: 10.7554/eLife.65663.

Asymptomatic Bordetella pertussis infections in a longitudinal cohort of young African infants and their mothers

Affiliations
Observational Study

Asymptomatic Bordetella pertussis infections in a longitudinal cohort of young African infants and their mothers

Christopher J Gill et al. Elife. .

Abstract

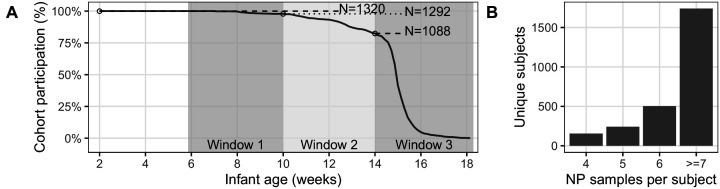
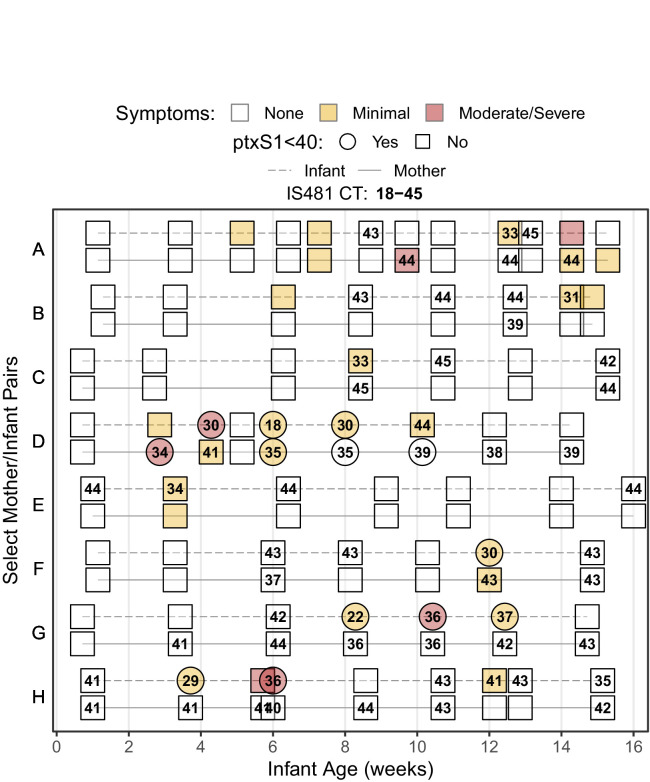
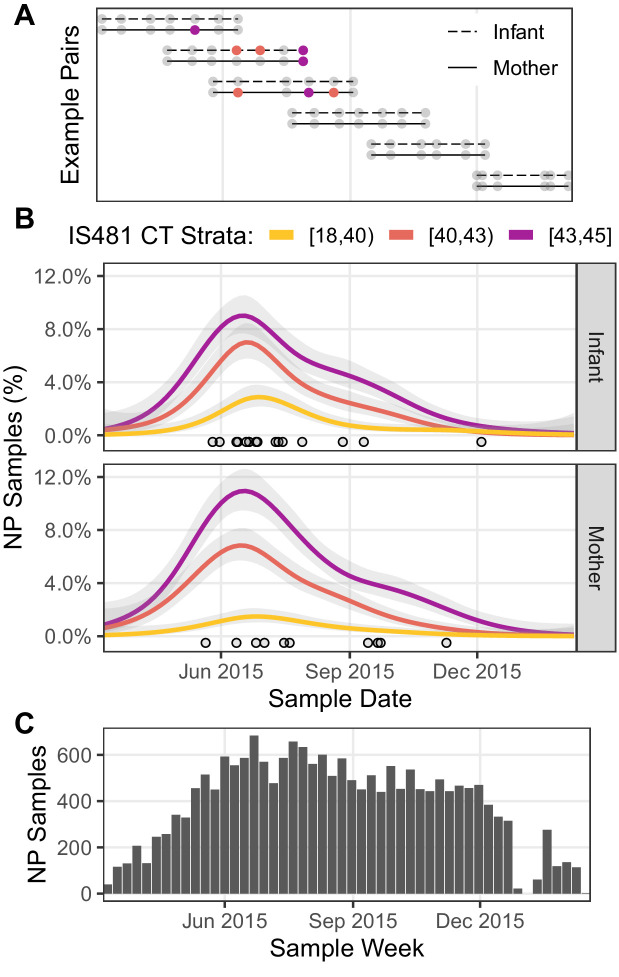
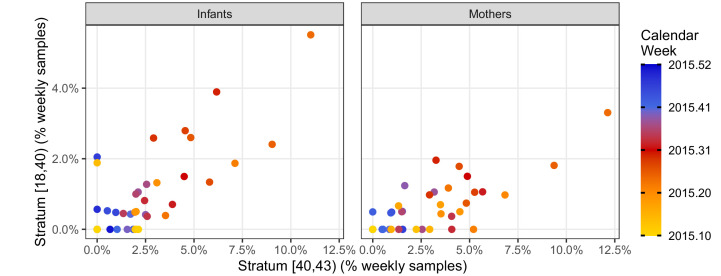
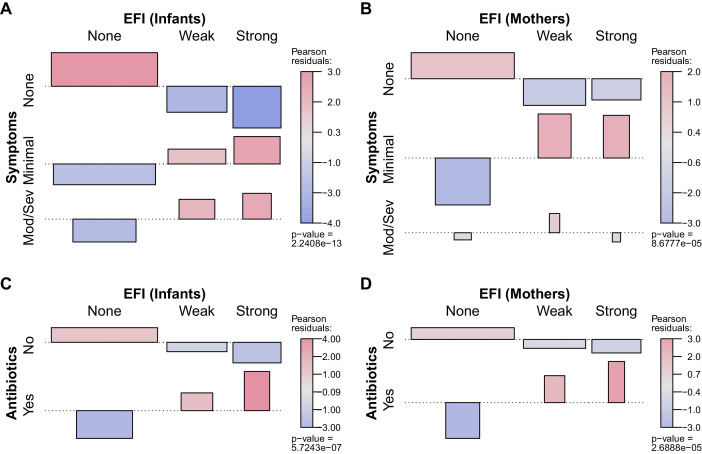
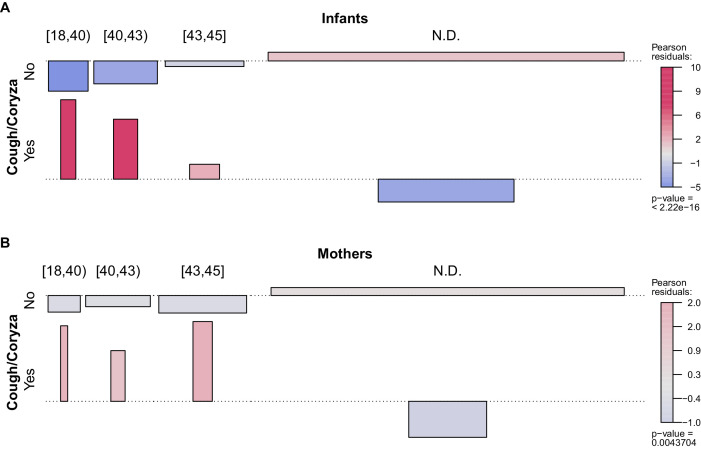
Recent pertussis resurgence in numerous countries may be driven by asymptomatic infections. Most pertussis surveillance studies are cross-sectional and cannot distinguish asymptomatic from pre-symptomatic infections. Longitudinal surveillance could overcome this barrier, providing more information about the true burden of pertussis at the population level. Here we analyze 17,442 nasopharyngeal samples from a longitudinal cohort of 1320 Zambian mother/infant pairs. Our analysis has two elements. First, we demonstrate that the full range of IS481 qPCR CT values provides insight into pertussis epidemiology, showing concordance of low and high CT results over time, within mother/infant pairs, and in relation to symptomatology. Second, we exploit these full-range qPCR data to demonstrate a high incidence of asymptomatic pertussis, including among infants. Our results demonstrate a wider burden of pertussis infection than we anticipated in this population, and expose key limitations of threshold-based interpretation of qPCR results in infectious disease surveillance.

Keywords: Africa; Bordetella pertussis; asymptomatic infection; cohort study; epidemiology; global health; human; qPCR; whooping cough.


Conflict of interest statement

CG, CG, WM, LM, DT, RP, GK, ZM, PR No competing interests declared

Figures

Figure 1.
Figure 1.. Study Attendance.
(A) Percent attendance (%) of mother/infant pairs by infant age at last attendance (N = 1320, excluding pairs where subjects had <4 NP samples). Shaded regions show target age windows of DTP doses 1–3. Horizontal lines and text shows number of pairs attending up to marked ages: beginning of study enrollment, and at earliest timely administration of DTP doses 1–3. See Table 1 for study profile. Most pairs (734/1320) attended all seven scheduled visits (including enrollment). (B) NP samples per subject: number of subjects with each sample count (including enrollment and unscheduled visits). Note that, with rare exceptions, each mother has the same number of NP samples as their infant.
Figure 2.
Figure 2.. Timeline of study participation for eight noteworthy mother/infant pairs, showing rounded IS481 CT values (numbers), ptxS1 results (shape), and pertussis symptoms (color) at each clinic visit.
Selected pairs include all symptomatic infants with definitive evidence of pertussis infection (IS481 CT <35). Blank cells show NP samples with no detected IS481. Contemporaneous detection of IS481 within pairs is common, as are temporal clusters of IS481 within individuals. Pertussis symptoms are relatively uncommon in mothers: of the seven mothers shown here with detectable IS481, four lacked any observable pertussis symptoms during clinic visits.
Figure 3.
Figure 3.. Timeline of study visits, NP samples, and IS481 assays.
(A) Timeline of study participation for six mother/infant pairs chosen to illustrate the cohort’s rolling enrollment. Dots show clinic visits; color indicates NP sample IS481 CT strata. Visits included initial enrollment (shortly after birth) followed by (up to) six scheduled visits at 2–3 week intervals, and (in some cases) additional mother-initiated visits. (B) timeline NP samples for the full cohort (N = 17,442), showing the percent of samples with detectable IS481 over time, stratified by signal intensity (lower CT values indicate more IS481, see also Table 3). For each stratum, a generalized additive model estimated the time-varying proportion of all assays contained in that stratum (shading shows 95% CI). Points highlight assays with CT <35. A cluster of detecting assays in all strata peaks in late June/early July. Strong temporal correlation was observed among strata, and is consistent with detection of a pertussis outbreak, but is not consistent with randomly distributed false positive assays. (C) Number of NP samples per week (approx. denominator of B). The dip in Jan 2016 corresponds with the Christmas holiday.
Figure 4.
Figure 4.. Phase portraits showing the weekly percent of NP samples in the mid-intensity stratum (X, 40 < CT ≤ 43) versus the high-intensity stratum (Y, CT <40) for infants (left) and mothers (right).
Color shows calendar week (for clarity, weeks in 2016 are not shown). These strata are highly correlated: ρ = 0.68 (infants); ρ = 0.71 (mothers). The many weeks with Y = 0 and X > 0 illustrates the relatively low sensitivity of the high-intensity stratum. Indeed, the mid-intensity stratum detects a pertussis outbreak 2–3 weeks before the high-intensity stratum in April 2015 in both infants and mothers.
Figure 5.
Figure 5.. IS481 detections by infant age, showing wP vaccination schedule.
(A) number of infant NP samples per week. Shading shows the number of wP doses received at least 14 days prior to sample collection. With rare exceptions, each infant sample is accompanied by a corresponding mother’s sample. In most cases, the third wP dose was administered on the final study visit. (B) percent of NP samples with detectable IS481 over time with 95% CI (shading), estimated from generalized additive models (one each for mothers and infants). Infant age was a significant predictor of percent detection in infants only, while prior wP dose had no observable impact on percent detection in either infants or mothers.
Figure 6.
Figure 6.. Transition frequency between IS481 CT strata over adjacent pairs of assays (within subjects) for infants (left) and mothers (right).
Assay pairs separated by more than 25 days are omitted. N shows total transitions from each CT stratum (row); text shows percent of row total (N) within each cell. Assays were bootstrap resampled to generate a null distribution (1000 draws). Color shows standardized residuals: the difference between observed and expected frequency divided by the standard error of the difference. Transitions from detecting to detecting are more common than expected by chance alone (red), while transitions from detecting to non-detecting are much less frequent than expected (blue). See Table 3 for marginal frequencies in each CT stratum.
Figure 7.
Figure 7.. Quantifying evidence for pertussis infection, and concordance of evidence within mother/infant pairs.
(A) Reverse cumulative distribution (RCD) curves of IS481 CT values for mothers and infants. (B) Boxplot summarizing evidence for infection (EFI), stratified by number of detecting assays per subject (x-axis). For each subject, EFI equals one minus the geometric mean RCD proportions (as in A). In general, EFI increases with lower CT values (A) and more detecting assays. The dashed line delineates strong evidence (defined to include all subjects with ≥3 detecting assays, 0.52 ≤ EFI < 1) from weak evidence (0 < EFI < 0.52); dotted line delineates no evidence (EFI = 0). (C) EFI in mother/infant pairs. Dotted and dashed lines as in B for mothers (vertical) and infants (horizontal). (D) Association of EFI strength (from C) between mothers and infants, showing very strong concordance (red) and rare discordance (blue) within pairs, particularly for pairs exhibiting strong EFI. Bar widths are proportional to expected counts; bar height and color show Pearson residuals (scaled difference between observed and expected counts). p-Value and residuals are relative to independent association. See also Figure 7—figure supplement 1.
Figure 7—figure supplement 1.
Figure 7—figure supplement 1.. As in Figure 7, varying the threshold of Strong EFI (dashed line) to include all individuals with ≥2, 3, or 4 detecting assays (A-C, respectively).
As the threshold increases from A to C, strong EFI is observed in fewer individuals (and weak EFI in more), but the pattern of association between mothers and infants remains largely unchanged.
Figure 8.
Figure 8.. Association between participant EFI (as in Figure 7) and documented pertussis symptoms (A–B) or antibiotic use (C–D), separating mothers and infants (columns).
Minimal symptoms include cough and/or coryza only; bar heights and p-values as in Figure 7D. In A-B, frequent co-occurrence of strong EFI with minimal symptoms is evident in both mothers and infants, as is no symptoms with no EFI. In infants, moderate to severe symptoms commonly co-occur with strong EFI, while more severe symptoms are rare in mothers. In C-D, frequent co-occurrence of antibiotic use with strong EFI is evident in both mothers and infants. See also Table 4 and Figure 8—figure supplement 1.
Figure 8—figure supplement 1.
Figure 8—figure supplement 1.. Association between NP sample IS481 CT strata (columns, as in Figure 3) and presence of cough and/or coryza for A, infants, and B, mothers.
Bar widths are proportional to expected counts; bar height and color show Pearson residuals: the scaled difference between observed and expected counts (assuming independent association). Higher CT values were more commonly observed in infants experiencing cough and/or coryza; in symptom-free infants, IS481 was less likely to be detected. A similar but much less pronounced pattern was observed in mothers.

Similar articles

Cited by

References

    1. Althouse BM, Scarpino SV. Asymptomatic transmission and the resurgence of Bordetella pertussis. BMC Medicine. 2015;13:146. doi: 10.1186/s12916-015-0382-8. - DOI - PMC - PubMed
    1. Armangil D, Tekinalp G, Yurdakök M, Yalçin E. Maternal pertussis is hazardous for a newborn: a case report. The Turkish Journal of Pediatrics. 2010;52:206–210. - PubMed
    1. Bisgard KM, Pascual FB, Ehresmann KR, Miller CA, Cianfrini C, Jennings CE, Rebmann CA, Gabel J, Schauer SL, Lett SM. Infant pertussis: who was the source? The Pediatric Infectious Disease Journal. 2004;23:985–989. doi: 10.1097/01.inf.0000145263.37198.2b. - DOI - PubMed
    1. Bolotin S, Quinn H, McIntyre P. Epilogue. In: Rohani P, Scarpino S. V, editors. Pertussis: Epidemiology, Immunology and Evolution. Oxford University Press; 2018. pp. 1–2. - DOI
    1. Brooks DA, Clover R. Pertussis infection in the united states: role for vaccination of adolescents and adults. The Journal of the American Board of Family Medicine. 2006;19:603–611. doi: 10.3122/jabfm.19.6.603. - DOI - PubMed

Publication types

MeSH terms

Substances