. 2021 Jun 7;17(6):e1008971.
doi: 10.1371/journal.pcbi.1008971. eCollection 2021 Jun.

Analogous computations in working memory input, output and motor gating: Electrophysiological and computational modeling evidence

Affiliations

Analogous computations in working memory input, output and motor gating: Electrophysiological and computational modeling evidence

Rachel Rac-Lubashevsky et al. PLoS Comput Biol. .

Abstract

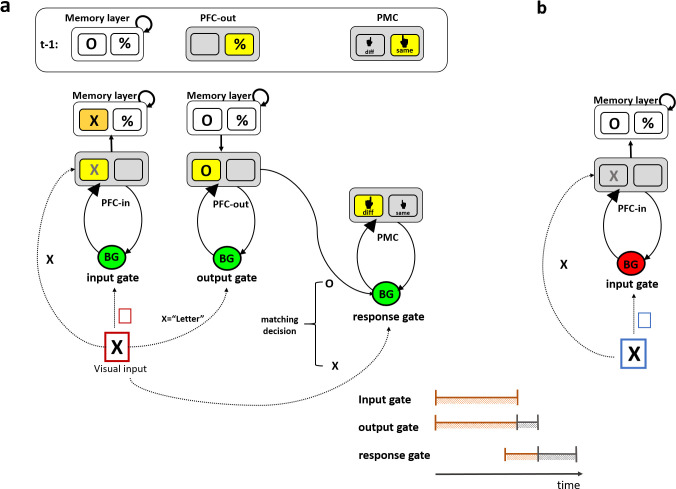
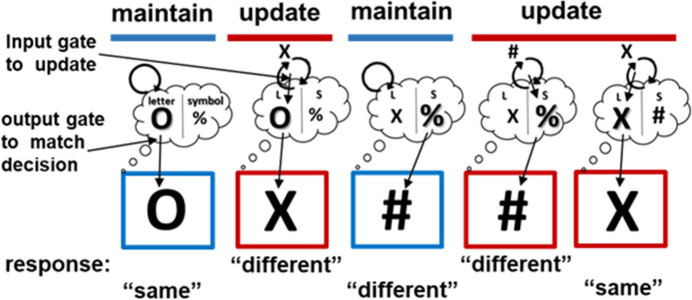
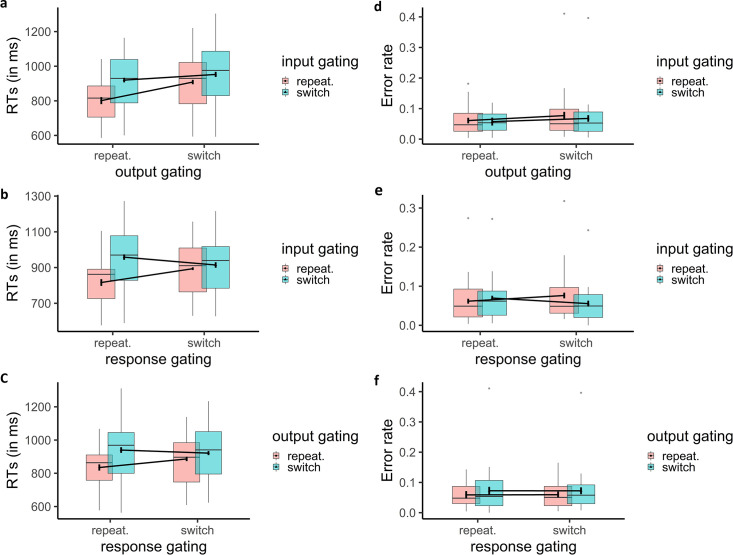
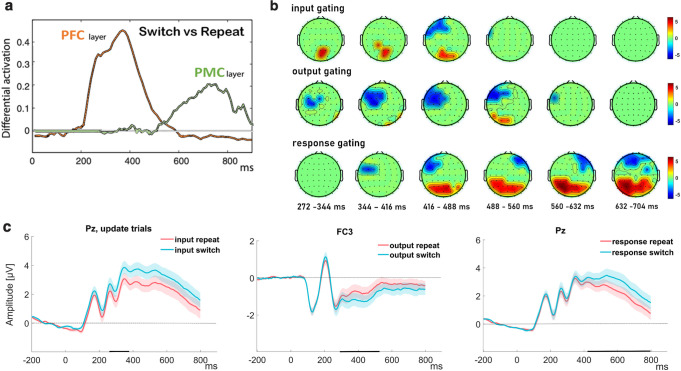
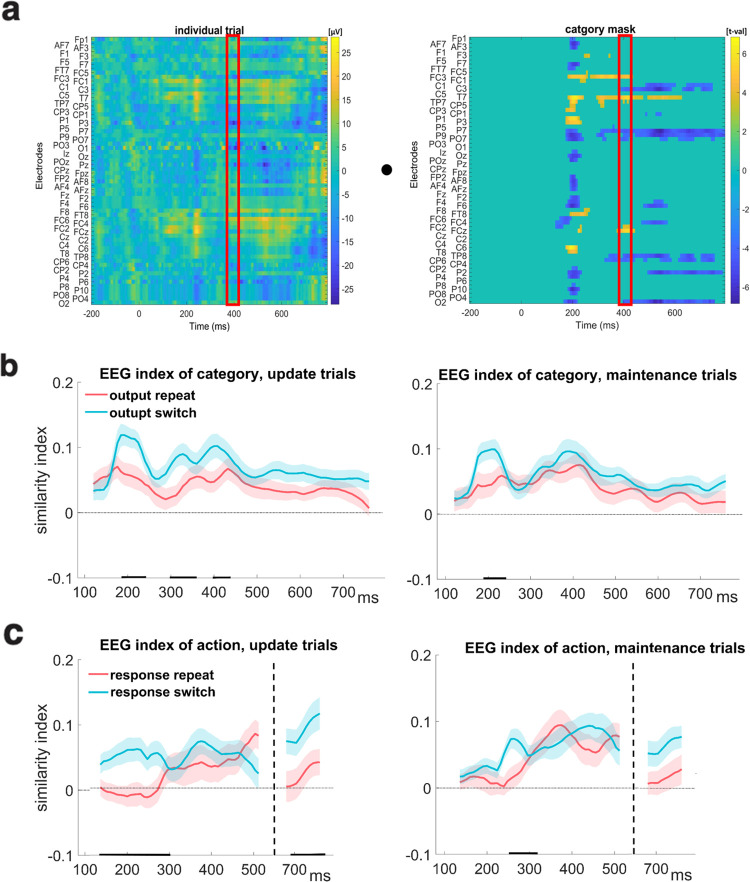
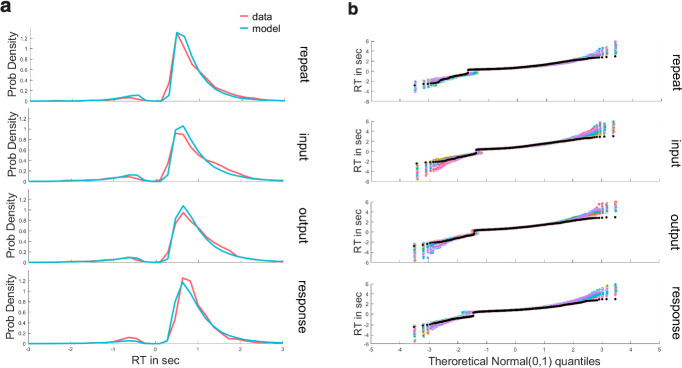
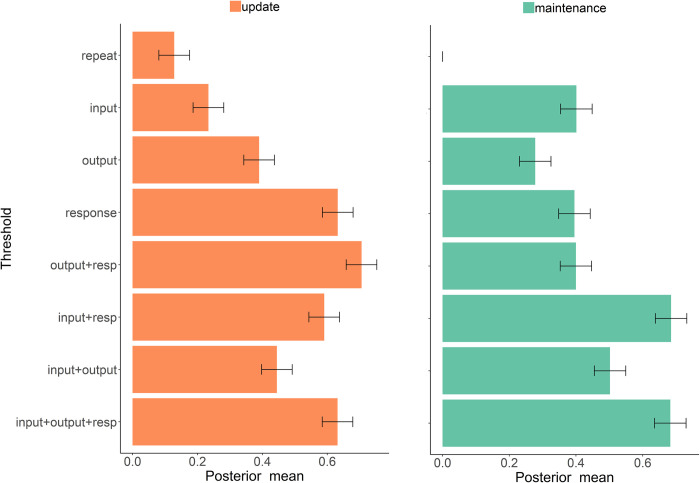
Adaptive cognitive-control involves a hierarchical cortico-striatal gating system that supports selective updating, maintenance, and retrieval of useful cognitive and motor information. Here, we developed a task that independently manipulates selective gating operations into working-memory (input gating), from working-memory (output gating), and of responses (motor gating) and tested the neural dynamics and computational principles that support them. Increases in gating demands, captured by gate switches, were expressed by distinct EEG correlates at each gating level that evolved dynamically in partially overlapping time windows. Further, categorical representations of specific maintained items and of motor responses could be decoded from EEG when the corresponding gate was switching, thereby linking gating operations to prioritization. Finally, gate switching at all levels was related to increases in the motor decision threshold as quantified by the drift diffusion model. Together these results support the notion that cognitive gating operations scaffold on top of mechanisms involved in motor gating.


Conflict of interest statement

The authors have declared that no competing interests exist.

Figures

Fig 1
Fig 1. Schematic of the PBWM architecture for canonical gating operations.
(a) The gating system is composed of three core circuits that are hierarchically arranged from left to right. For illustration the operations needed to solve the task used in this paper are shown. At the beginning of a trial, the memory layer actively maintains the information from the previous trial (e.g., “O” and “%”). Sensory information (e.g., the “X” in the visual input) is transiently represented in a prefrontal cortex layer (labeled “PFC-in”). The input gate controls whether the new visual information (e.g., “X”) is updated to be maintained in a PFC memory layer, and if so, to which address or anatomical “stripe” within that layer (selective gating). The colored frame in the visual input represents a task cue signifying the updating policy that should be taken by the input gate. In this example, the red frame indicates that memory should be updated, so the input gate selectively updates the right PFC stripe (corresponding with the letter category, replacing the “O” in memory with “X”). The output gate controls which memory representations is prioritized in PFC-out (e.g., a deep layer of the PFC) to influence subsequent processing (e.g., here the relevant representation in memory is “O” and not “%”, given that the input to be compared is in the letter category). The response gate controls which motor response to select (e.g., here “same” (S) or “different” (D)) in posterior prefrontal layer (labeled here PMC), by comparing the output-gated memory representation (“O”) with the current visual input (“X”). Gate switching at the output and response gates are reflected by the change in the active stripe between the previous trial (t-1) and in the current trial. (b) An example of a maintenance trial. The blue task cue indicates that the appropriate updating policy is maintenance, and thus sensory information (e.g., “X”) is prevented from being updated in PFC memory (the gating signal from the BG is therefore a No-Go, indicated by the red BG). Gate switching in the input gate corresponds with moving between updating state (as shown in a) and maintenance state (as shown in b). Yellow squares indicate active stripe selected by the corresponding gate. The orange square represents the newly updated stripe in memory. The predicted temporal order of the gating loops is depicted at the bottom right of the figure with input and output gating starting roughly at the same time continuing in parallel (indicated in orange) with output gating terminating later (serial termination indicated in grey). The response gate is expected to initiate with some delay due to conflict at upper levels, and to terminate even later than the output gate.
Fig 2
Fig 2. Trial events in the reference-back-2 task.
Trials with red frame are updating trials, while blue trials are maintenance trials. On each trial, participants make a matching decision between the probe and last stimulus presented in red from the same category. Each side of the thought bubble represents an address (or PFC “stripe”) in WM. During updating, input gates assign information to an address based on its category. During output gating, the relevant category is accessed from memory for the decision. The response gate makes the same/different selection. See the method section for more detail.
Fig 3
Fig 3. Behavioral effects of switching in gating demands.
Mean RT (a-c) and error rate (d-f) demonstrate under-additive interactions at all levels (output and response, input and response and, input and output).
Fig 4
Fig 4
(a) Summed activation over units in PFC-BG neural network, showing impact of gate switch vs repeat early in PFC and later in motor cortex (adapted from [62]). (b-c) Current study. (b) Scalp map topography for the predictors that survived permutation correction for the three gating types (input in updating trials, output, response in three rows from top to bottom). The color in the scalp map represent the t-value of the average regression weights in each electrode at the time range indicated above each scalp map. Input, output and response gating signatures evolve sequentially in time, but with clear temporal overlap. (c) Grand ERP plots at representative electrodes from the significant univariate patterns show significant and dissociable effects for switching during input, output and response gating. The shaded error bars represent standard error of the mean (SEM) and the black markers on the x-axis reflect the time points where the difference between switch and repeat was significant.
Fig 5
Fig 5. Temporal dynamics of neural prioritization by gating.
(a) Trial-by-trial indexing of gated representations. Univariate patterns were identified for each representation of interest using GLM. Trial by trial similarity indices obtained by computing the dot-product between the 2D voltage-time map on individual trials with that of the mask for the relevant representation. As an example, the similarity computation with the category mask is shown. This similarity index is obtained over sliding window time bins (red rectangle). The result is a temporally evolving EEG index of similarity in time points for which the mask was significant (see methods for more detail). (b-c) The temporal dynamics of similarity indices to the relevant representations in updating (left) and maintenance (right) trials. (b) The neural similarity to the selected category enhanced following switches in the output gate. (c) The neural similarity to the selected action enhanced following switches in the response gate. Note that the GLM mask of action was significant in two time windows (in an early window between 100-500ms and in a later window 670-800ms) that are separated by the black dashed line (in between these periods the mask was not significant, and hence there is no similarity to plot). The shaded error bars represent standard error of the mean (SEM). The black markers on the x-axis reflect the time points where the similarity index differed between switch and repeat (see methods for more detail).
Fig 6
Fig 6. Model fit.
(a) Behavioral RT distributions across the group are shown for switching at each level (red line) together with posterior predictive simulation from the HDDM (light blue) in updating trials. Distributions of correct (the right positive tail) and incorrect (left negative tail) trials show good correspondence between data and model. (b) Model fit with Quantile-Quantile plots. Model fit to behavior can be more precisely viewed using quantile-quantile plots, showing quantiles of the empirical behavioral RT distributions (black) against the 50 simulation of RT distribution (colored lines, capturing model uncertainty) from the posterior predictive of the HDDM model, for correct response (positive RT) and incorrect responses (negative RT) in updating trials. Quantiles were computed at the group level. The empirical RT was mostly within the range of the simulated RT with a small over-estimation at the right tail of the distribution.
Fig 7
Fig 7. Under-additive interaction between gating selections.
Decision threshold parameter estimates from HDDM in updating (orange bars) and maintenance trials (green bars), exhibit main effects of gate switching at each independent level of gating (input, output, and response), and under-additive interactions between gate switches in input-output, input-response, and output-response. Error bars reflect within-subject 95% highest density interval of the posterior distribution, in each case relative to maintenance repeat trials.

References

    1. Miller EK, Cohen JD. An integrative theory of prefrontal cortex function. Annual review of neuroscience. 2001; 24: 167–202. doi: 10.1146/annurev.neuro.24.1.167 - DOI - PubMed
    1. Braver TS. The variable nature of cognitive control: a dual mechanisms framework. Trends in cognitive sciences. 2012; 16: 106–113. doi: 10.1016/j.tics.2011.12.010 - DOI - PMC - PubMed
    1. Dreisbach G, Fröber K. On how to be flexible (or not): Modulation of the stability-flexibility balance. Current Directions in Psychological Science. 2019; 28: 3–9.
    1. Goschke T, Bolte A. Emotional modulation of control dilemmas: The role of positive affect, reward, and dopamine in cognitive stability and flexibility. Neuropsychologia. 2014; 62: 403–423. doi: 10.1016/j.neuropsychologia.2014.07.015 - DOI - PubMed
    1. Braver TS, Cohen JD. On the control of control: The role of dopamine in regulating prefrontal function and working memory. Control of cognitive processes: Attention and performance XVIII. 2000: 713–737.

Publication types