. 2021 Jun 7;16(6):e0252565.
doi: 10.1371/journal.pone.0252565. eCollection 2021.

Studying the functional connectivity of the primary motor cortex with the binarized cross recurrence plot: The influence of Parkinson's disease

Affiliations

Studying the functional connectivity of the primary motor cortex with the binarized cross recurrence plot: The influence of Parkinson's disease

Clara Rodriguez-Sabate et al. PLoS One. .

Abstract

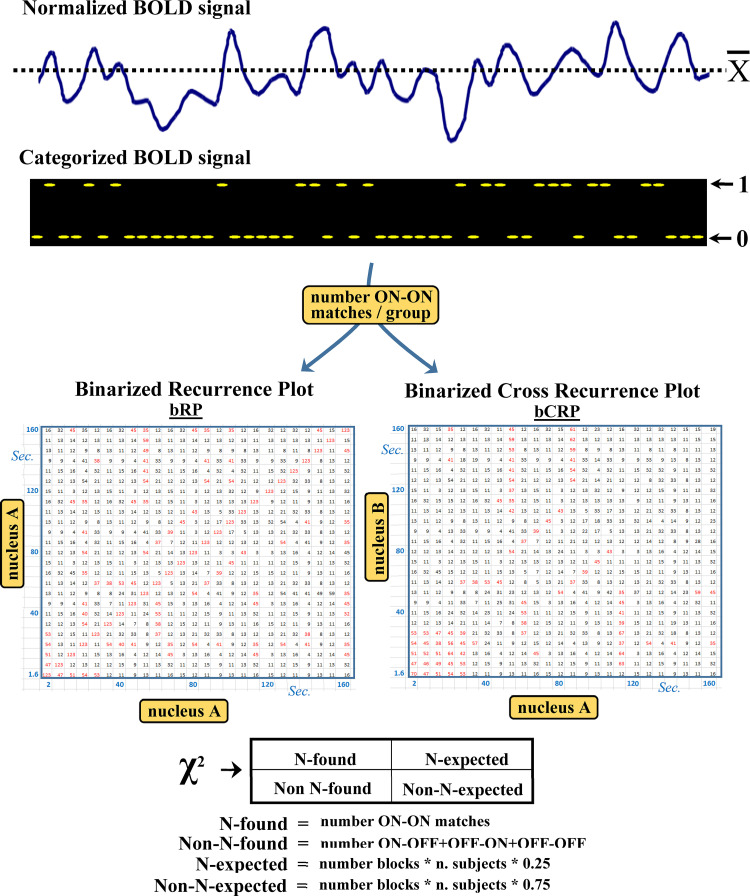
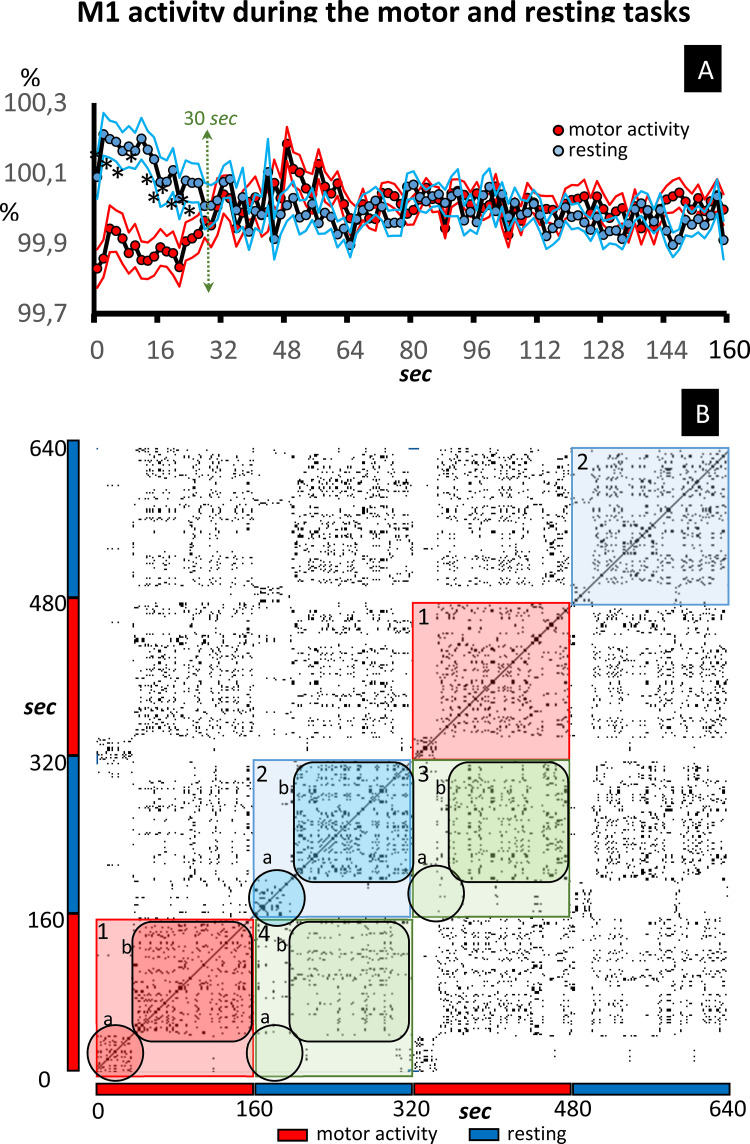
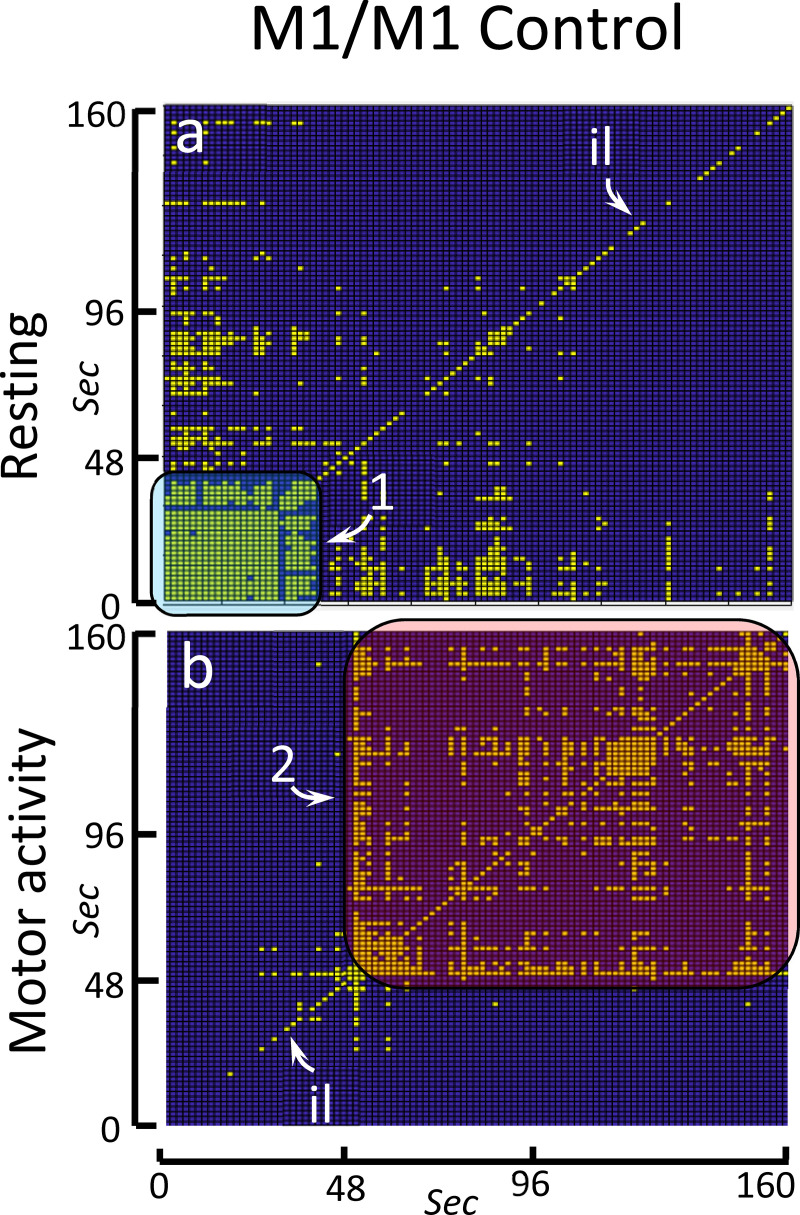
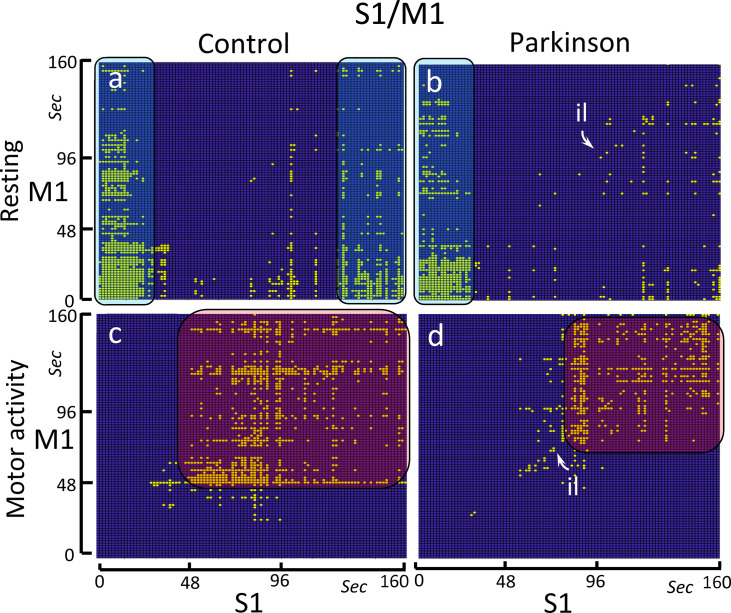
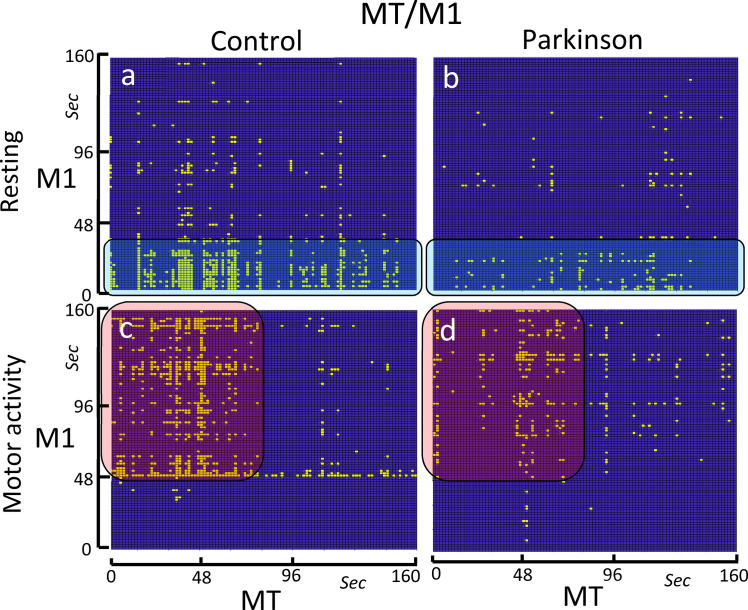
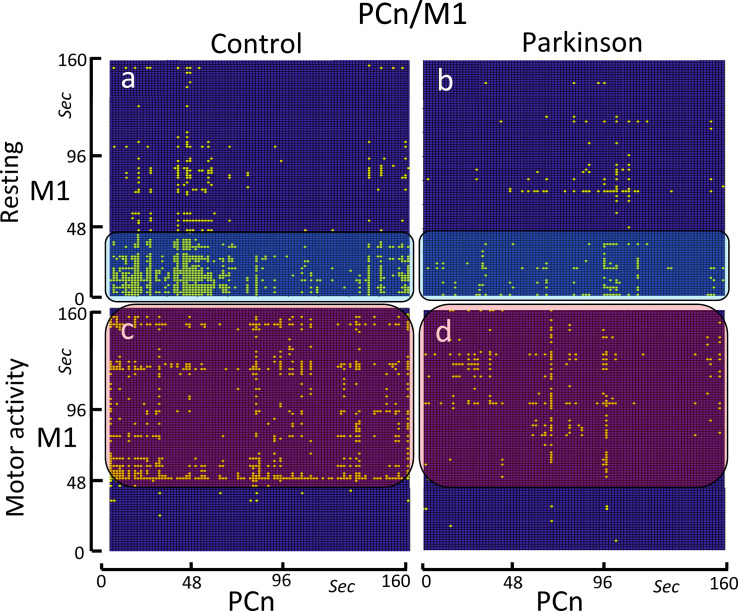
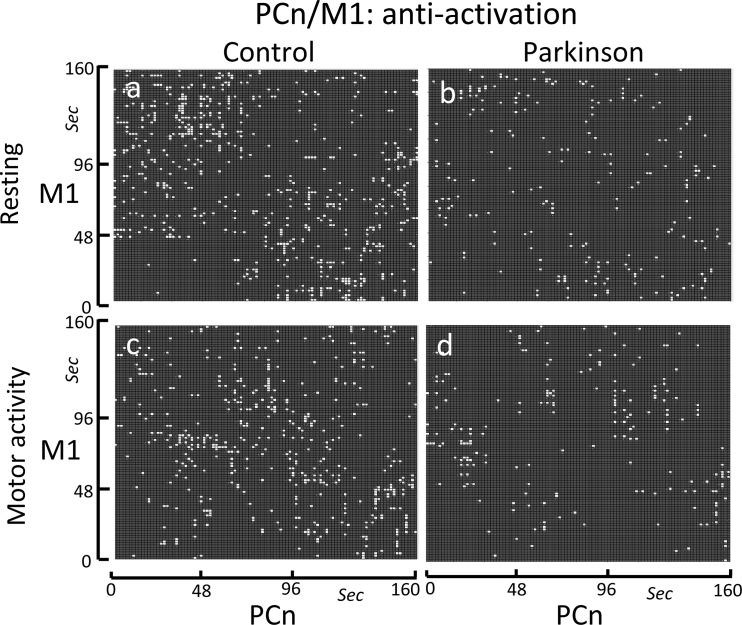
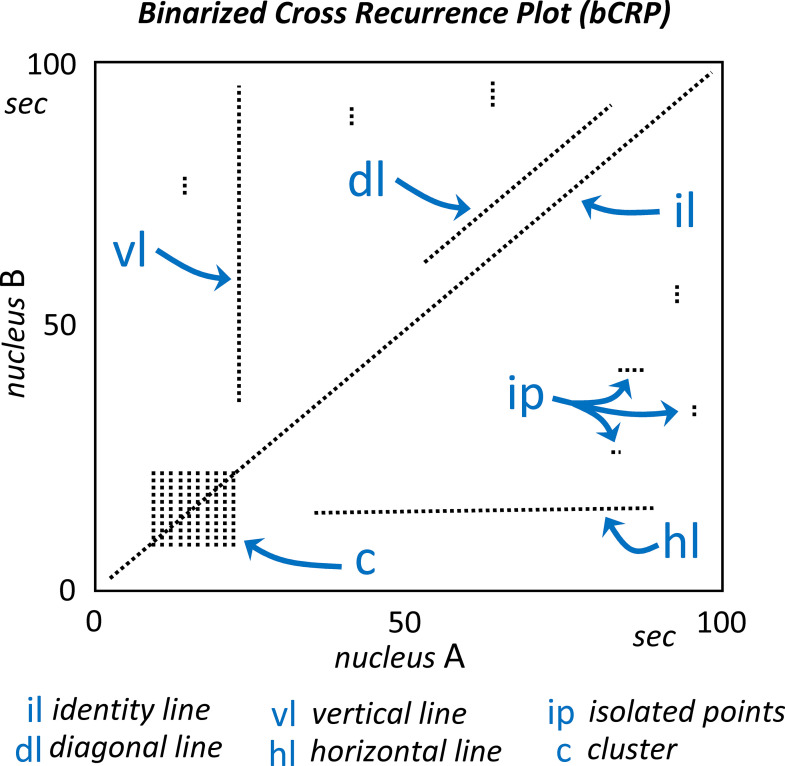
Two new recurrence plot methods (the binary recurrence plot and binary cross recurrence plot) were introduced here to study the long-term dynamic of the primary motor cortex and its interaction with the primary somatosensory cortex, the anterior motor thalamus of the basal ganglia motor loop and the precuneous nucleus of the default mode network. These recurrence plot methods: 1. identify short-term transient interactions; 2. identify long-lasting delayed interactions that are common in complex systems; 3. work with non-stationary blood oxygen level dependent (BOLD) data; 4. may study the relationship of centers with non-linear functional interactions; 5 may compare different experimental groups performing different tasks. These methods were applied to BOLD time-series obtained in 20 control subjects and 20 Parkinson´s patients during the execution of motor activity and body posture tasks (task-block design). The binary recurrence plot showed the task-block BOLD response normally observed in the primary motor cortex with functional magnetic resonance imaging methods, but also shorter and longer BOLD-fluctuations than the task-block and which provided information about the long-term dynamic of this center. The binary cross recurrence plot showed short-lasting and long-lasting functional interactions between the primary motor cortex and the primary somatosensory cortex, anterior motor thalamus and precuneous nucleus, interactions which changed with the resting and motor tasks. Most of the interactions found in healthy controls were disrupted in Parkinson's patients, and may be at the basis of some of the motor disorders and side-effects of dopaminergic drugs commonly observed in these patients.


Conflict of interest statement

The authors have declared that no competing interests exist.

Figures

Fig 1
Fig 1. The binarized recurrence plot (bRP) and binarized cross recurrence plot (bCRP) methods.
BOLD data are normalized as percentages of the mean BOLD-value of each subject (A) and binarized by replacing the data higher than the mean value with the number 1 (which represent a status of high-metabolic activity) and those lower or equal to the mean value with the number 0 (low metabolic activity) (B). The next step is to calculate the number of 1–1 matches (ON-ON matches) for the bRP and bCRP. The bRP computes the ON-ON match matrix of each task-block of each subject (ON-ON matches of each time-point regarding all the time-points of the same block). This is a 100x100 matrix whose elements can be 1 (ON-ON match) or 0 (ON-ON mismatch). The bRP was computed by adding the two ON-ON match matrices of the same experimental-block of each subject to those of all the other subjects of the experimental group (C). Thus, each of the 100x100 elements of the bRP have a value between 0 (no ON-ON matches) and 40 (the 20 subjects of each group showed ON-ON matches in both task-blocks). The bCRP was computed with the same procedure but using the ON-ON matches of a particular brain region with those recorded in another brain region (D). Thus, whereas the bRP shows the time-dynamic of a brain region, the bCRP shows the time-dynamic of the relationship between two brain regions. The statistical significance (D) of each value of the bRP and bCRP matrices was computed with a Chi2 test. The bRP and bCRP values are between 0 and 40 and each of the four possible combinations of the ON and OFF status should be found 25% of times. The distance between the expected and found numbers of ON-ON matches was established using the Chi2 distribution, and only values with a Chi2 probability lower than 0.01% were considered.
Fig 2
Fig 2. Recurrence plot of the M1 activity.
Fig 2A shows the mean ± standard error of the BOLD signal (data normalized as a percentage of the mean value of each subject) recorded in the M1 of control subjects. The data recorded during the motor-task block are shown in red (grouping the 1–160 sec and 320–480 sec time-intervals). The data recorded during the resting-task block are shown in blue (grouping 160–320 sec and 480–640 sec time-intervals). Fig 2B shows a typical RP example of the M1 dynamic in control subjects. The identity line is the diagonal line which goes from the bottom-left to the top-right. The checkerboard distribution shows the limits that coincide with the task-transitions (1: motor-block and 2: resting-block). The points included in squares 3 and 4 show the functional link between the motor-block and the resting block. The initial and late responses of each block are indicated by the letters a and b, respectively.
Fig 3
Fig 3. Binarized recurrence plot of the M1 activity in the control group.
The bRP shows the main facts observed in the RP of the individual members of the control group. Yellow spots indicate ON-ON matches with a significant high frequency (p<0.01). The significant ON-ON matches are shown is a (resting-task block) and b (motor-task block). Id: identity line. 1: initial response. 2: late response.
Fig 4
Fig 4. Binarized cross recurrence plot of the S1-M1 functional connectivity.
Images show the significant ON-ON matches of S1-M1 in the control group (left-side) and PD patients (right-side), and during resting-task (top) and the motor-task (bottom). The control group shows a high-density ON-ON match at the beginning (0–25 sec) and at the end (130–160 sec) of the resting-task block (Fig 4A), and between the 45–160 sec of the motor-task block (Fig 4C). The PD group shows an identity line (il) which is particularly evident during the motor-task block (Fig 4D). In this group, the high-density ON-ON match at the end (130–160 sec) of the resting-task block vanished (Fig 4B) and the amplitude of the ON-ON match during the motor-task block decreased (Fig 4D).
Fig 5
Fig 5. Binarized cross recurrence plot of the MT-M1 functional connectivity.
Images show the significant ON-ON matches of MT-M1 in the control group (left-side) and PD patients (right-side), and during resting-task (top) and the motor-task (bottom). The control group shows a high-density ON-ON match at the beginning (0–40 sec) of the resting-task block (Fig 5A), and between the 50–160 sec of the motor-task block (Fig 5C). The PD group shows a decrease of the ON-ON match density in both the resting-task block (Fig 5B) and the motor-task block (Fig 5D).
Fig 6
Fig 6. Binarized cross recurrence plot of the PCn-M1 functional connectivity.
Images show the significant ON-ON matches of PCn-M1 in the control group (left-side) and PD patients (right-side), and during resting-task (top) and the motor-task (bottom). The control group shows a high-density ON-ON match at the beginning (0–40 sec) of the resting-task block (Fig 6A), and between the 50–160 sec of the motor-task block (Fig 6C). The PD group shows a decrease of the ON-ON match density in both the resting-task block (Fig 6B) and the motor-task block (Fig 6D).
Fig 7
Fig 7. Binarized cross recurrence plot of the anti-activations of the PCn-M1 functional connectivity.
Images show the significant anti-activations (ON-OFF + OFF-ON matches) of PCn-M1 in the control group (left-side) and PD patients (right-side), and during resting-task (top) and the motor-task (bottom). The anti-activations showed a short-lasting scattered distribution in the control group during both the resting-task block (Fig 7A) and motor-task block (Fig 7C). PD patients showed a similar short-lasting scattered distribution, but the anti-activation density was much lower in this group (Fig 7B and 7D).
Fig 8
Fig 8. The interpretation of the bCRP.
The central oblique line (identity line; il) indicates the instantaneous functional coupling between the nucleous A and B. The other oblique lines (diagonal lines; dl) reveal a delayed functional coupling of the two regions (the length of these lines are considered as an indicator of predictability). The vertical (vl) and horizontal (hl) lines indicate the persistent action of a brain area on the dynamic of another area (what happens at a specific moment in one area affects the other area over a long period of time). The isolated points (ip) indicate short-term couplings in the activity of two brain areas, and clusters forming squares (C) indicate that the two areas have an intensive coupling during the time-interval corresponding to the side of the square.

Similar articles

Cited by

References

    1. Ticini LF, Schutz-Bosbach S, Waszak F. From goals to muscles: motor familiarity shapes the representation of action-related sounds in the human motor system. Cogn Neurosci. 2019;10(1):20–9. doi: 10.1080/17588928.2018.1424128 . - DOI - PubMed
    1. Nelson AB, Kreitzer AC. Reassessing models of basal ganglia function and dysfunction. Annu Rev Neurosci. 2014;37:117–35. doi: 10.1146/annurev-neuro-071013-013916 ; PubMed Central PMCID: PMC4416475. - DOI - PMC - PubMed
    1. Parent A, Hazrati LN. Functional anatomy of the basal ganglia. I. The cortico-basal ganglia-thalamo-cortical loop. Brain Res Brain Res Rev. 1995;20(1):91–127. doi: 10.1016/0165-0173(94)00007-c . - DOI - PubMed
    1. Rodriguez-Sabate C, Sabate M, Llanos C, Morales I, Sanchez A, Rodriguez M. The functional connectivity in the motor loop of human basal ganglia. Brain Imaging Behav. 2017;11(2):417–29. doi: 10.1007/s11682-016-9512-y . - DOI - PubMed
    1. Petrof I, Viaene AN, Sherman SM. Properties of the primary somatosensory cortex projection to the primary motor cortex in the mouse. J Neurophysiol. 2015;113(7):2400–7. doi: 10.1152/jn.00949.2014 ; PubMed Central PMCID: PMC4416606. - DOI - PMC - PubMed

Publication types