

Worldwide dynamic biogeography of zoonotic and anthroponotic dengue
- PMID: 34097704
- PMCID: PMC8211191
- DOI: 10.1371/journal.pntd.0009496
Worldwide dynamic biogeography of zoonotic and anthroponotic dengue
Abstract
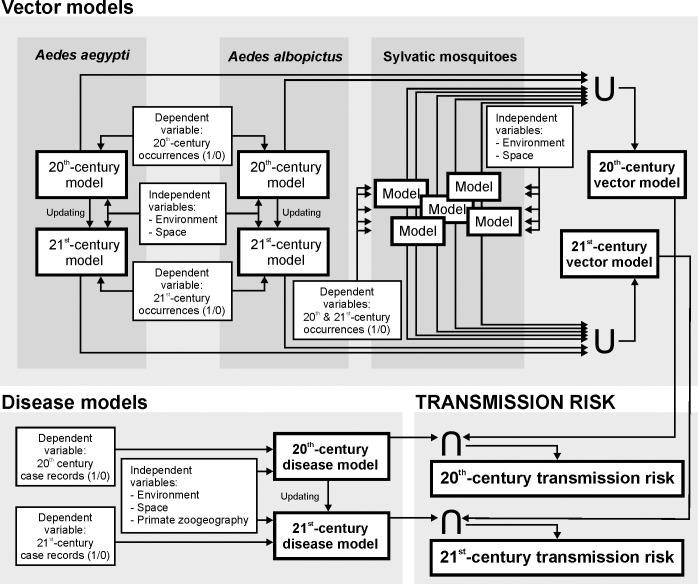
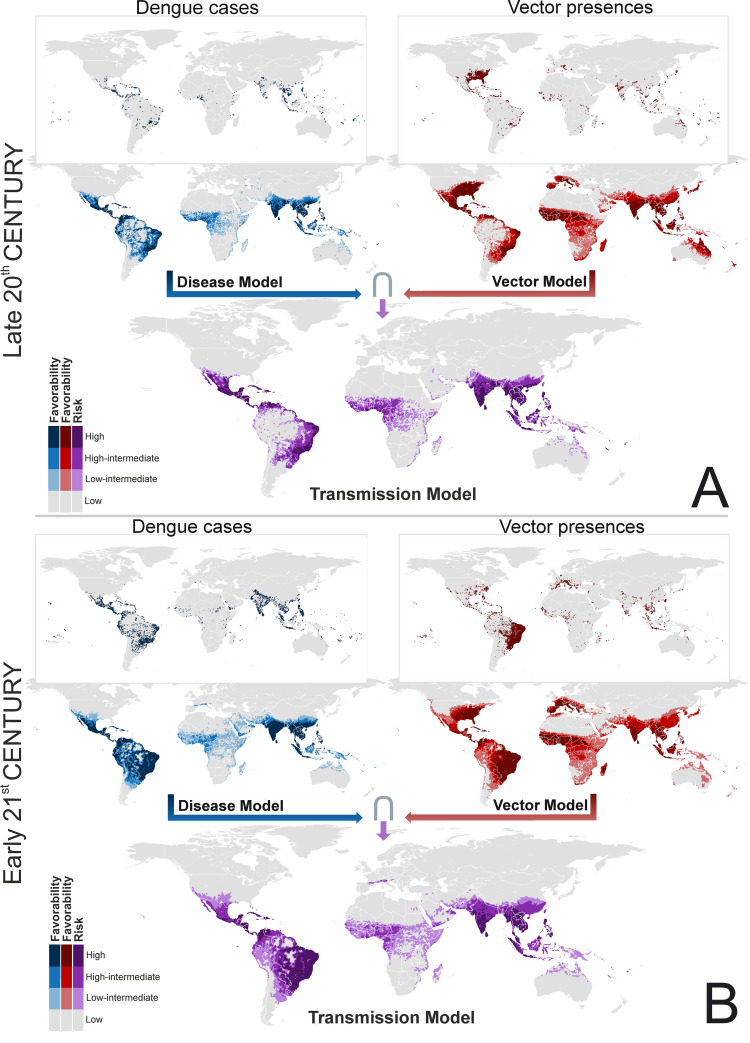
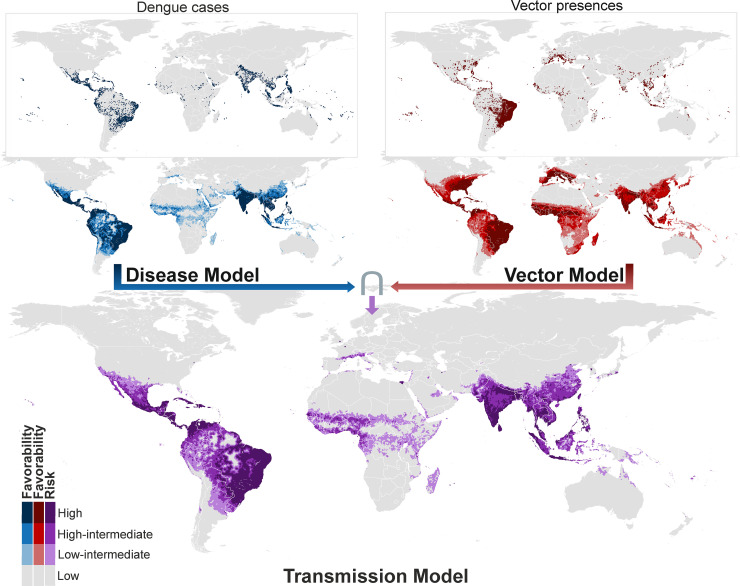
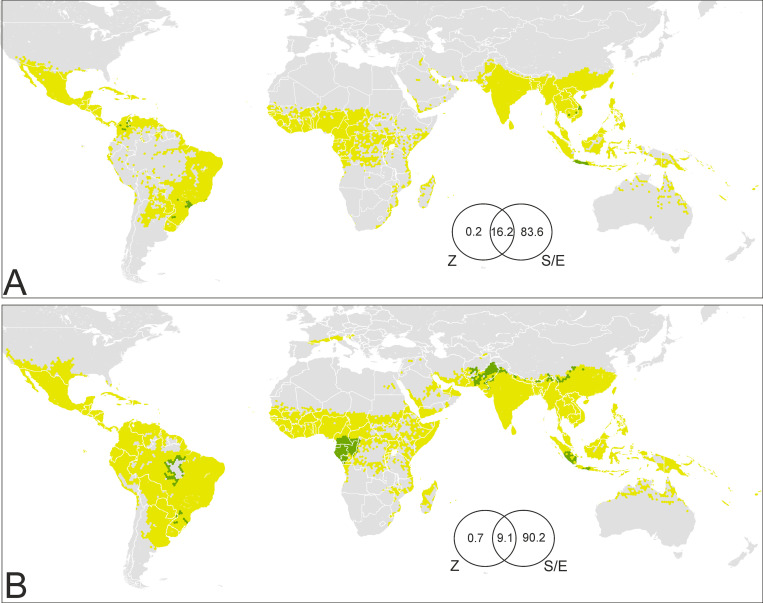
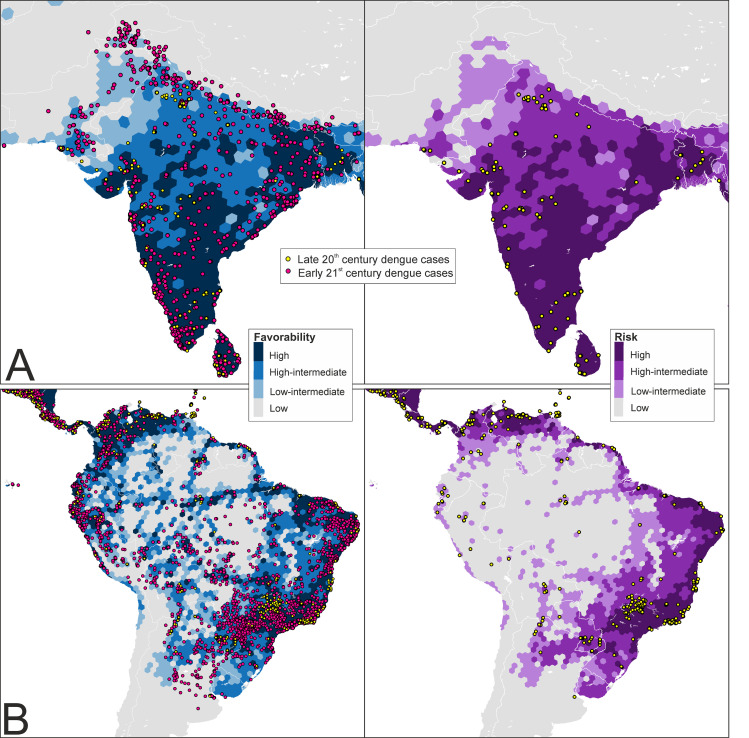
Dengue is a viral disease transmitted by mosquitoes. The rapid spread of dengue could lead to a global pandemic, and so the geographical extent of this spread needs to be assessed and predicted. There are also reasons to suggest that transmission of dengue from non-human primates in tropical forest cycles is being underestimated. We investigate the fine-scale geographic changes in transmission risk since the late 20th century, and take into account for the first time the potential role that primate biogeography and sylvatic vectors play in increasing the disease transmission risk. We apply a biogeographic framework to the most recent global dataset of dengue cases. Temporally stratified models describing favorable areas for vector presence and for disease transmission are combined. Our models were validated for predictive capacity, and point to a significant broadening of vector presence in tropical and non-tropical areas globally. We show that dengue transmission is likely to spread to affected areas in China, Papua New Guinea, Australia, USA, Colombia, Venezuela, Madagascar, as well as to cities in Europe and Japan. These models also suggest that dengue transmission is likely to spread to regions where there are presently no or very few reports of occurrence. According to our results, sylvatic dengue cycles account for a small percentage of the global extent of the human case record, but could be increasing in relevance in Asia, Africa, and South America. The spatial distribution of factors favoring transmission risk in different regions of the world allows for distinct management strategies to be prepared.
Conflict of interest statement
The authors have declared that no competing interests exist.
Figures
Similar articles
-
Human Urban Arboviruses Can Infect Wild Animals and Jump to Sylvatic Maintenance Cycles in South America.Front Cell Infect Microbiol. 2019 Jul 17;9:259. doi: 10.3389/fcimb.2019.00259. eCollection 2019. Front Cell Infect Microbiol. 2019. PMID: 31380302 Free PMC article. Review.
-
Abundance and distribution of sylvatic dengue virus vectors in three different land cover types in Sarawak, Malaysian Borneo.Parasit Vectors. 2017 Aug 31;10(1):406. doi: 10.1186/s13071-017-2341-z. Parasit Vectors. 2017. PMID: 28859676 Free PMC article.
-
A novel entomological index, Aedes aegypti Breeding Percentage, reveals the geographical spread of the dengue vector in Singapore and serves as a spatial risk indicator for dengue.Parasit Vectors. 2019 Jan 8;12(1):17. doi: 10.1186/s13071-018-3281-y. Parasit Vectors. 2019. PMID: 30621762 Free PMC article.
-
Dengue and chikungunya: long-distance spread and outbreaks in naïve areas.Pathog Glob Health. 2014 Dec;108(8):349-55. doi: 10.1179/2047773214Y.0000000163. Epub 2014 Dec 9. Pathog Glob Health. 2014. PMID: 25491436 Free PMC article. Review.
-
Seasonal temperature variation influences climate suitability for dengue, chikungunya, and Zika transmission.PLoS Negl Trop Dis. 2018 May 10;12(5):e0006451. doi: 10.1371/journal.pntd.0006451. eCollection 2018 May. PLoS Negl Trop Dis. 2018. PMID: 29746468 Free PMC article.
Cited by
-
Dengue Fever in Italy: The "Eternal Return" of an Emerging Arboviral Disease.Trop Med Infect Dis. 2022 Jan 13;7(1):10. doi: 10.3390/tropicalmed7010010. Trop Med Infect Dis. 2022. PMID: 35051126 Free PMC article. Review.
-
Potential climate change effects on the distribution of urban and sylvatic dengue and yellow fever vectors.Pathog Glob Health. 2024 Jul;118(5):397-407. doi: 10.1080/20477724.2024.2369377. Epub 2024 Jul 7. Pathog Glob Health. 2024. PMID: 38972071 Free PMC article.
-
Epidemiology of imported travelers with dengue fever in Taiwan from 2011 to 2020.Medicine (Baltimore). 2025 Jan 3;104(1):e41091. doi: 10.1097/MD.0000000000041091. Medicine (Baltimore). 2025. PMID: 40184127 Free PMC article.
-
Spatial study of dengue and its association with livestock farming in Bantul Regency, Yogyakarta Province, Indonesia.Vet World. 2024 Nov;17(11):2667-2674. doi: 10.14202/vetworld.2024.2667-2674. Epub 2024 Nov 28. Vet World. 2024. PMID: 39829672 Free PMC article.
-
HLA alleles and dengue susceptibility across populations in the era of climate change: a comprehensive review.Front Immunol. 2025 Apr 15;16:1473475. doi: 10.3389/fimmu.2025.1473475. eCollection 2025. Front Immunol. 2025. PMID: 40303409 Free PMC article. Review.
References
-
- World Health Organization. Dengue and severe dengue. In: WHO [Internet]. 2020. Available: https://www.who.int/news-room/fact-sheets/detail/dengue-and-severe-dengue
-
- World Health Organization. Global strategy for dengue prevention and control 2012–2020. 2012. Available: https://www.who.int/denguecontrol/9789241504034/en/
Publication types
MeSH terms
Associated data
LinkOut - more resources
Full Text Sources
Other Literature Sources
Medical
