. 2021 Jun 7;16(6):e0252758.
doi: 10.1371/journal.pone.0252758. eCollection 2021.

Sex and kidney ACE2 expression in primary focal segmental glomerulosclerosis: A NEPTUNE study

Affiliations

Sex and kidney ACE2 expression in primary focal segmental glomerulosclerosis: A NEPTUNE study

Nicholas A Maksimowski et al. PLoS One. .

Abstract

Background: Angiotensin-converting enzyme 2 (ACE2) has been implicated in the pathogenesis of experimental kidney disease. ACE2 is on the X chromosome, and in mice, deletion of ACE2 leads to the development of focal segmental glomerulosclerosis (FSGS). The relationship between sex and renal ACE2 expression in humans with kidney disease is a gap in current knowledge.

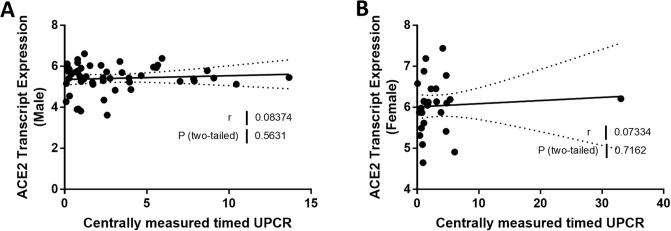
Methods: We studied renal tubulointerstitial microarray data and clinical variables from subjects with FSGS enrolled in the Nephrotic Syndrome Study Network (NEPTUNE) study. We compared relationships between ACE2 expression and age, estimated glomerular filtration rate (eGFR), urinary albumin to creatinine ratio (UACR), interstitial fibrosis, tubular atrophy, and genes implicated in inflammation and fibrosis in male and female subjects.

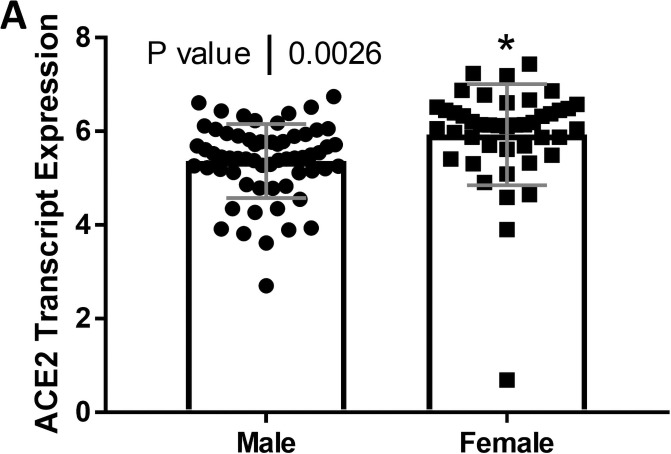
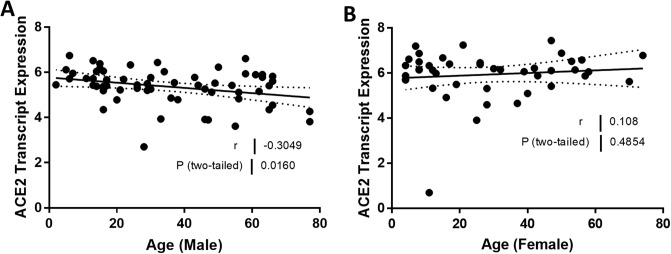
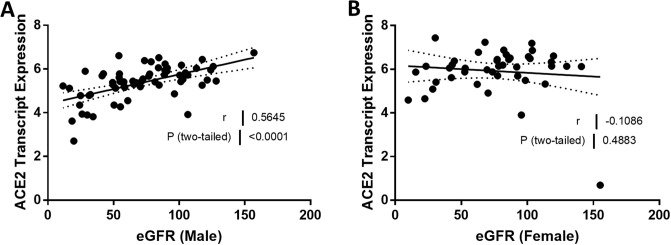
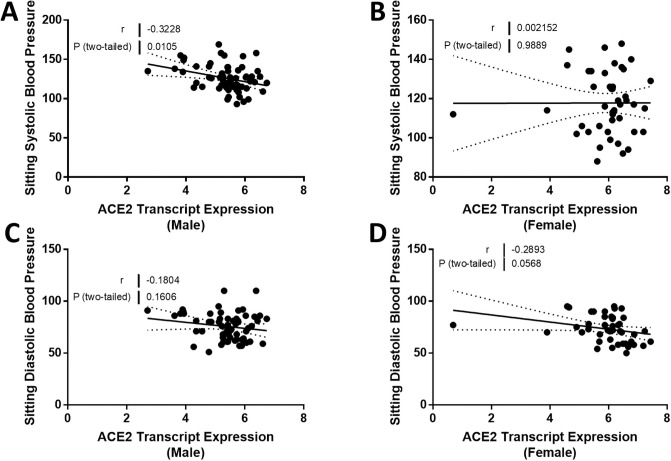
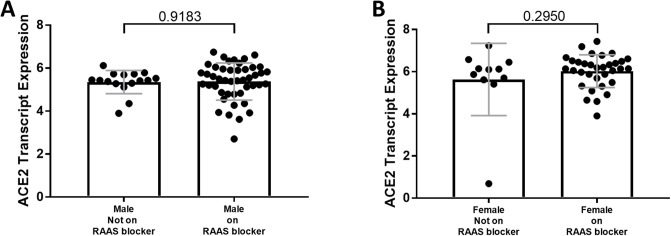
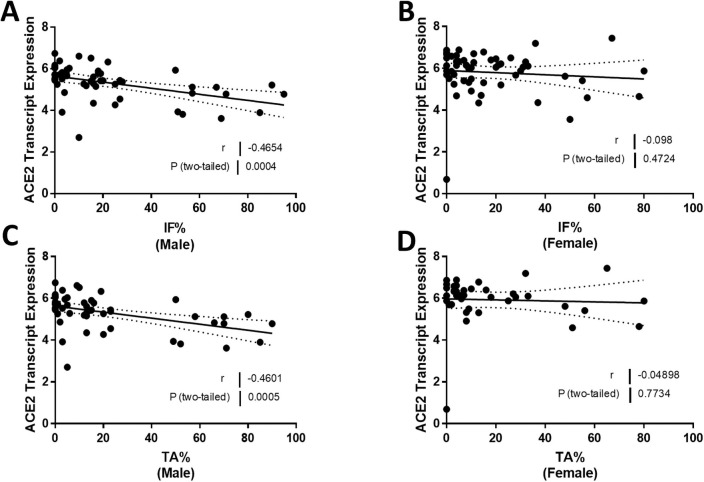
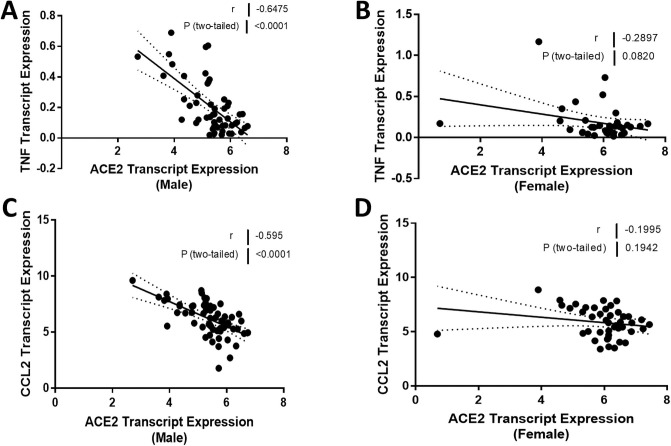
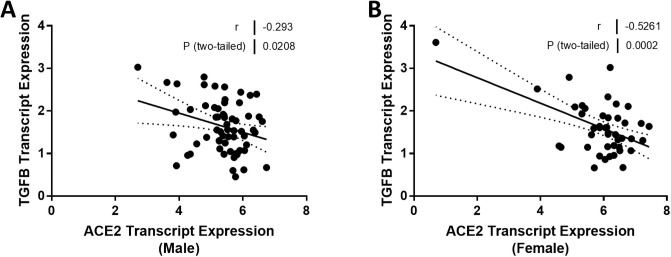
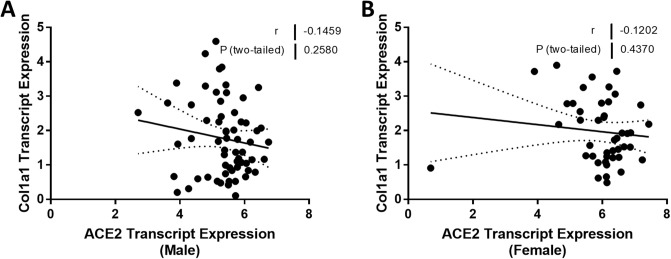
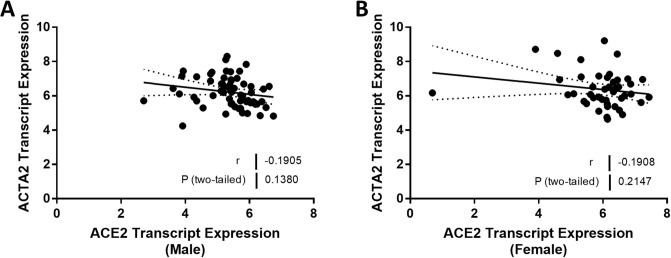
Results: ACE2 mRNA expression was lower in the tubulointerstitium of males compared to females (P = 0.0026). Multiple linear regression analysis showed that ACE2 expression was related to sex and eGFR but not to age or treatment with renin angiotensin system blockade. ACE2 expression is also related to interstitial fibrosis, and tubular atrophy, in males but not in females. Genes involved in inflammation (CCL2 and TNF) correlated with ACE2 expression in males (TNF: r = -0.65, P < 0.0001; CCL2: r = -0.60, P < 0.0001) but not in females. TGFB1, a gene implicated in fibrosis correlated with ACE2 in both sexes.

Conclusions: Sex is an important determinant of ACE2 expression in the tubulointerstitium of the kidney in FSGS. Sex also influences the relationships between ACE2, kidney fibrosis, and expression of genes involved in kidney inflammation.


Conflict of interest statement

The authors have declared that no competing interests exist.

Figures

Fig 1
Fig 1. Tubular angiotensin-converting enzyme 2 (ACE2) mRNA expression in subjects with focal segmental glomerulosclerosis (FSGS).
Tubular ACE2 mRNA expression (median-centered log2 expression by microarray analysis) in male and female subjects with FSGS. Values are the mean ± SD (grey lines). Significance was defined as a P value of less than 0.05.
Fig 2
Fig 2. Correlation of tubular angiotensin-converting enzyme 2 (ACE2) mRNA expression with age in subjects with focal segmental glomerulosclerosis (FSGS).
(A, B) Tubular ACE2 mRNA expression (median-centered log2 expression by microarray analysis) correlated with age in (A) male and (B) female subjects with FSGS. Pearson’s correlation coefficient (r) with two-tailed P values were calculated. Linear regression was used to generate the line of best fit (solid lines) with 95% confidence intervals (dotted lines). Significance was defined as a P value of less than 0.05.
Fig 3
Fig 3. Correlation of tubular angiotensin-converting enzyme 2 (ACE2) mRNA expression with estimated glomerular filtration rate (eGFR) in subjects with focal segmental glomerulosclerosis (FSGS).
(A, B) Tubular ACE2 mRNA expression (median-centered log2 expression by microarray analysis) correlated with eGFR in (A) male and (B) female subjects with FSGS. Pearson’s correlation coefficient (r) with two-tailed P values were calculated. Linear regression was used to generate the line of best fit (solid lines) with 95% confidence intervals (dotted lines). Significance was defined as a P value of less than 0.05.
Fig 4
Fig 4. Correlation of tubular angiotensin-converting enzyme 2 (ACE2) mRNA expression with urine protein to creatine ratio (UPCR) in subjects with focal segmental glomerulosclerosis (FSGS).
(A, B) Tubular ACE2 mRNA expression (median-centered log2 expression by microarray analysis) correlated with centrally measured timed UPCR in (A) male and (B) female subjects with FSGS. Pearson’s correlation coefficient (r) with two-tailed P values were calculated. Linear regression was used to generate the line of best fit (solid lines) with 95% confidence intervals (dotted lines). Significance was defined as a P value of less than 0.05.
Fig 5
Fig 5. Correlation of tubular angiotensin-converting enzyme 2 (ACE2) mRNA expression with systolic and diastolic blood pressure in subjects with focal segmental glomerulosclerosis (FSGS).
(A, B) Tubular ACE2 mRNA expression (median-centered log2 expression by microarray analysis) correlated with sitting systolic blood pressure in (A) male and (B) female subjects with FSGS. (C, D) Tubular ACE2 mRNA expression (median-centered log2 expression by microarray analysis) correlated with sitting diastolic blood pressure in (C) male and (D) female subjects with FSGS. Pearson’s correlation coefficient (r) with two-tailed P values were calculated. Linear regression was used to generate the line of best fit (solid lines) with 95% confidence intervals (dotted lines). Significance was defined as a P value of less than 0.05.
Fig 6
Fig 6. Comparison of tubular angiotensin-converting enzyme 2 (ACE2) mRNA expression in subjects with focal segmental glomerulosclerosis (FSGS) on or off RAAS blocker drugs.
(A, B) Tubular ACE2 mRNA expression (median-centered log2 expression by microarray analysis) in (A) male and (B) female subjects with FSGS who were either on or not taking RAAS blockade drugs prior to the baseline visit. Values are the mean ± SD (grey lines). Significance was defined as a P value of less than 0.05.
Fig 7
Fig 7. Correlation of tubular angiotensin-converting enzyme 2 (ACE2) mRNA expression with structural measurements in subjects with focal segmental glomerulosclerosis (FSGS).
(A, B) Tubular ACE2 mRNA expression (median-centered log2 expression by microarray analysis) correlated with interstitial fibrosis percentage (IF %) in (A) male and (B) female subjects with FSGS. (C, D) Tubular ACE2 mRNA expression (median-centered log2 expression by microarray analysis) correlated with tubular atrophy percentage (TA %) in (C) male and (D) female subjects with FSGS. Pearson’s correlation coefficient (r) with two-tailed P values were calculated. Linear regression was used to generate the line of best fit (solid lines) with 95% confidence intervals (dotted lines). Significance was defined as a P value of less than 0.05.
Fig 8
Fig 8. Correlation of tubular angiotensin-converting enzyme 2 (ACE2) mRNA expression with mRNA expression of inflammation genes in subjects with focal segmental glomerulosclerosis (FSGS).
(A, B) Tubular ACE2 mRNA expression (median-centered log2 expression by microarray analysis) correlated with tumor necrosis factor (TNF) expression in (A) male and (B) female subjects with FSGS. (C, D) Tubular ACE2 mRNA expression (median-centered log2 expression by microarray analysis) correlated with monocyte chemoattractant protein 1 (MCP-1 or CCL2) expression in (C) male and (D) female subjects with FSGS. Pearson’s correlation coefficient (r) with two-tailed P values were calculated. Linear regression was used to generate the line of best fit (solid lines) with 95% confidence intervals (dotted lines). Significance was defined as a P value of less than 0.05.
Fig 9
Fig 9. Correlation of tubular angiotensin-converting enzyme 2 (ACE2) mRNA expression with transforming growth factor beta (TGFB) mRNA expression in subjects with focal segmental glomerulosclerosis (FSGS).
(A, B) Tubular ACE2 mRNA expression (median-centered log2 expression by microarray analysis) correlated with TGFB1 in (A) male and (B) female subjects with FSGS. Pearson’s correlation coefficient (r) with two-tailed P values were calculated. Linear regression was used to generate the line of best fit (solid lines) with 95% confidence intervals (dotted lines). Significance was defined as a P value of less than 0.05.
Fig 10
Fig 10. Correlation of tubular angiotensin-converting enzyme 2 (ACE2) mRNA expression with collagen, type I, alpha 1 (COL1A1) mRNA expression in subjects with focal segmental glomerulosclerosis (FSGS).
(A, B) Tubular ACE2 mRNA expression (median-centered log2 expression by microarray analysis) correlated with COL1A1 in (A) male and (B) female subjects with FSGS. Pearson’s correlation coefficient (r) with two-tailed P values were calculated. Linear regression was used to generate the line of best fit (solid lines) with 95% confidence intervals (dotted lines). Significance was defined as a P value of less than 0.05.
Fig 11
Fig 11. Correlation of tubular angiotensin-converting enzyme 2 (ACE2) mRNA expression with alpha smooth muscle actin (ACTA2) expression in subjects with focal segmental glomerulosclerosis (FSGS).
(A, B) Tubular ACE2 mRNA expression (median-centered log2 expression by microarray analysis) correlated with ACTA2 in (A) male and (B) female subjects with FSGS. Pearson’s correlation coefficient (r) with two-tailed P values were calculated. Linear regression was used to generate the line of best fit (solid lines) with 95% confidence intervals (dotted lines). Significance was defined as a P value of less than 0.05.

Similar articles

Cited by

References

    1. Hamming I, Timens W, Bulthuis M, Lely A, Navis G, van Goor H. Tissue distribution of ACE2 protein, the functional receptor for SARS coronavirus. A first step in understanding SARS pathogenesis. J Pathol. 2004;203: 631–637. doi: 10.1002/path.1570 - DOI - PMC - PubMed
    1. Lely A, Hamming I, van Goor H, Navis G. Renal ACE2 expression in human kidney disease. J Pathol. 2004;204: 587–593. doi: 10.1002/path.1670 - DOI - PubMed
    1. Pei G, Zhang Z, Peng J, Liu L, Zhang C, Yu C, et al.. Renal Involvement and Early Prognosis in Patients with COVID-19 Pneumonia. J Am Soc Nephrol. 2020;31: 1157–1165. doi: 10.1681/ASN.2020030276 - DOI - PMC - PubMed
    1. Hirsch JS, Ng JH, Ross DW, Sharma P, Shah HH, Barnett RL, et al.. Acute kidney injury in patients hospitalized with COVID-19. Kidney Int. 2020;98: 209–218. doi: 10.1016/j.kint.2020.05.006 - DOI - PMC - PubMed
    1. Vickers C, Hales P, Kaushik V, Dick L, Gavin J, Tang J, et al.. Hydrolysis of Biological Peptides by Human Angiotensin-converting Enzyme-related Carboxypeptidase. J Biol Chem. 2002;277: 14838–14843. doi: 10.1074/jbc.M200581200 - DOI - PubMed

Publication types

MeSH terms