. 2021 Sep 15;148(18):dev198507.
doi: 10.1242/dev.198507. Epub 2021 Apr 29.

Collective nuclear behavior shapes bilateral nuclear symmetry for subsequent left-right asymmetric morphogenesis in Drosophila

Affiliations

Collective nuclear behavior shapes bilateral nuclear symmetry for subsequent left-right asymmetric morphogenesis in Drosophila

Dongsun Shin et al. Development. .

Abstract

Proper organ development often requires nuclei to move to a specific position within the cell. To determine how nuclear positioning affects left-right (LR) development in the Drosophila anterior midgut (AMG), we developed a surface-modeling method to measure and describe nuclear behavior at stages 13-14, captured in three-dimensional time-lapse movies. We describe the distinctive positioning and a novel collective nuclear behavior by which nuclei align LR symmetrically along the anterior-posterior axis in the visceral muscles that overlie the midgut and are responsible for the LR-asymmetric development of this organ. Wnt4 signaling is crucial for the collective behavior and proper positioning of the nuclei, as are myosin II and the LINC complex, without which the nuclei fail to align LR symmetrically. The LR-symmetric positioning of the nuclei is important for the subsequent LR-asymmetric development of the AMG. We propose that the bilaterally symmetrical positioning of these nuclei may be mechanically coupled with subsequent LR-asymmetric morphogenesis.

Keywords: 3D reconstruction; Actin; Development; Image processing; Nucleus.


Conflict of interest statement

Competing interests The authors declare no competing or financial interests.

Figures

Fig. 1.
Fig. 1.
Collective positioning of nuclei in the midgut visceral muscle of wild-type Drosophila embryos. (A) Diagram of AMG development from stage 13 (T1) to 14 (T4), showing the epithelium (yellow) and overlying visceral muscles (green) of the midgut in ventral (upper panels) and lateral (lower panels) views. The visceral muscles are binuclear cells that are aligned at the lateral sides at stage 13 (red ovals are nuclei); their leading edges extend toward and eventually merge at the midlines (dotted blue lines) at late stage 14. R, right; L, left. (B,B′) Snapshots from 3D time-lapse movies show ventral views of visceral muscle cells (outlined in green in top panel; F-actin) and nuclei (magenta) at 10 min intervals from T1 (0 min) to T4 (30 min). Scale bars: 50 μm. (C) Magnified views of the ventral region, where nuclei (magenta) are densely aligned along the anterior and posterior axes, from snapshots at intervals of 2.41 min beginning at T1. Scale bars: 4 μm. (C′) Each nucleus that was visible in all snapshots is outlined in a different color. (C″) Colored ovals represent the relative positions of the individual nuclei outlined by the same color in C′. (D,D′) Snapshots show right-side visceral muscles. Blue-green lines trace the migration of individual nuclei (magenta) according to their positions at 2.41 min intervals from 0 (T1) to 38.56 min. Colored dots show the position of the center of the nucleus at each time point. Scale bars: 3 μm. (E,F) Magnified views of areas outlined in yellow in B; T1 (E) and T3 (F) show nuclei that adjusted position relative to other nuclei (arrowheads). Scale bars: 50 μm. (G) A magnified view of nuclei (magenta) and F-actin (green) in ventral visceral muscles. Scale bars:10 μm. (G′) A magnified view of the area outlined in yellow in G. Scale bar: 5 μm.
Fig. 2.
Fig. 2.
dlp is required in the visceral muscles of the midgut to activate Wnt signaling, which is essential for AMG LR-asymmetric development. (A,B) AMG LR asymmetry in (A) wild-type and (B) dlp3 homozygous embryos viewed from the ventral side, showing the proventriculus (magenta outline), the AMG (blue outline), their connection (yellow spot) and the midline (white outline). L, left, R, right. (C) Bars show the percentage of wild-type, dlp3 homozygous (dlp3), dlpMH20 homozygous (dlpMH20) and dlp3/dlpMH20 embryos exhibiting an AMG LR phenotype of normal (green), no laterality (red) or inverse (yellow). The number of embryos examined is shown above each bar. (D) Bars show the percentage of embryos from a wild-type or dlp3 homozygous background with an AMG LR phenotype of normal (green), no laterality (red) or inverse (yellow) when UAS-dlp was overexpressed by the ubiquitous Gal4 driver arm-Gal4 (arm>dlp); by hand-Gal4 (hand>dlp), which is specific to circular visceral muscles and cardiac cells; by 65E04 (65E04>dlp), which is specific to circular visceral muscles; by 24B (24B>dlp), which is specific to all muscles; by NP5021 (NP5021>dlp), which is specific to endodermal epithelium; by Elav-Gal4 (Elav>dlp), a pan-neuronal driver; or a negative control (No driver). The number of embryos examined is shown above each bar. *P<0.05 and ***P<0.001 compared with wild-type (no driver) embryos (χ2 test). (E) Bars show the percentage of dlp3 homozygous embryos with an AMG LR phenotype of normal (green), deformed (blue), no laterality (red) or inverse LR (yellow) when UAS-dsh was overexpressed with hand-Gal4 (hand>dsh) or with NP5021 (NP5021>dsh), or a negative control (no driver). The number of embryos examined is shown above each bar.
Fig. 3.
Fig. 3.
Constructing 3D surface models of the AMG. (A,B) Snapshots from 3D time-lapse movies of the AMG from T1-T4, as viewed from the ventral side in (A) wild-type (WT) and (B) dlp3 homozygous embryos. Top panels show nuclei (magenta) and F-actin (green). Lower panels show only nuclei. Scale bars: 50 μm. (C) 3D time-lapse images, as shown in A and B, were used to reconstruct surface models representing the outer surface of the visceral muscles (green) and the position of nuclei (red) using Imaris software. The surface of the visceral muscles is semi-transparent in the model on the right. (D) Assigning the midline in the surface model: surface models of the visceral muscle and nuclei were imported into Maya. A cuboid (blue lines) was computationally configured with its vertical axis set to the length of the anterior-posterior axis of the embryo and its width set to the maximal width of the AMG (shown as width). The midline of the AMG (red line) was determined in 3D space as a line that is parallel to the anterior-posterior grids of the cuboid and connects the merged points of surface-modeled visceral muscles from the left and right sides at T4. Among the nuclei placed in the 3D surface model, those located 40-80 μm from the anterior tip of the midgut (magenta dots in D-F) were selected for further analysis. Nuclei located 0-40 μm from the anterior tip (blue dots in D-F) were not analyzed further. (E) In the 3D surface model, a line was drawn from the center of each nucleus to the midline, meeting the midline at right angles (red) in 3D space; the length of the connecting line was automatically measured to obtain the distance between the nucleus and the midline. (F) In the 3D surface model, a line was automatically drawn in 3D space between each nucleus and its next most-posterior neighbor. The length of the connecting line was calculated to obtain the distance between the nuclei. Distances between nuclei were measured separately for the right and left sides. D-F show dorsal (left) and directional (right) views.
Fig. 4.
Fig. 4.
dlp controls the placement and collective behavior of visceral muscle nuclei. (A,B) The mean distance from visceral muscle nuclei to the midline, presented as a percentage of the maximum AMG width, in wild-type, dlp3 and dlp3 rescued embryos from T1 to T4. The distance to the midline, calculated as in Fig. 3E, was calculated separately for the left (A) and right (B) sides. Mean distances shown are averaged from 10 embryos. Data are mean± s.d. (C,D) The collectivity index, which shows the mean distance between visceral muscle nuclei (calculated as in Fig. 3F, shown as a percentage of the maximal width of the AMG and averaged for 10 embryos) at T1 to T4. The left (C) and right (D) sides of the AMG were analyzed separately. (A-D) Genotypes: wild type (black lines), dlp3 homozygotes (red) and dlp3 homozygotes expressing UAS-dlp (green); all with 65E04-driven expression of UAS-RedStinger and UAS-lifeact-EGFP in the visceral muscles. *P<0.05; **P<0.01; ***P<0.001 (t-test). (E) Data are average migration distance (μm)±s.d. for nuclei in the left and right visceral muscles of wild-type (green) and dlp3 homozygous (red) embryos (n=3 each) over a period of 10 min. *P<0.05 (t-test).
Fig. 5.
Fig. 5.
Msp300 and zip are required for proper nuclear positioning but not for collective nuclear behavior. (A) Bars show the percentage of wild-type, Msp300KASH homozygous, Msp300KASH/+, zip2 homozygous and zip2/+ embryos with LR AMG phenotypes with normal (green), no laterality (red) and inverse LR (yellow) laterality. The number of embryos examined is shown above each bar. (B,C) Snapshots of 3D time-lapse images of the AMG at T1-T4, as viewed from the ventral side, in (B) Msp300ΔKASH and (C) zip2 homozygous embryos. Top panels show nuclei (magenta) and F-actin (green); lower panels show nuclei. Scale bars: 50 μm. (D,E) The mean distance between nuclei and the midline, averaged from 10 embryos and shown as a percentage of the maximal width of the AMG, at T1 to T4. The left (D) and right (E) sides of the AMG were analyzed separately. (F,G) The collectivity index, calculated from the mean distance from nuclei to their nearest posterior neighbor and averaged from 10 embryos, are shown. The left (F) and right (G) sides of the AMG were analyzed separately. (D-G) Genotypes: wild type (black), Msp300ΔKASH homozygous (red) and zip2 homozygous (green) embryos, all with 65E04-driven expression of UAS-RedStinger and UAS-lifeact-EGFP in the visceral muscles. *P<0.05; **P<0.01 (t-test).
Fig. 6.
Fig. 6.
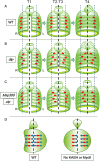
Summary of genetic controls for nuclear positioning in Drosophila visceral muscles. (A-C) Diagrams show the position of visceral muscle nuclei (red ovals) relative to the midline (dotted black line) at T1 (left), T2-T3 (middle) and T4 (right). Dotted blue lines show normal nuclear position. R, right; L, left. (A) In wild-type embryos, the nuclei align in a rib-cage-shaped zone along the anterior-posterior axis in both the right and left sides of the AMG, and can move laterally relative to each other. The nuclei become LR-symmetrically aligned by T4, when the AMG starts its LR-asymmetric development. (B) Nuclei in dlp3 homozygotes are more dispersed and are closer to the midline than those in wild-type embryos. Under these conditions, the LR-asymmetry of the AMG becomes randomized. (C) In Msp-300 or zip mutants, the right-side visceral muscle nuclei are positioned closer to the midline than in wild-type embryos. Thus, the LINC complex and MyoII play a LR-asymmetric role in preserving the distance between the nuclei and the midline. In contrast to dlp mutants, nuclei in Msp-300 and zip mutants retain the ability to behave collectively. In these mutants, the AMG remains LR symmetric at T4 and afterwards. (D) A model demonstrating the role of bilaterally asymmetric nuclear positioning in the LR-asymmetric morphogenesis of the AMG. The LR symmetric pulling force acting on nuclei on the right side may be coupled with LR-asymmetric morphogenesis.

Similar articles

Cited by

References

    1. Azevedo, M. and Baylies, M. K. (2020). Getting into position: nuclear movement in muscle cells. Trends Cell Biol. 30, 303-316. 10.1016/j.tcb.2020.01.002 - DOI - PMC - PubMed
    1. Barolo, S., Castro, B. and Posakony, J. W. (2004). New Drosophila transgenic reporters: insulated P-element vectors expressing fast-maturing RFP. BioTechniques 36, 436-440, 442. 10.2144/04363ST03 - DOI - PubMed
    1. Bejsovec, A. (2018). Wingless signaling: a genetic journey from morphogenesis to metastasis. Genetics 208, 1311-1336. 10.1534/genetics.117.300157 - DOI - PMC - PubMed
    1. Calero-Cuenca, F. J., Janota, C. S. and Gomes, E. R. (2018). Dealing with the nucleus during cell migration. Curr. Opin. Cell Biol. 50, 35-41. 10.1016/j.ceb.2018.01.014 - DOI - PubMed
    1. DasGupta, R., Boutros, M. and Perrimon, N. (2005). Drosophila Wnt/Fz pathways. Science's STKE 2005, cm5. 10.1126/stke.2832005cm5 - DOI - PubMed

Publication types

MeSH terms

LinkOut - more resources