

Detection of Longitudinal Ganglion Cell/Inner Plexiform Layer Change: Comparison of Two Spectral-Domain Optical Coherence Tomography Devices
- PMID: 34097896
- PMCID: PMC8829879
- DOI: 10.1016/j.ajo.2021.05.016
Detection of Longitudinal Ganglion Cell/Inner Plexiform Layer Change: Comparison of Two Spectral-Domain Optical Coherence Tomography Devices
Abstract
Purpose: We compared rates of change of macular ganglion cell/inner plexiform (GCIPL) thickness and proportion of worsening and improving rates from 2 optical coherence tomography (OCT) devices in a cohort of eyes with glaucoma.
Design: Longitudinal cohort study.
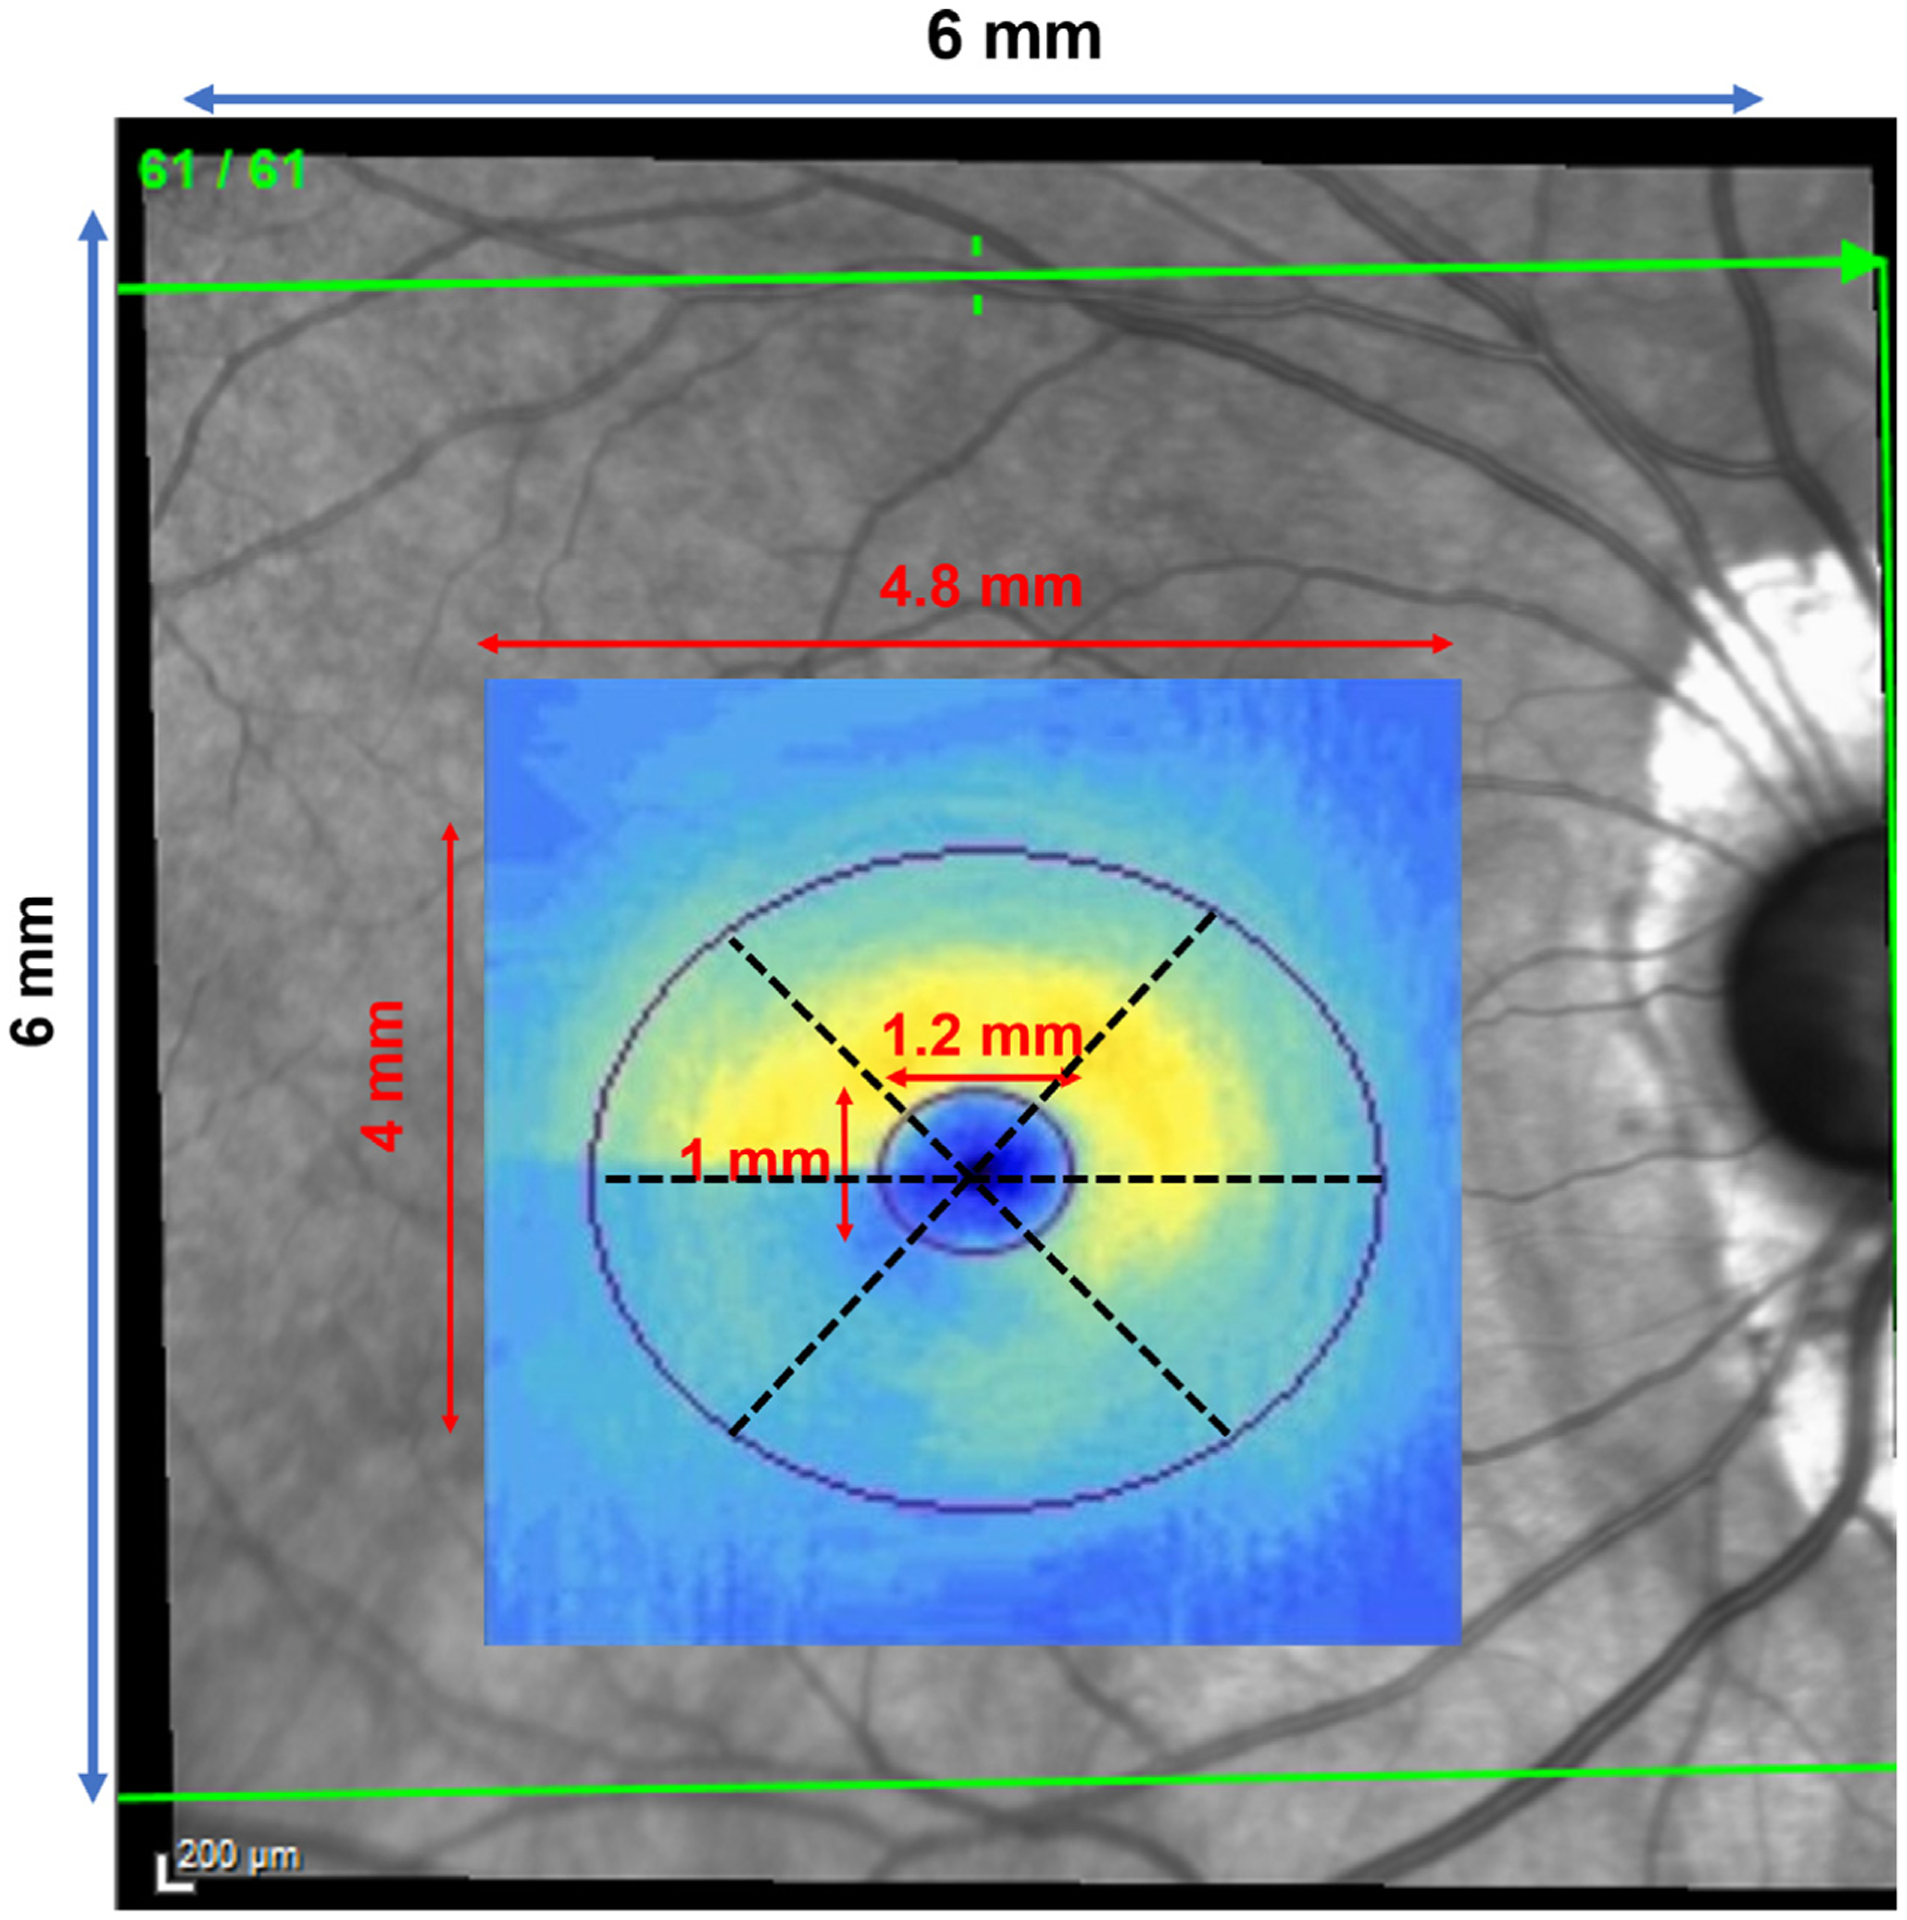
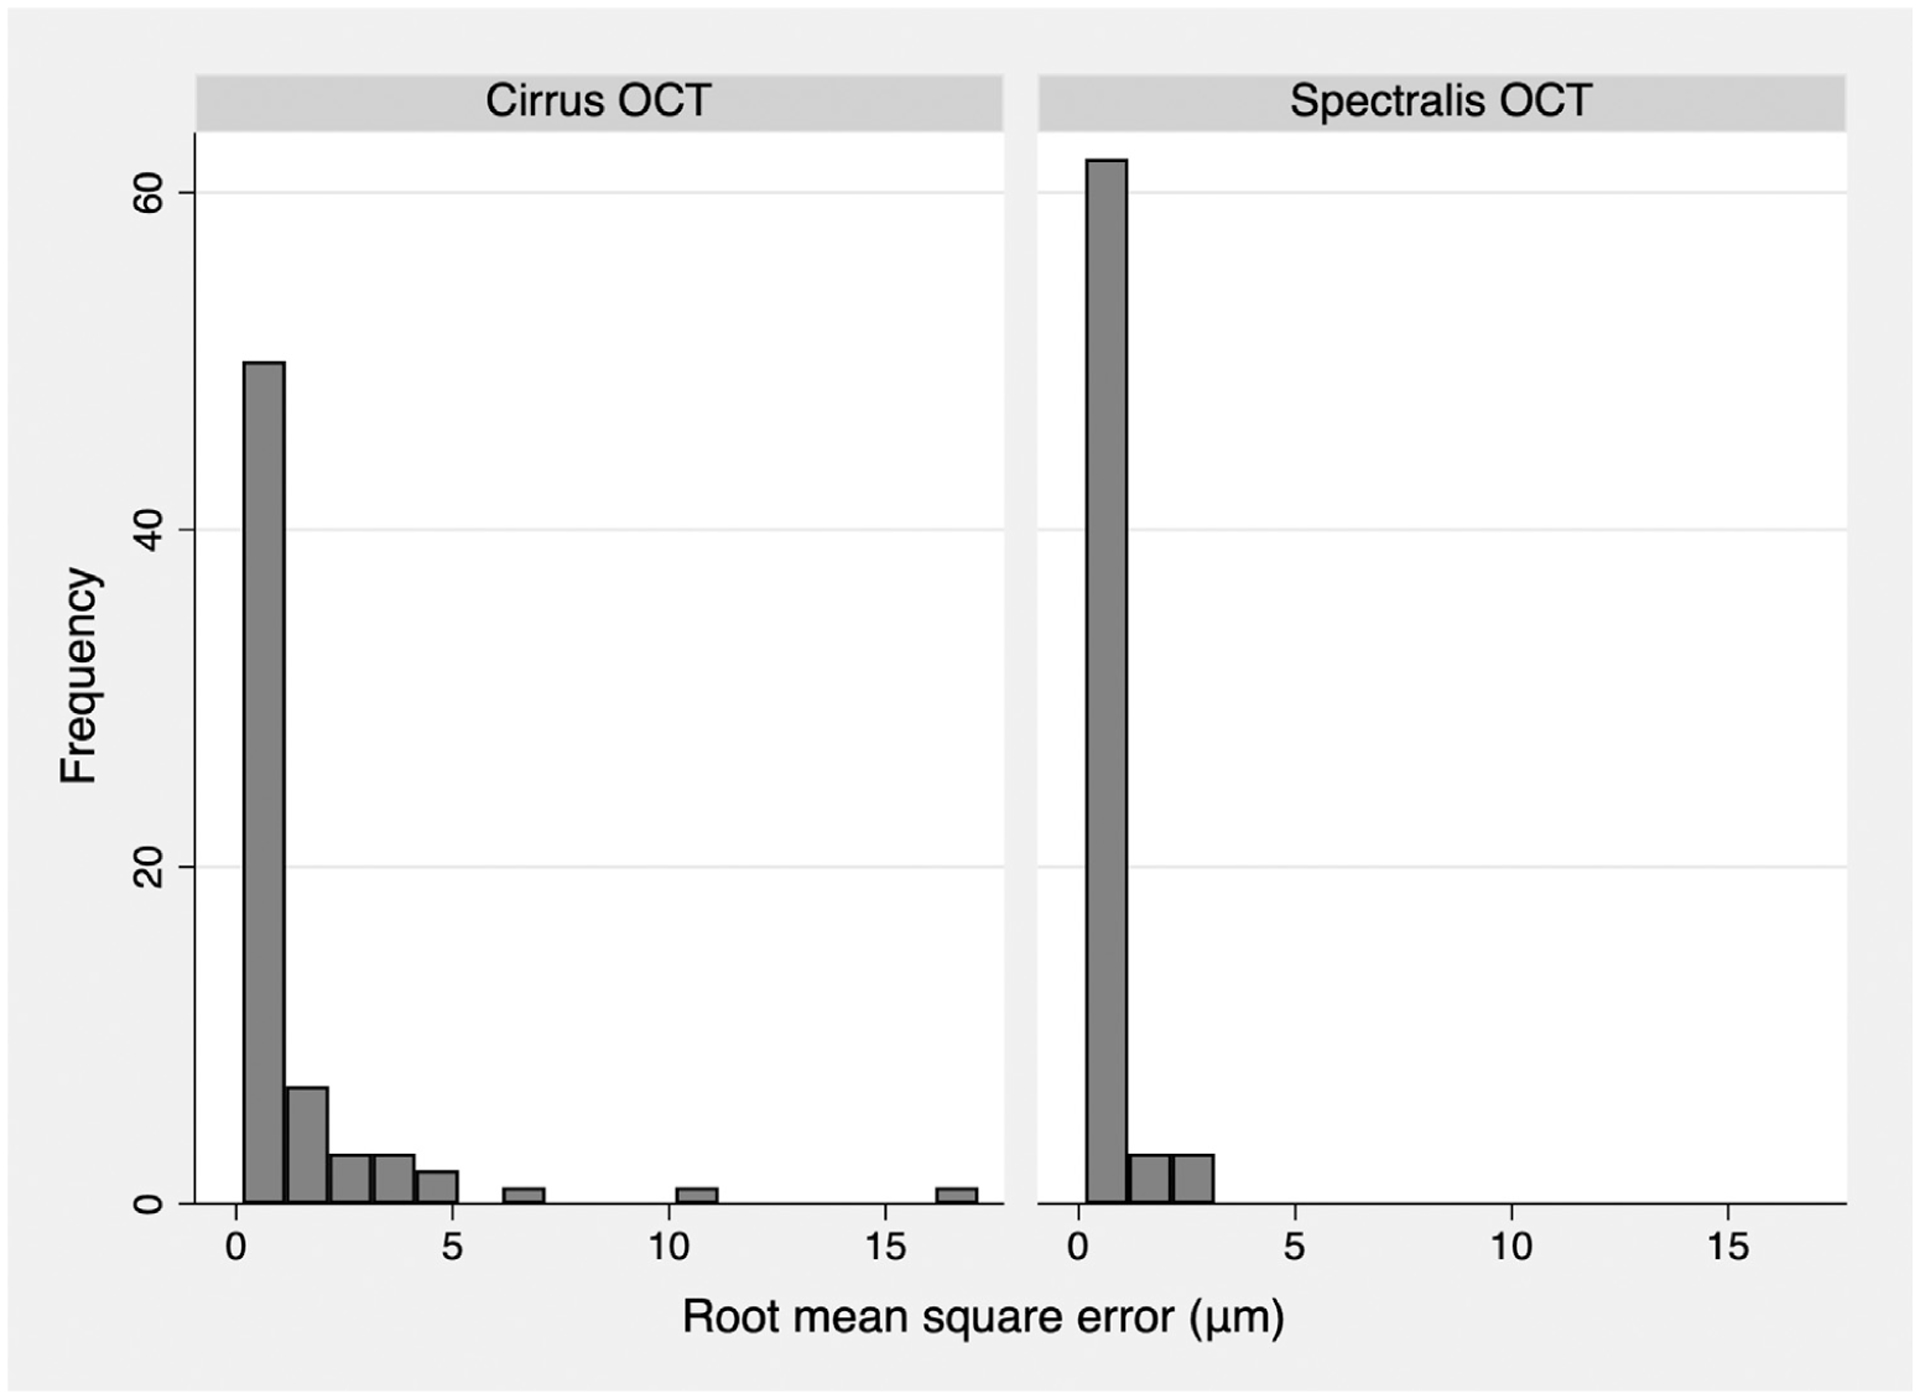
Methods: In a tertiary glaucoma clinic we evaluated 68 glaucoma eyes with ≥2 years of follow-up and ≥4 OCT images. Macular volume scans from 2 OCT devices were exported, coregistered, and segmented. Global and sectoral GCIPL data from the central 4.8 × 4.0-mm region were extracted. GCIPL rates of change were estimated with linear regression. Permutation analyses were used to control specificity with the 2.5 percentile cutoff point used to define "true" worsening. Main outcome measures included differences in global/sectoral GCIPL rates of change between 2 OCT devices and the proportion of negative vs positive rates of change (P < .05).
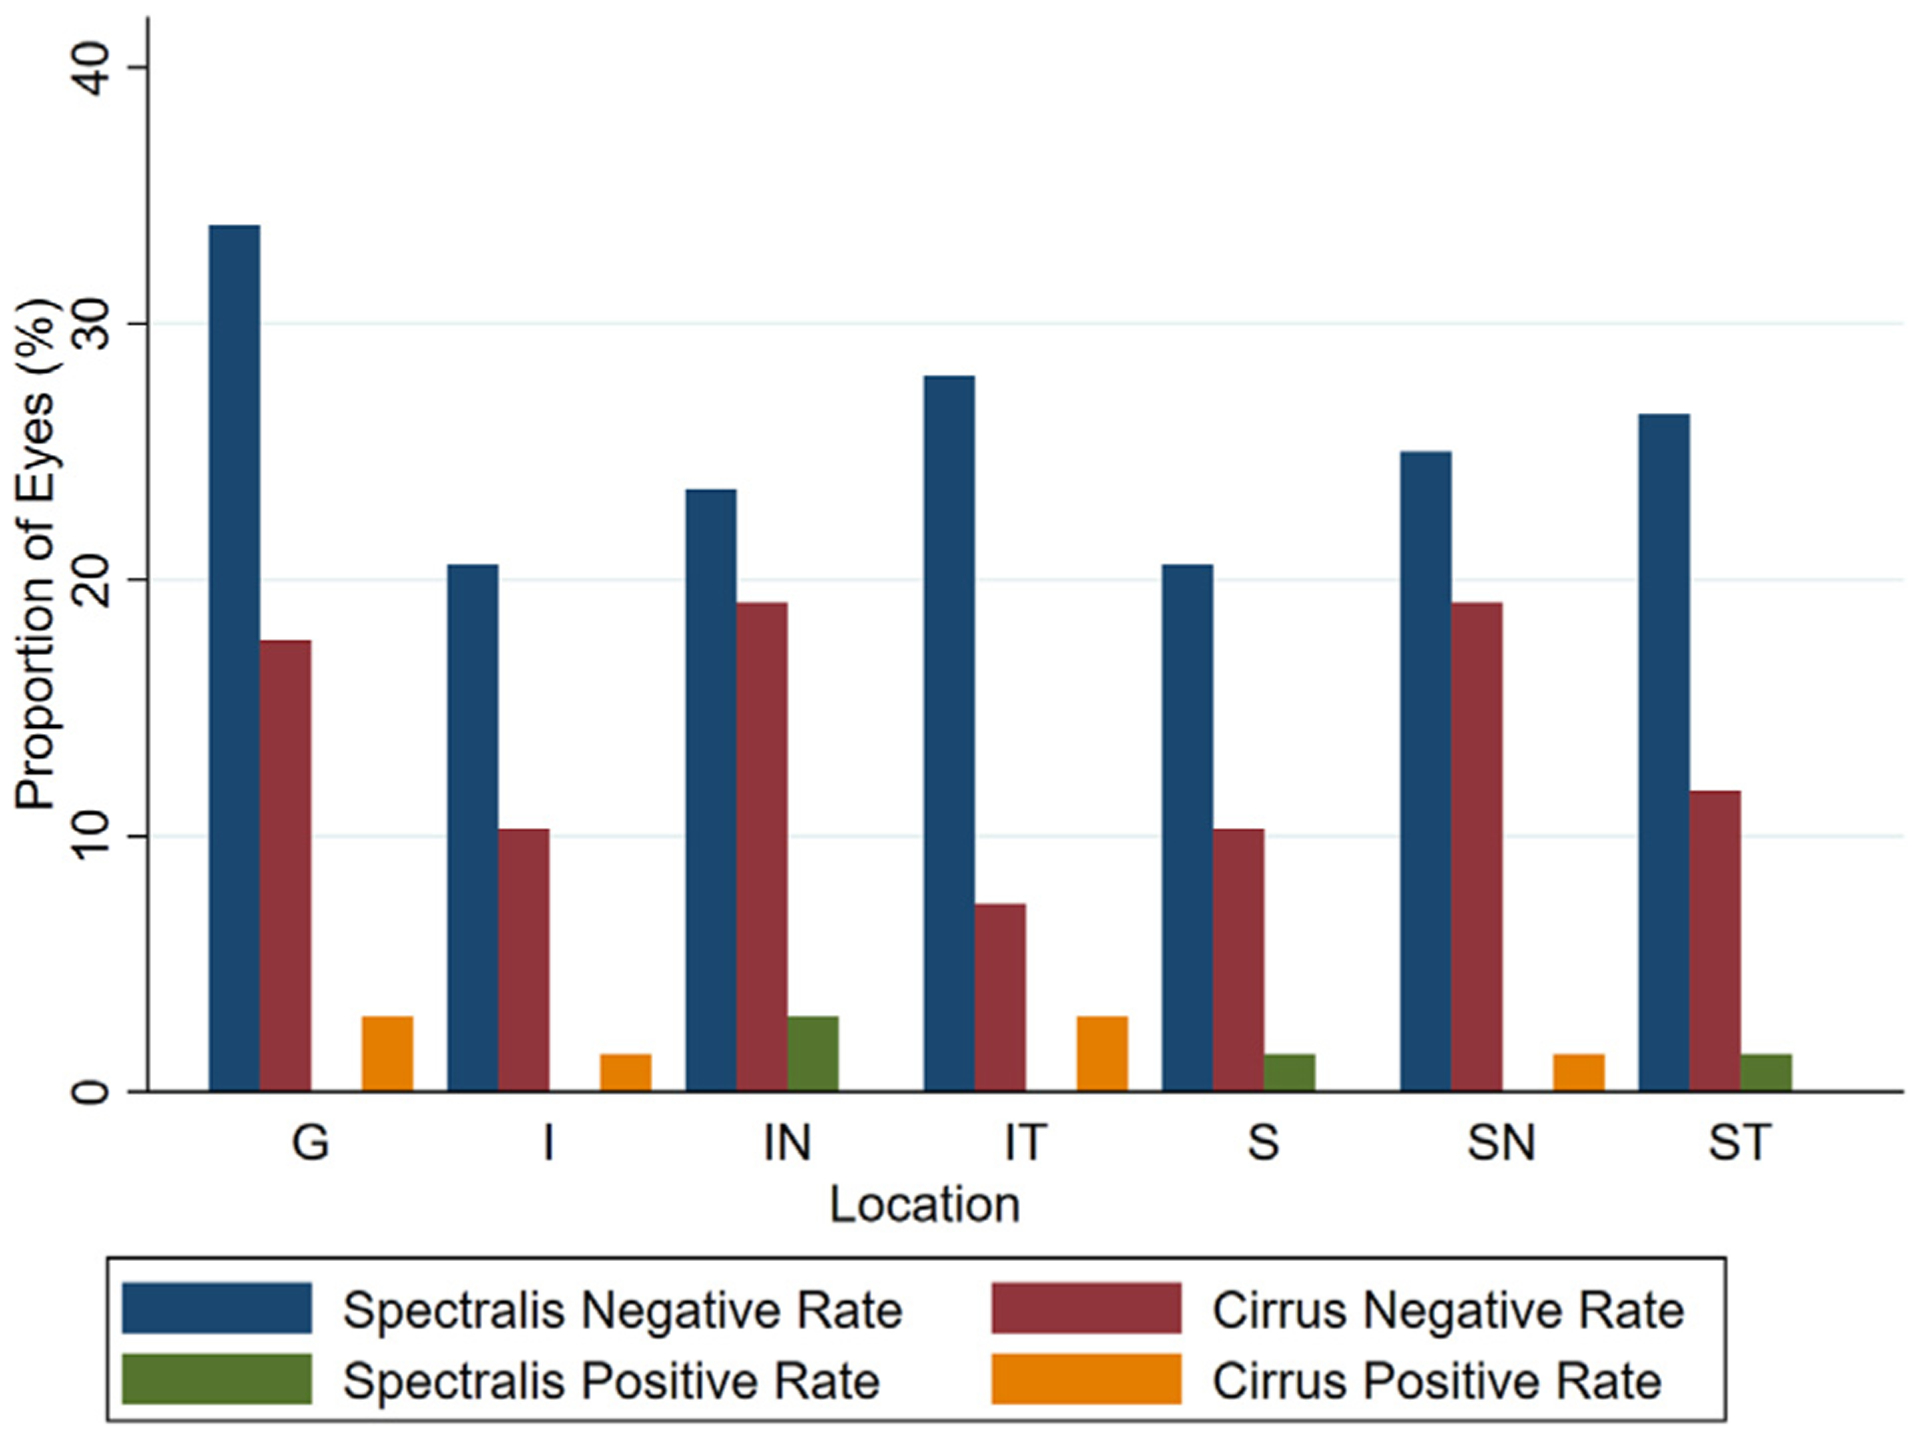
Results: Average (standard deviation) 24-2 visual field mean deviation, median (interquartile range) follow-up time, and number of OCT images were -9.4 (6.1) dB, 3.8 (3.3-4.2) years, and 6 (5-8), respectively. GCIPL rates of thinning from Spectralis OCT were faster (more negative) compared with Cirrus OCT; differences were significant in superonasal (P = .03) and superotemporal (P = .04) sectors. A higher proportion of significant negative rates was observed with Spectralis OCT both globally and in inferotemporal/superotemporal sectors (P < .04). Permutation analyses confirmed the higher proportion of global and sectoral negative rates of change with Spectralis OCT (P < .001).
Conclusions: Changes in macular GCIPL were detected more frequently on Spectralis' longitudinal volume scans than those of Cirrus OCT. OCT devices are not interchangeable with regard to detection of macular structural progression.
Copyright © 2021 Elsevier Inc. All rights reserved.
Conflict of interest statement
All authors have completed and submitted the ICMJE form for disclosure of potential conflicts of interest.
Figures


References
-
- Shin JW, Sung KR, Song MK. Ganglion cell–inner plexiform layer and retinal nerve fiber layer changes in glaucoma suspects enable to predict glaucoma development. Am J Ophthalmol. 2019;210:26–34. - PubMed
-
- Van Melkebeke L, Barbosa-Breda J, Huygens M, Stalmans I. Optical coherence tomography angiography in glaucoma: a review. Ophthalmic Res. 2018;60(3):139–151. - PubMed
-
- Mwanza J-C, Durbin MK, Budenz DL, et al. Glaucoma diagnostic accuracy of ganglion cell–inner plexiform layer thickness: comparison with nerve fiber layer and optic nerve head. Ophthalmology. 2012;119(6):1151–1158. - PubMed
Publication types
MeSH terms
Grants and funding
LinkOut - more resources
Full Text Sources
Medical
Miscellaneous
