

Towards a deeper understanding of microbial communities: integrating experimental data with dynamic models
- PMID: 34098512
- PMCID: PMC8286325
- DOI: 10.1016/j.mib.2021.05.003
Towards a deeper understanding of microbial communities: integrating experimental data with dynamic models
Abstract
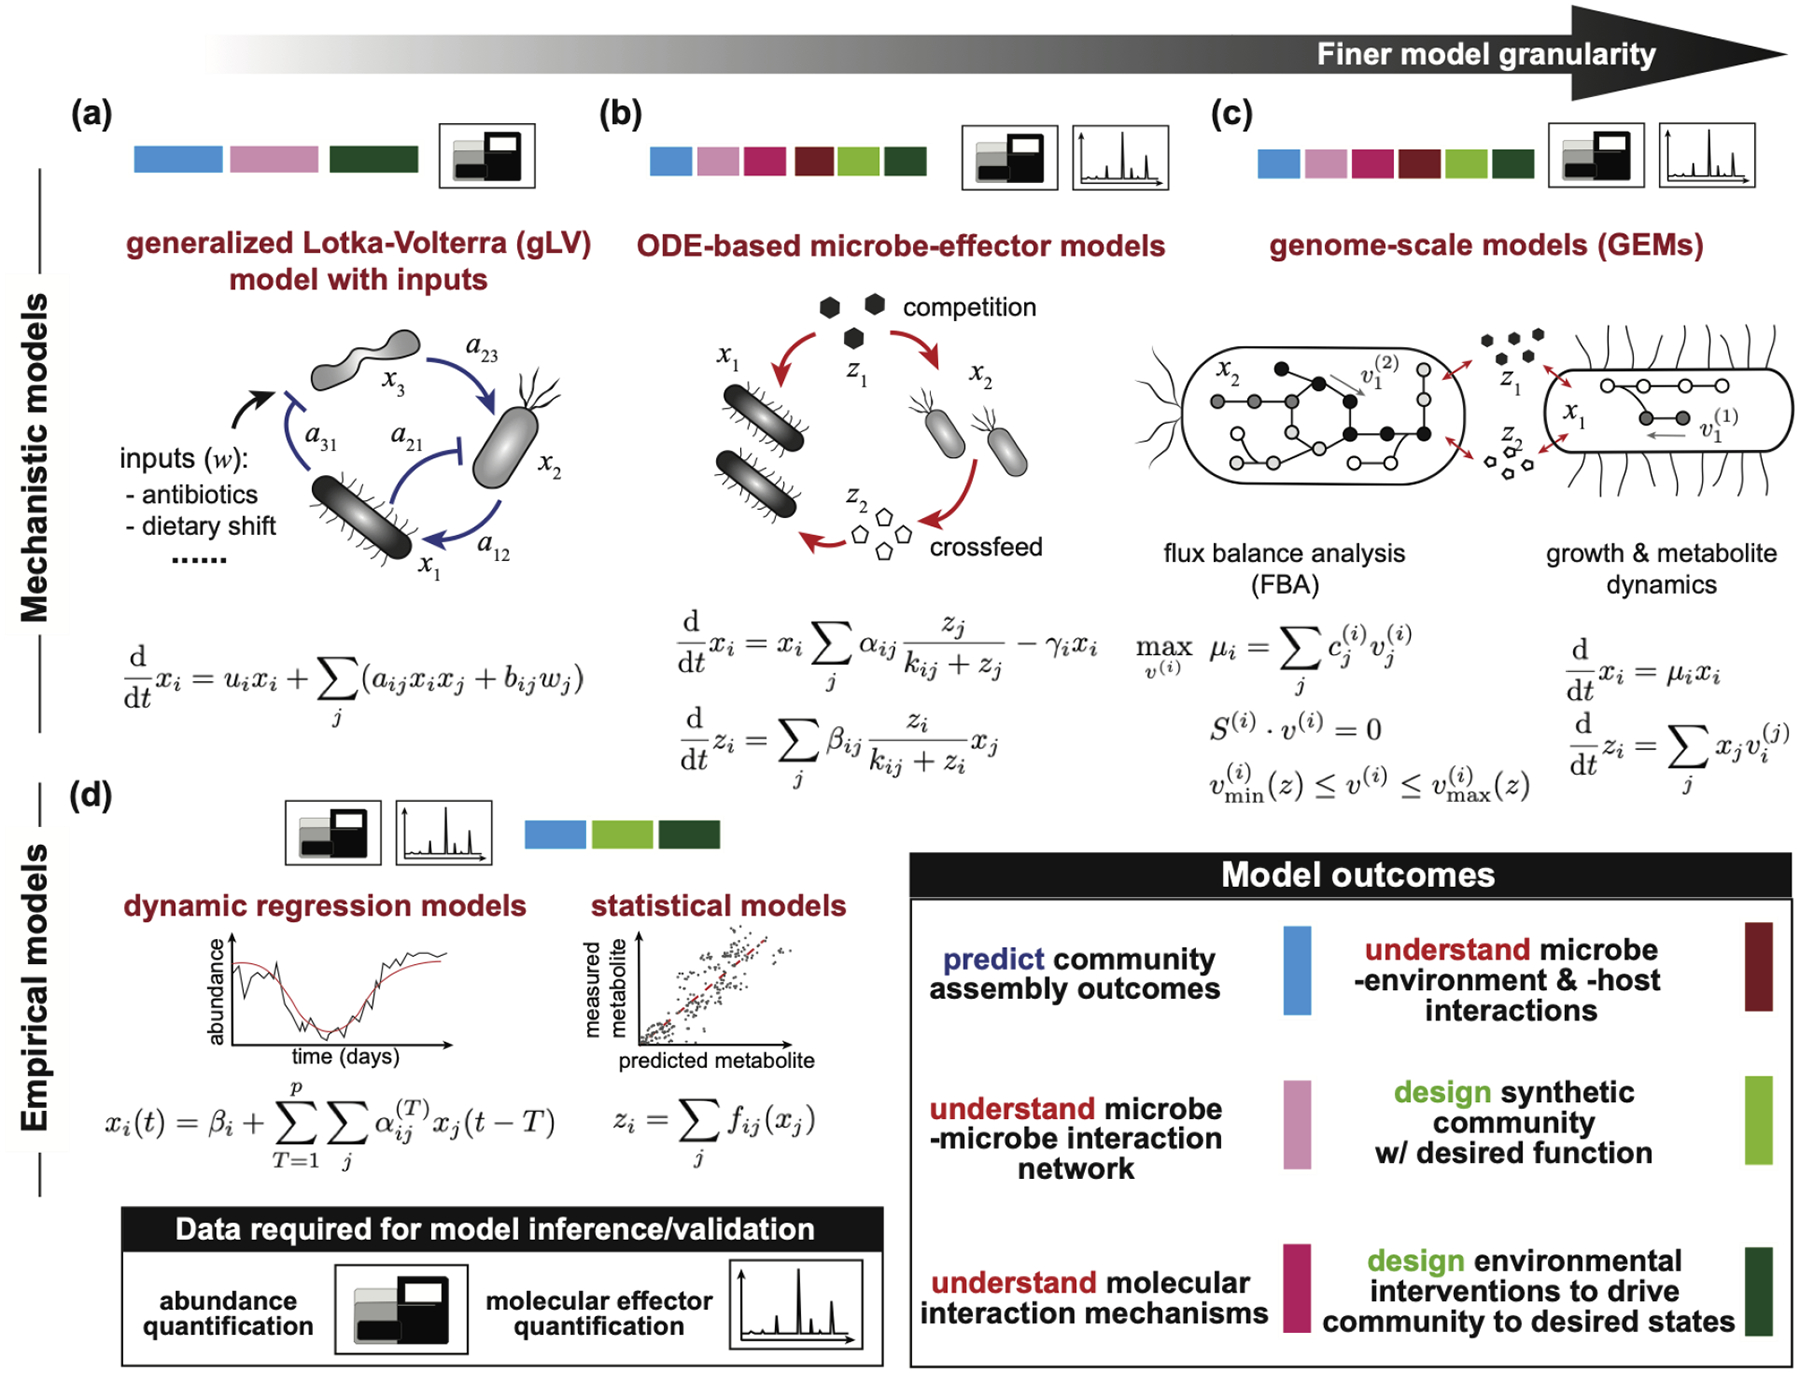
Microbial communities and their functions are shaped by complex networks of interactions among microbes and with their environment. While the critical roles microbial communities play in numerous environments have become increasingly appreciated, we have a very limited understanding of their interactions and how these interactions combine to generate community-level behaviors. This knowledge gap hinders our ability to predict community responses to perturbations and to design interventions that manipulate these communities to our benefit. Dynamic models are promising tools to address these questions. We review existing modeling techniques to construct dynamic models of microbial communities at different scales and suggest ways to leverage multiple types of models and data to facilitate our understanding and engineering of microbial communities.
Copyright © 2021 Elsevier Ltd. All rights reserved.
Conflict of interest statement
Conflict_of_interest
The authors declare that they do not have a conflict of interest.
Figures
Similar articles
-
Agent-Based Modeling of Microbial Communities.ACS Synth Biol. 2022 Nov 18;11(11):3564-3574. doi: 10.1021/acssynbio.2c00411. Epub 2022 Oct 31. ACS Synth Biol. 2022. PMID: 36315012 Free PMC article. Review.
-
Modeling Microbial Community Networks: Methods and Tools for Studying Microbial Interactions.Microb Ecol. 2024 Apr 8;87(1):56. doi: 10.1007/s00248-024-02370-7. Microb Ecol. 2024. PMID: 38587642 Free PMC article. Review.
-
Effects of Spatial Variability and Relic DNA Removal on the Detection of Temporal Dynamics in Soil Microbial Communities.mBio. 2020 Jan 21;11(1):e02776-19. doi: 10.1128/mBio.02776-19. mBio. 2020. PMID: 31964728 Free PMC article.
-
A guide to deciphering microbial interactions and metabolic fluxes in microbiome communities.Curr Opin Biotechnol. 2020 Aug;64:230-237. doi: 10.1016/j.copbio.2020.07.001. Epub 2020 Jul 22. Curr Opin Biotechnol. 2020. PMID: 32711357 Review.
-
Review and perspective on mathematical modeling of microbial ecosystems.Biochem Soc Trans. 2018 Apr 17;46(2):403-412. doi: 10.1042/BST20170265. Epub 2018 Mar 14. Biochem Soc Trans. 2018. PMID: 29540507 Free PMC article. Review.
Cited by
-
Single-cell analysis of multiple invertible promoters reveals differential inversion rates as a strong determinant of bacterial population heterogeneity.Sci Adv. 2023 Aug 4;9(31):eadg5476. doi: 10.1126/sciadv.adg5476. Epub 2023 Aug 4. Sci Adv. 2023. PMID: 37540747 Free PMC article.
-
Shaping human gut community assembly and butyrate production by controlling the arginine dihydrolase pathway.bioRxiv [Preprint]. 2024 Apr 14:2023.01.10.523442. doi: 10.1101/2023.01.10.523442. bioRxiv. 2024. Update in: Cell Syst. 2025 May 21;16(5):101292. doi: 10.1016/j.cels.2025.101292. PMID: 37986770 Free PMC article. Updated. Preprint.
-
A data-driven modeling framework for mapping genotypes to synthetic microbial community functions.bioRxiv [Preprint]. 2025 Jan 4:2025.01.04.631316. doi: 10.1101/2025.01.04.631316. bioRxiv. 2025. PMID: 39803481 Free PMC article. Preprint.
-
Autoencoder neural networks enable low dimensional structure analyses of microbial growth dynamics.Nat Commun. 2023 Dec 1;14(1):7937. doi: 10.1038/s41467-023-43455-0. Nat Commun. 2023. PMID: 38049401 Free PMC article.
-
Elucidating human gut microbiota interactions that robustly inhibit diverse Clostridioides difficile strains across different nutrient landscapes.Nat Commun. 2024 Aug 28;15(1):7416. doi: 10.1038/s41467-024-51062-w. Nat Commun. 2024. PMID: 39198411 Free PMC article.
References
-
- Zheng P et al., “Gut microbiome remodeling induces depressive-like behaviors through a pathway mediated by the host’s metabolism,” Mol. Psychiatry, vol. 21, no. 6, pp. 786–796, Jun. 2016. - PubMed
-
- Laserna-Mendieta EJ et al., “Determinants of Reduced Genetic Capacity for Butyrate Synthesis by the Gut Microbiome in Crohn’s Disease and Ulcerative Colitis,” J. Crohn’s Colitis, vol. 12, no. 2, pp. 204–216, Jan. 2018. - PubMed
Publication types
MeSH terms
Grants and funding
LinkOut - more resources
Full Text Sources
Miscellaneous
