Case Reports
. 2021 Jun 7;22(1):521.
doi: 10.1186/s12891-021-04364-9.

Plantar load transfer in children: a descriptive study with two pathological case studies

Affiliations
Case Reports

Plantar load transfer in children: a descriptive study with two pathological case studies

Alexis Brierty et al. BMC Musculoskelet Disord. .

Abstract

Background: Typical gait is often considered to be highly symmetrical, with gait asymmetries typically associated with pathological gait. Whilst gait symmetry is often expressed in symmetry ratios, measures of symmetry do not provide insight into how these asymmetries affect gait variables. To fully understand changes caused by gait asymmetry, we must first develop a normative database for comparison. Therefore, the aim of this study was to describe normative reference values of regional plantar load and present comparisons with two pathological case studies.

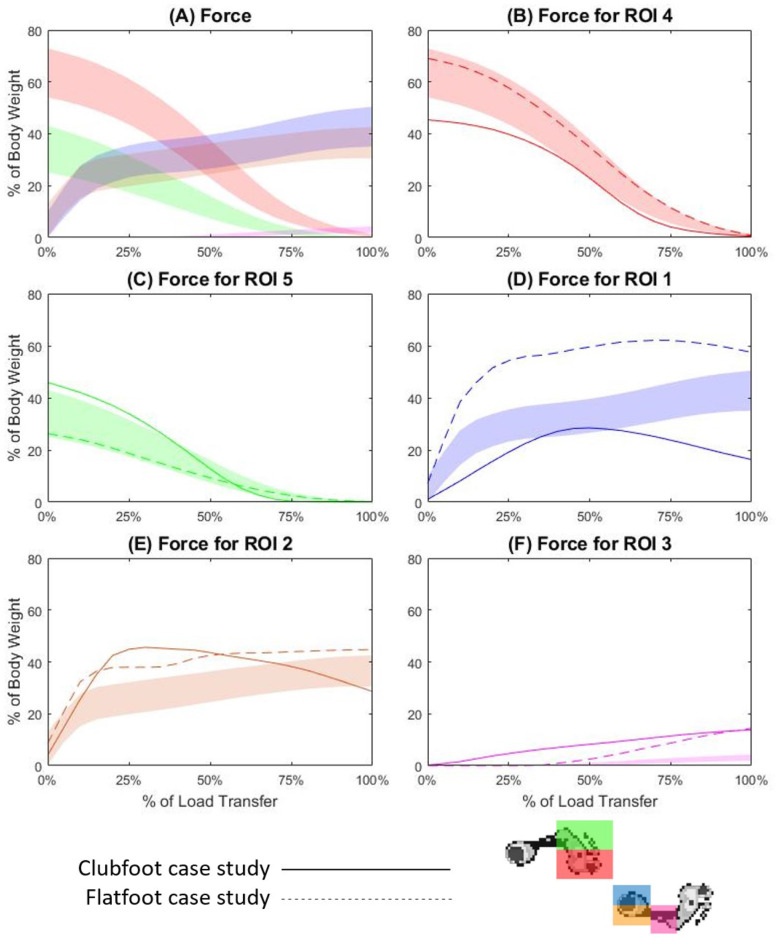
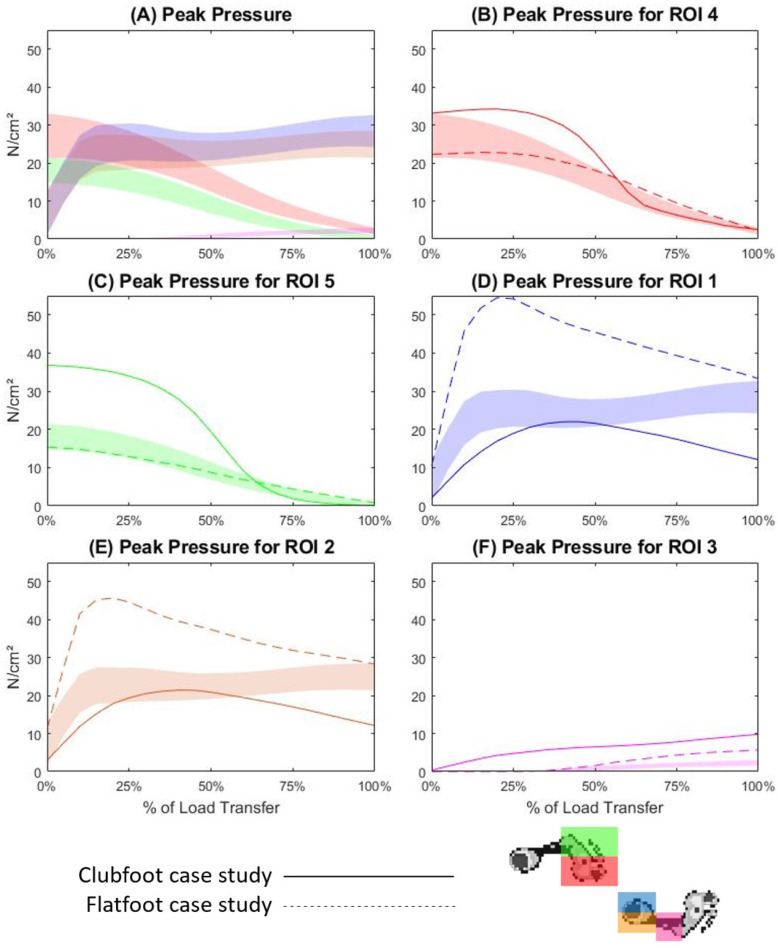
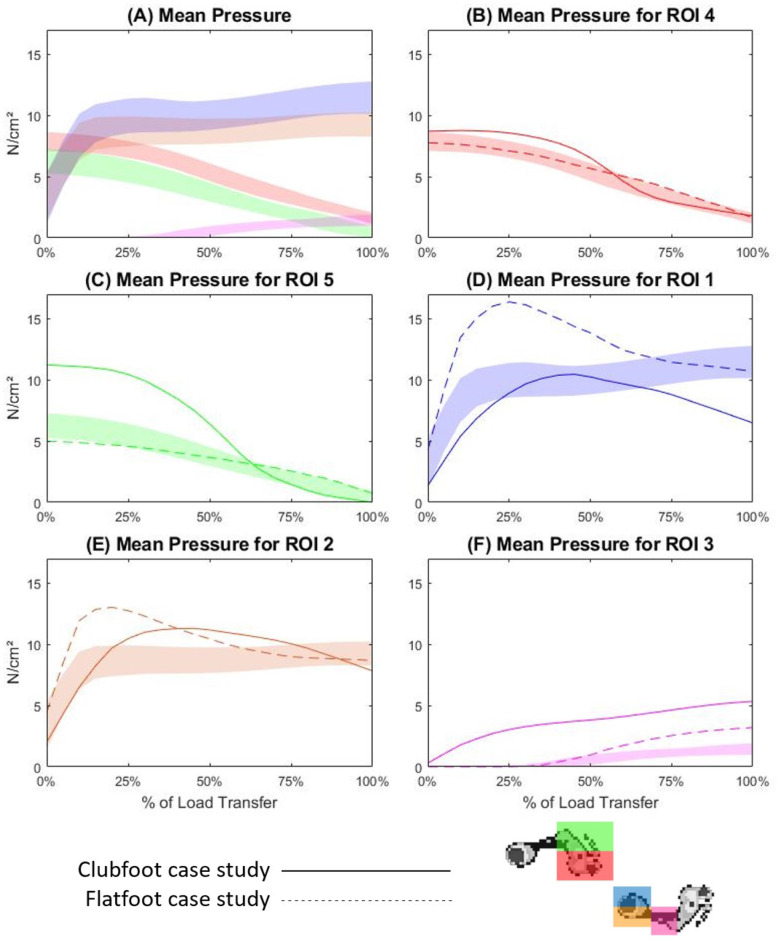
Methods: A descriptive study of the load transfer of plantar pressures in typically developed children was conducted to develop a baseline for comparison of the effects of gait asymmetry in paediatric clinical populations. Plantar load and 3D kinematic data was collected for 17 typically developed participants with a mean age of 9.4 ± 4.0 years. Two case studies were also included; a 10-year-old male with clubfoot and an 8-year-old female with a flatfoot deformity. Data was analysed using a kinematics-pressure integration technique for anatomical masking into 5 regions of interest; medial and lateral forefoot, midfoot, and medial and lateral hindfoot.

Results: Clear differences between the two case studies and the typical dataset were seen for the load transfer phase of gait. For case study one, lateral bias was seen in the forefoot of the trailing foot across all variables, as well as increases in contact area, force and mean pressure in the lateral hindfoot of the leading foot. For case study two, the forefoot of the trailing foot produced results very similar to the typical dataset across all variables. In the hindfoot of the leading foot, medial bias presents most notably in the force and mean pressure graphs.

Conclusions: This study highlights the clinical significance of the load transfer phase of gait, providing meaningful information for intervention planning.

Keywords: Children; Load transfer; Plantar load; Plantar pressure; Typically developed.


Conflict of interest statement

The authors declare that they have no competing interests.

Figures

Fig. 1
Fig. 1
Normalised force means (solid line) and standard deviations (coloured bands) for all regions across the gait cycle of the leading foot for a representative TD participant (1A), case study one (1B) and case study two (1C)
Fig. 2
Fig. 2
Contact area across the load transfer phase of gait for all regions (2A), ROI4 (2B), ROI5 (2C), ROI1 (2D), ROI2 (2E) and ROI3 (2F). The coloured band is representative of one standard deviation either side of the mean for the TD cohort, the solid line is the mean trace for case study one, and the dotted line is the mean trace for case study two
Fig. 3
Fig. 3
Normalised force across the load transfer phase of gait for all regions (3A), ROI4 (3B), ROI5 (3C), ROI1 (3D), ROI2 (3E) and ROI3 (3F). The coloured band is representative of one standard deviation either side of the mean for the TD cohort, the solid line is the mean trace for case study one, and the dotted line is the mean trace for case study two
Fig. 4
Fig. 4
Peak pressure across the load transfer phase of gait for all regions (4A), ROI4 (4B), ROI5 (4C), ROI1 (4D), ROI2 (4E) and ROI3 (4F). The coloured band is representative of one standard deviation either side of the mean for the TD cohort, the solid line is the mean trace for case study one, and the dotted line is the mean trace for case study two
Fig. 5
Fig. 5
Mean pressure across the load transfer phase of gait for all regions (5A), ROI4 (5B), ROI5 (5C), ROI1 (5D), ROI2 (5E) and ROI3 (5F). The coloured band is representative of one standard deviation either side of the mean for the TD cohort, the solid line is the mean trace for case study one, and the dotted line is the mean trace for case study two

References

    1. Stebbins J, Harrington M, Giacomozzi C, Thompson N, Zavatsky A, Theologis T. Assessment of sub-division of plantar pressure measurement in children. Gait & Posture. 2005;22(4):372–376. doi: 10.1016/j.gaitpost.2004.10.004. - DOI - PubMed
    1. Veves A, Murray H, Young M, Boulton A. The risk of foot ulceration in diabetic patients with high foot pressure: a prospective study. Diabetologia. 1992;35(7):660–663. doi: 10.1007/BF00400259. - DOI - PubMed
    1. Patry J, Belley R, Côté M, Chateau-Degat M-L. Plantar pressures, plantar forces, and their influence on the pathogenesis of diabetic foot ulcers: a review. J Am Podiatr Med Assoc. 2013;103(4):322–332. doi: 10.7547/1030322. - DOI - PubMed
    1. Nsenga Leunkeu A, Lelard T, Shephard RJ, Doutrellot P-L, Ahmaidi S. Gait cycle and plantar pressure distribution in children with cerebral palsy: clinically useful outcome measures for a management and rehabilitation. NeuroRehabilitation. 2014;35(4):657–663. doi: 10.3233/NRE-141163. - DOI - PubMed
    1. Park KB, Park HW, Lee KS, Joo SY, Kim HW. Changes in dynamic foot pressure after surgical treatment of valgus deformity of the hindfoot in cerebral palsy. JBJS. 2008;90(8):1712–1721. doi: 10.2106/JBJS.G.00792. - DOI - PubMed

Publication types