

Characterization of terminal-ileal and colonic Crohn's disease in treatment-naïve paediatric patients based on transcriptomic profile using logistic regression
- PMID: 34098982
- PMCID: PMC8185924
- DOI: 10.1186/s12967-021-02909-z
Characterization of terminal-ileal and colonic Crohn's disease in treatment-naïve paediatric patients based on transcriptomic profile using logistic regression
Erratum in
-
Correction to: Characterization of terminal-ileal and colonic Crohn's disease in treatment-naïve paediatric patients based on transcriptomic profile using logistic regression.J Transl Med. 2021 Aug 3;19(1):329. doi: 10.1186/s12967-021-02945-9. J Transl Med. 2021. PMID: 34344413 Free PMC article. No abstract available.
Abstract
Background: Inflammatory bowel disease (IBD) is a chronic and idiopathic inflammatory disorder of the gastrointestinal tract and comprises ulcerative colitis (UC) and Crohn's disease (CD). Crohn's disease can affect any part of the gastrointestinal tract, but mainly the terminal ileum and colon. In the present study, we aimed to characterize terminal-ileal CD (ICD) and colonic CD (CCD) at the molecular level, which might enable a more optimized approach for the clinical care and scientific research of CD.
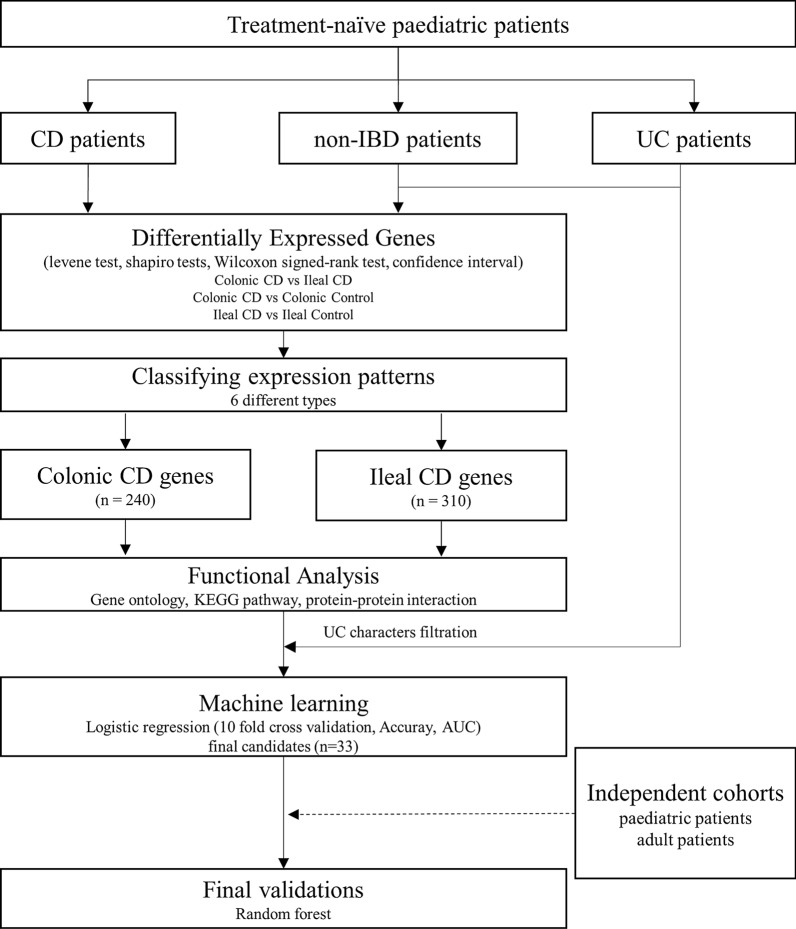
Methods: We analyzed differentially expressed genes in samples from 23 treatment-naïve paediatric patients with CD and 25 non-IBD controls, and compared the data with previously published RNA-Seq data using multi-statistical tests and confidence intervals. We implemented functional profiling and proposed statistical methods for feature selection using a logistic regression model to identify genes that are highly associated in ICD or CCD. We also validated our final candidate genes in independent paediatric and adult cohorts.
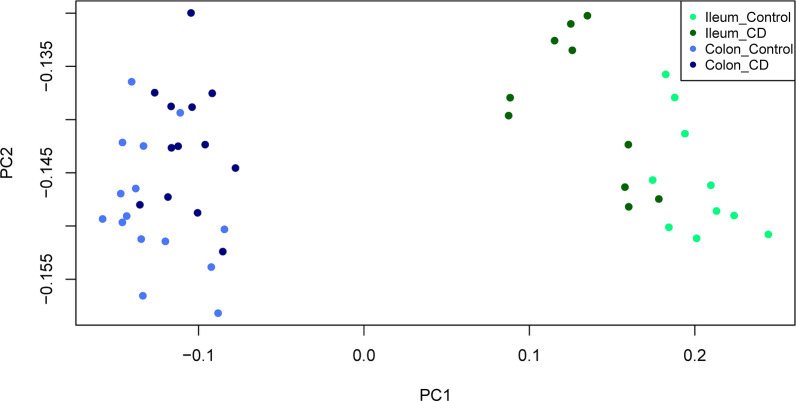
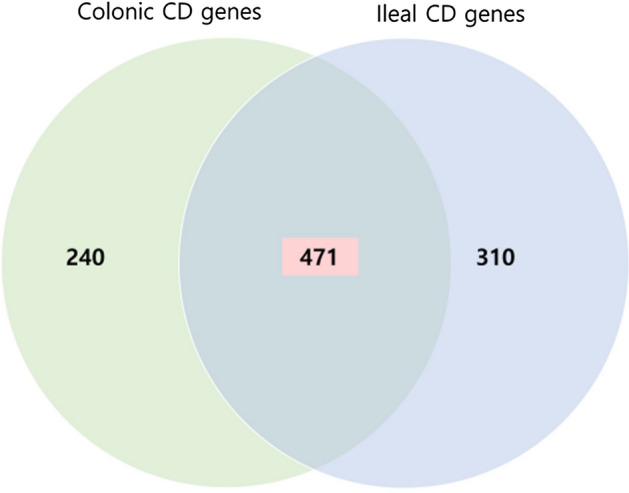
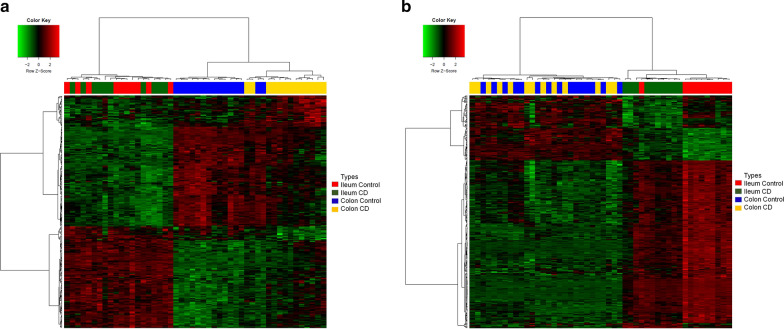
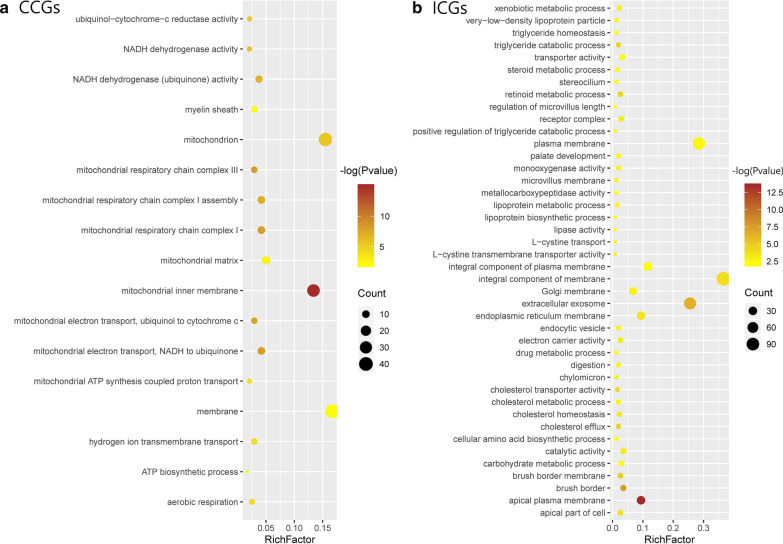
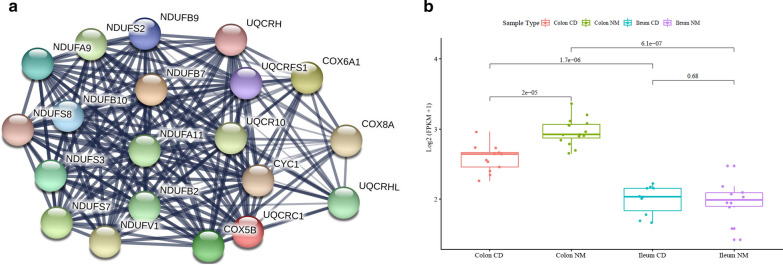
Results: We identified 550 genes specifically expressed in patients with CD compared with those in healthy controls (p < 0.05). Among these DEGs, 240 from patients with CCD were mainly involved in mitochondrial dysfunction, whereas 310 from patients with ICD were enriched in the ileum functions such as digestion, absorption, and metabolism. To choose the most effective gene set, we selected the most powerful genes (p-value ≤ 0.05, accuracy ≥ 0.8, and AUC ≥ 0.8) using logistic regression. Consequently, 33 genes were identified as useful for discriminating CD location; the accuracy and AUC were 0.86 and 0.83, respectively. We then validated the 33 genes with data from another independent paediatric cohort (accuracy = 0.93, AUC = 0.92) and adult cohort (accuracy = 0.88, AUC = 0.72).
Conclusions: In summary, we identified DEGs that are specifically expressed in CCD and ICD compared with those in healthy controls and patients with UC. Based on the feature selection analysis, 33 genes were identified as useful for discriminating CCD and ICD with high accuracy and AUC, for not only paediatric patients but also independent cohorts. We propose that our approach and the final gene set are useful for the molecular classification of patients with CD, and it could be beneficial in treatments based on disease location.
Keywords: Colonic CD; Crohn’s disease; Logistic regression; Paediatric patients; Terminal-ileal CD; Transcriptomic profile.
Conflict of interest statement
The authors declare that they have no known competing financial interests or personal relationships that could have appeared to influence the work reported in this paper.
Figures
Similar articles
-
Meta-Analysis of IBD Gut Samples Gene Expression Identifies Specific Markers of Ileal and Colonic Diseases.Inflamm Bowel Dis. 2022 May 4;28(5):775-782. doi: 10.1093/ibd/izab311. Inflamm Bowel Dis. 2022. PMID: 34928348
-
Location-specific signatures of Crohn's disease at a multi-omics scale.Microbiome. 2022 Aug 24;10(1):133. doi: 10.1186/s40168-022-01331-x. Microbiome. 2022. PMID: 35999575 Free PMC article.
-
An ileal Crohn's disease gene signature based on whole human genome expression profiles of disease unaffected ileal mucosal biopsies.PLoS One. 2012;7(5):e37139. doi: 10.1371/journal.pone.0037139. Epub 2012 May 14. PLoS One. 2012. PMID: 22606341 Free PMC article.
-
A comprehensive review and update on Crohn's disease.Dis Mon. 2018 Feb;64(2):20-57. doi: 10.1016/j.disamonth.2017.07.001. Epub 2017 Aug 18. Dis Mon. 2018. PMID: 28826742 Review.
-
Differentiating ulcerative colitis from Crohn disease in children and young adults: report of a working group of the North American Society for Pediatric Gastroenterology, Hepatology, and Nutrition and the Crohn's and Colitis Foundation of America.J Pediatr Gastroenterol Nutr. 2007 May;44(5):653-74. doi: 10.1097/MPG.0b013e31805563f3. J Pediatr Gastroenterol Nutr. 2007. PMID: 17460505
Cited by
-
Diversity of the microbiota communities found in the various regions of the intestinal tract in healthy individuals and inflammatory bowel diseases.Front Immunol. 2023 Nov 2;14:1242242. doi: 10.3389/fimmu.2023.1242242. eCollection 2023. Front Immunol. 2023. PMID: 38022505 Free PMC article. Review.
-
Revealing proteome-level functional redundancy in the human gut microbiome using ultra-deep metaproteomics.Nat Commun. 2023 Jun 10;14(1):3428. doi: 10.1038/s41467-023-39149-2. Nat Commun. 2023. PMID: 37301875 Free PMC article.
-
Correction to: Characterization of terminal-ileal and colonic Crohn's disease in treatment-naïve paediatric patients based on transcriptomic profile using logistic regression.J Transl Med. 2021 Aug 3;19(1):329. doi: 10.1186/s12967-021-02945-9. J Transl Med. 2021. PMID: 34344413 Free PMC article. No abstract available.
References
-
- Balzola F, Cullen G, Ho GT, Russell RK. The role of the environment in the development of paediatric inflammatory bowel disease. Inflamm Bowel Dis Monit. 2013:31–2.
Publication types
MeSH terms
LinkOut - more resources
Full Text Sources
Medical
