. 2021 Jul 14;41(28):6070-6086.
doi: 10.1523/JNEUROSCI.0870-20.2021.

Viewing Ambiguous Social Interactions Increases Functional Connectivity between Frontal and Temporal Nodes of the Social Brain

Affiliations

Viewing Ambiguous Social Interactions Increases Functional Connectivity between Frontal and Temporal Nodes of the Social Brain

Matthew Ainsworth et al. J Neurosci. .

Abstract

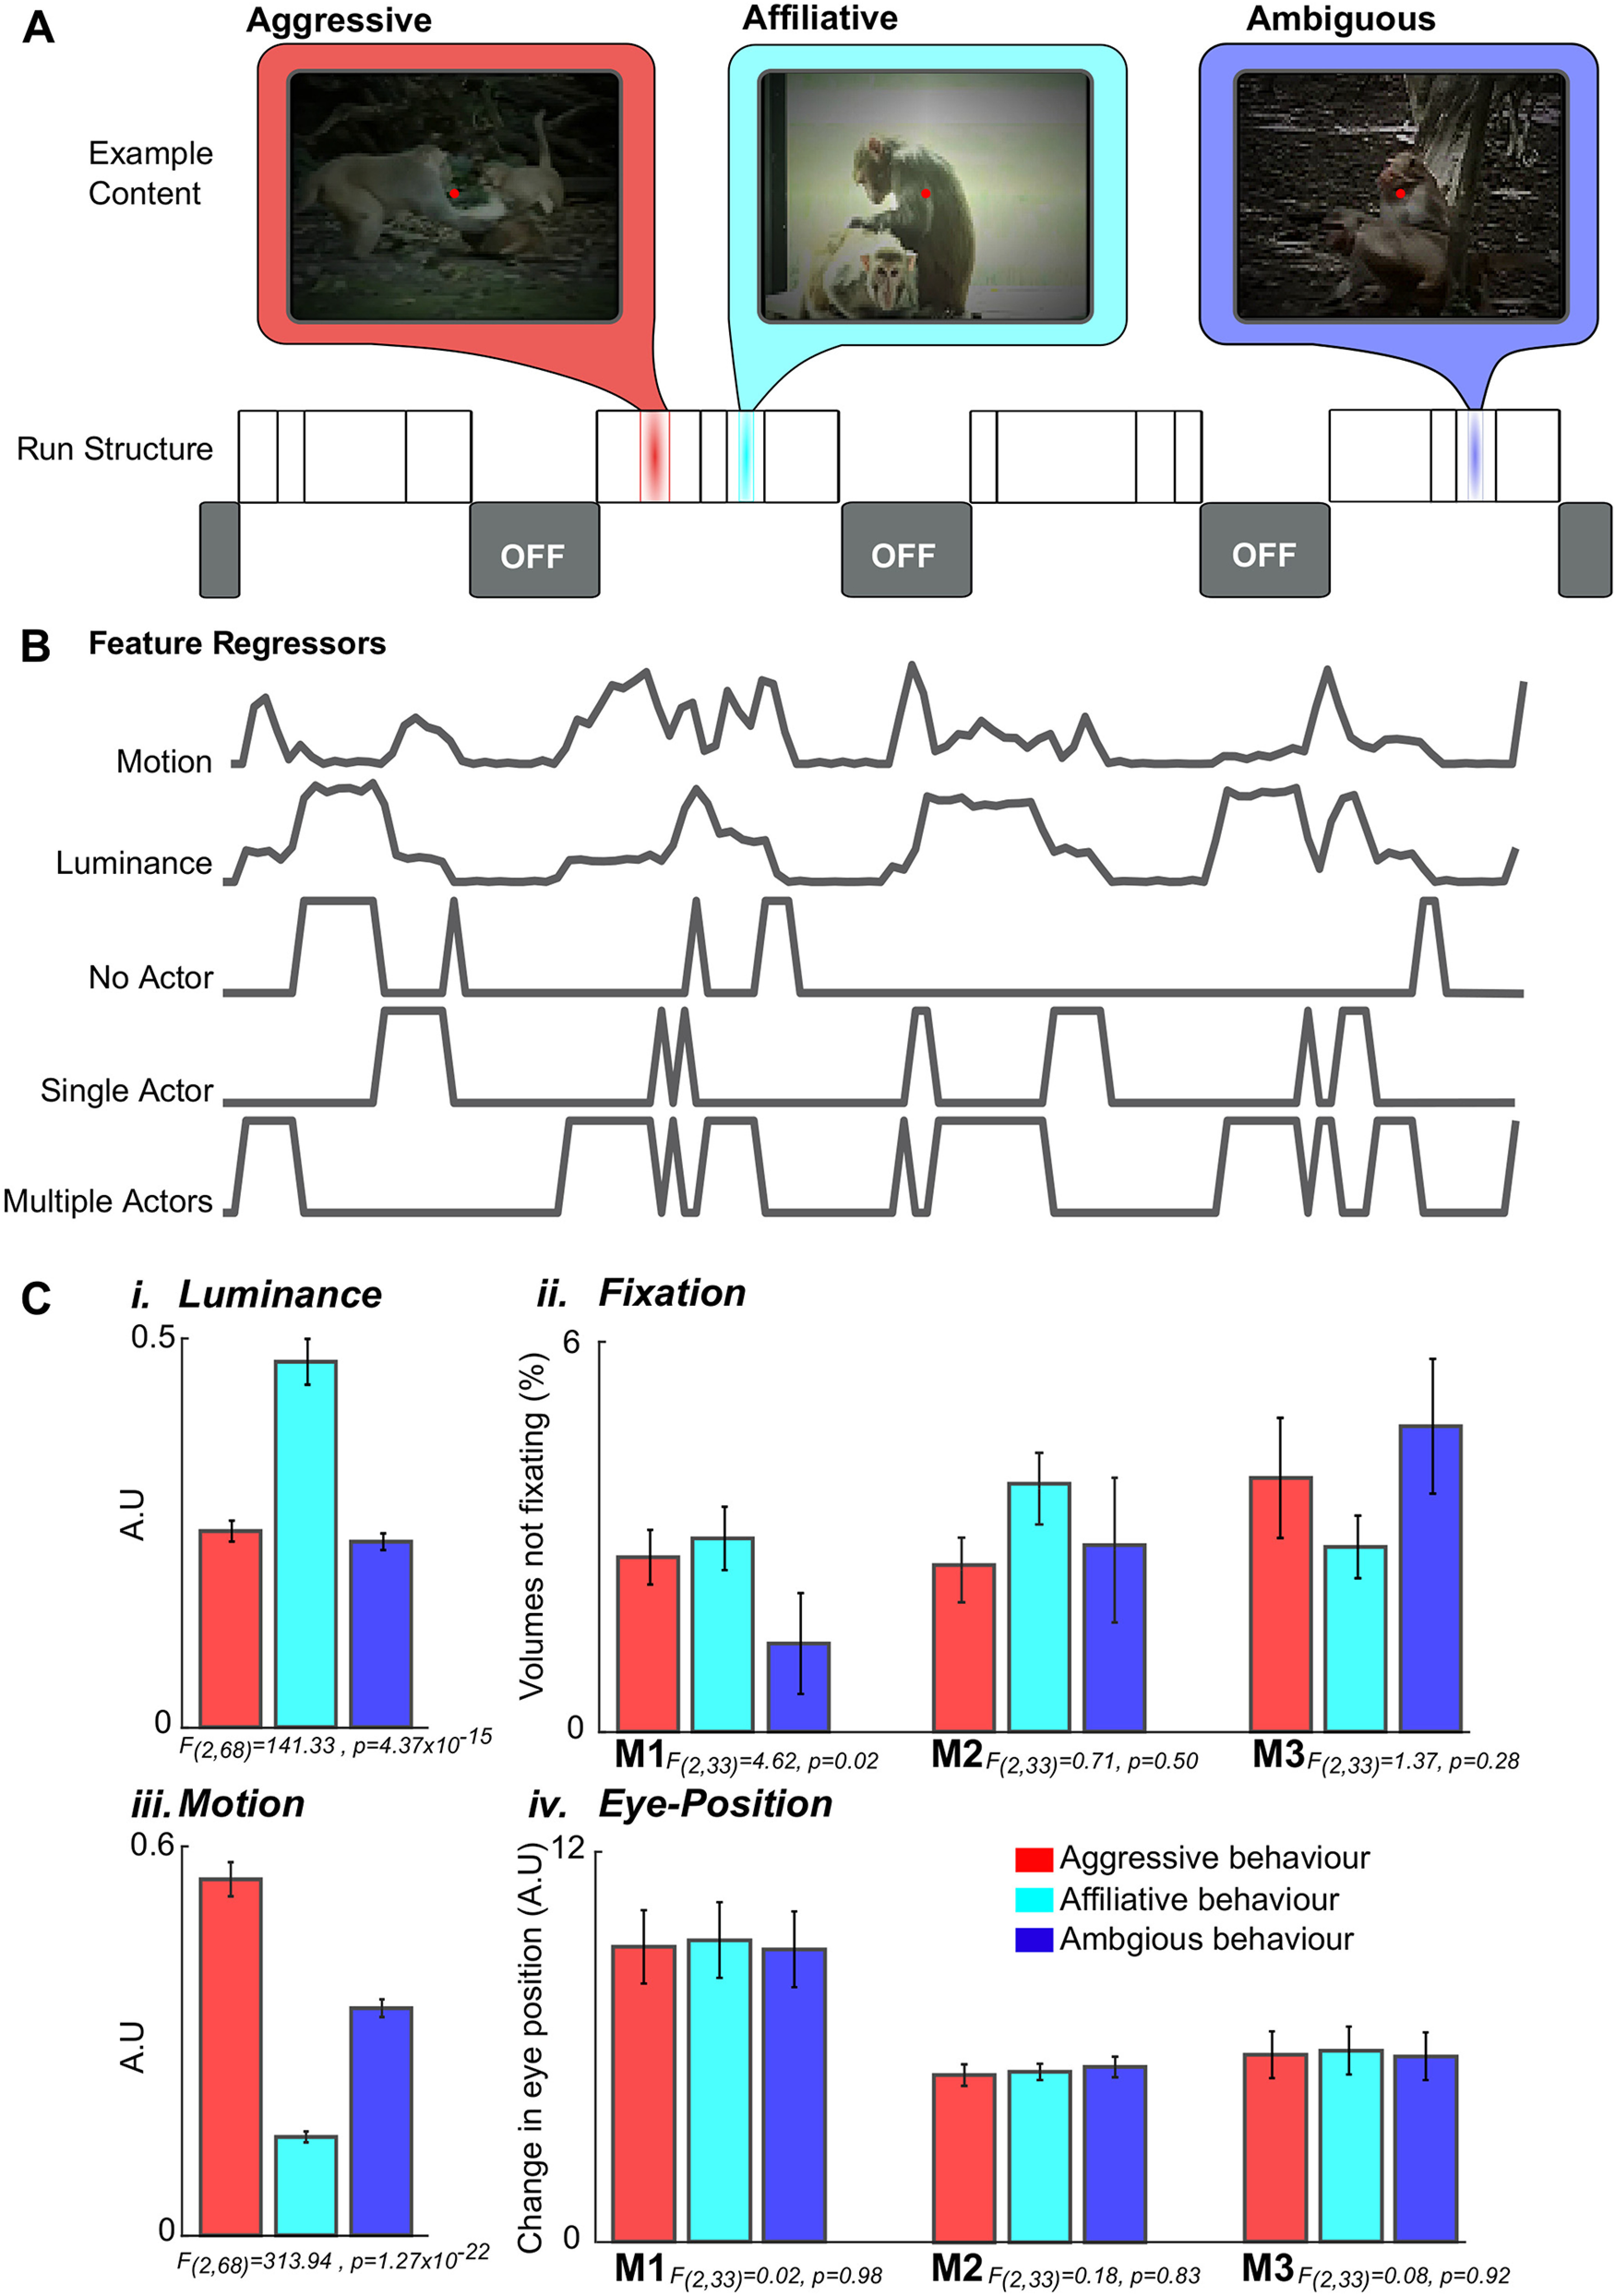
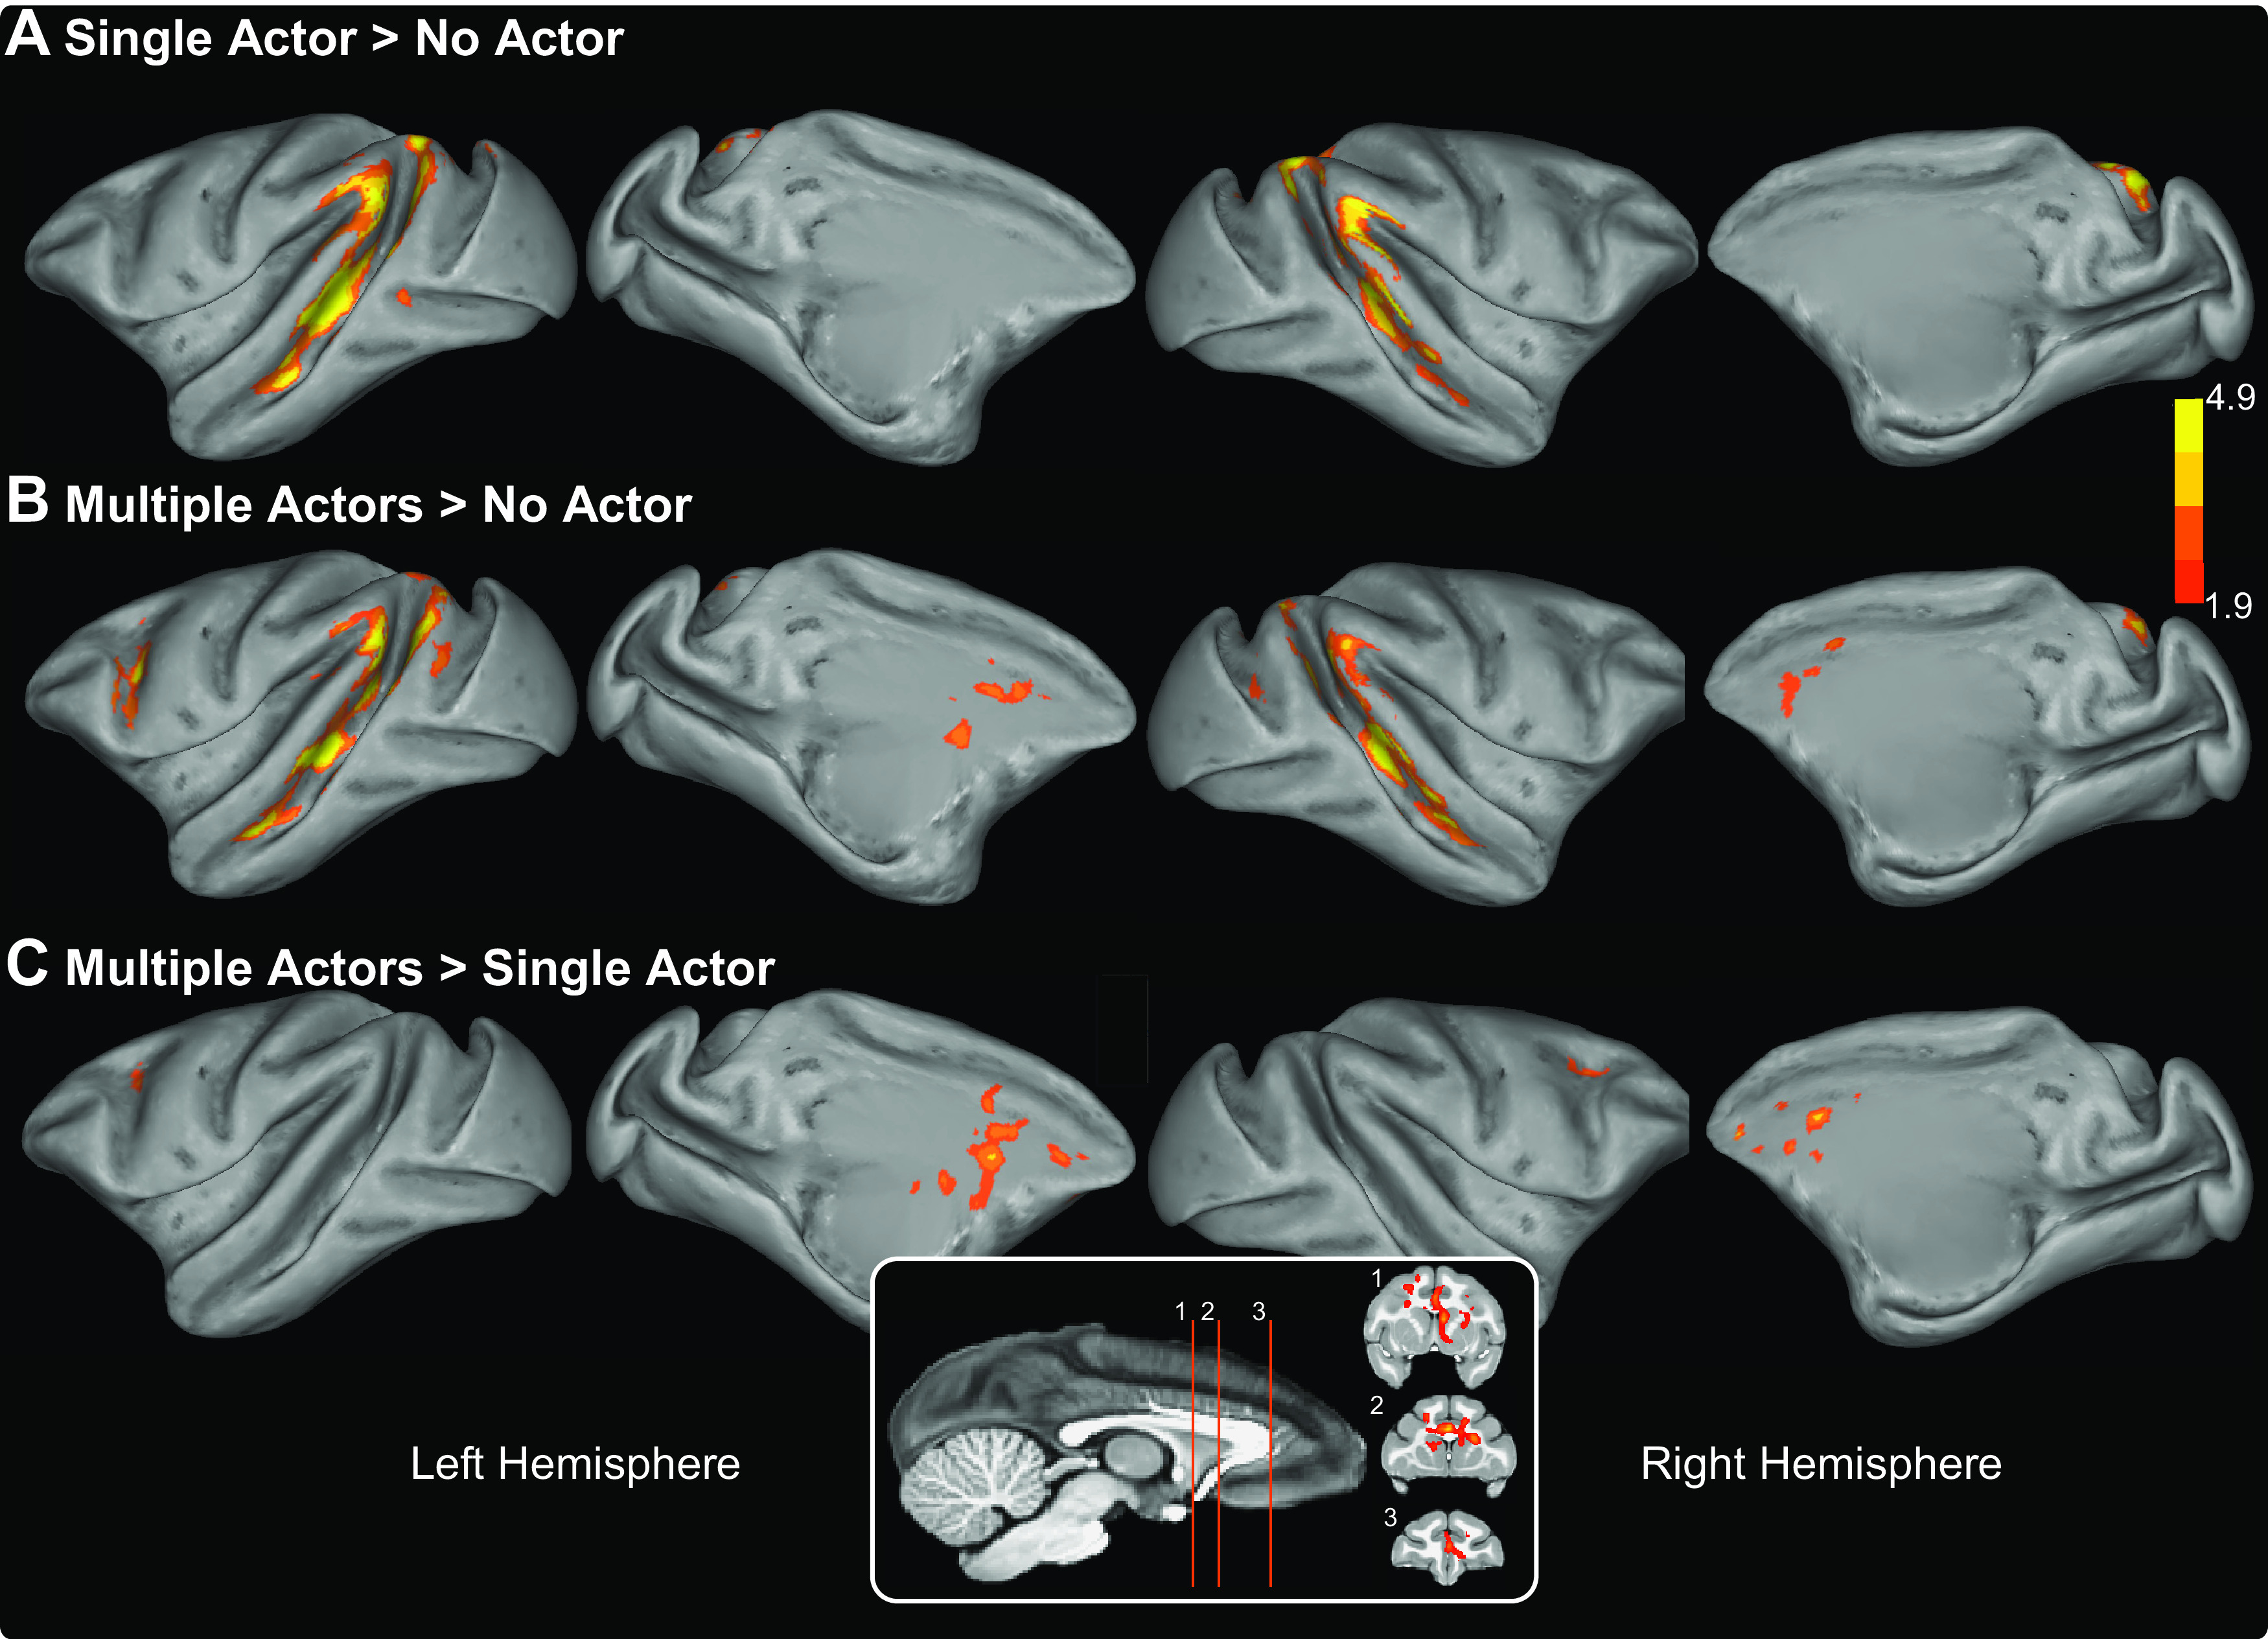
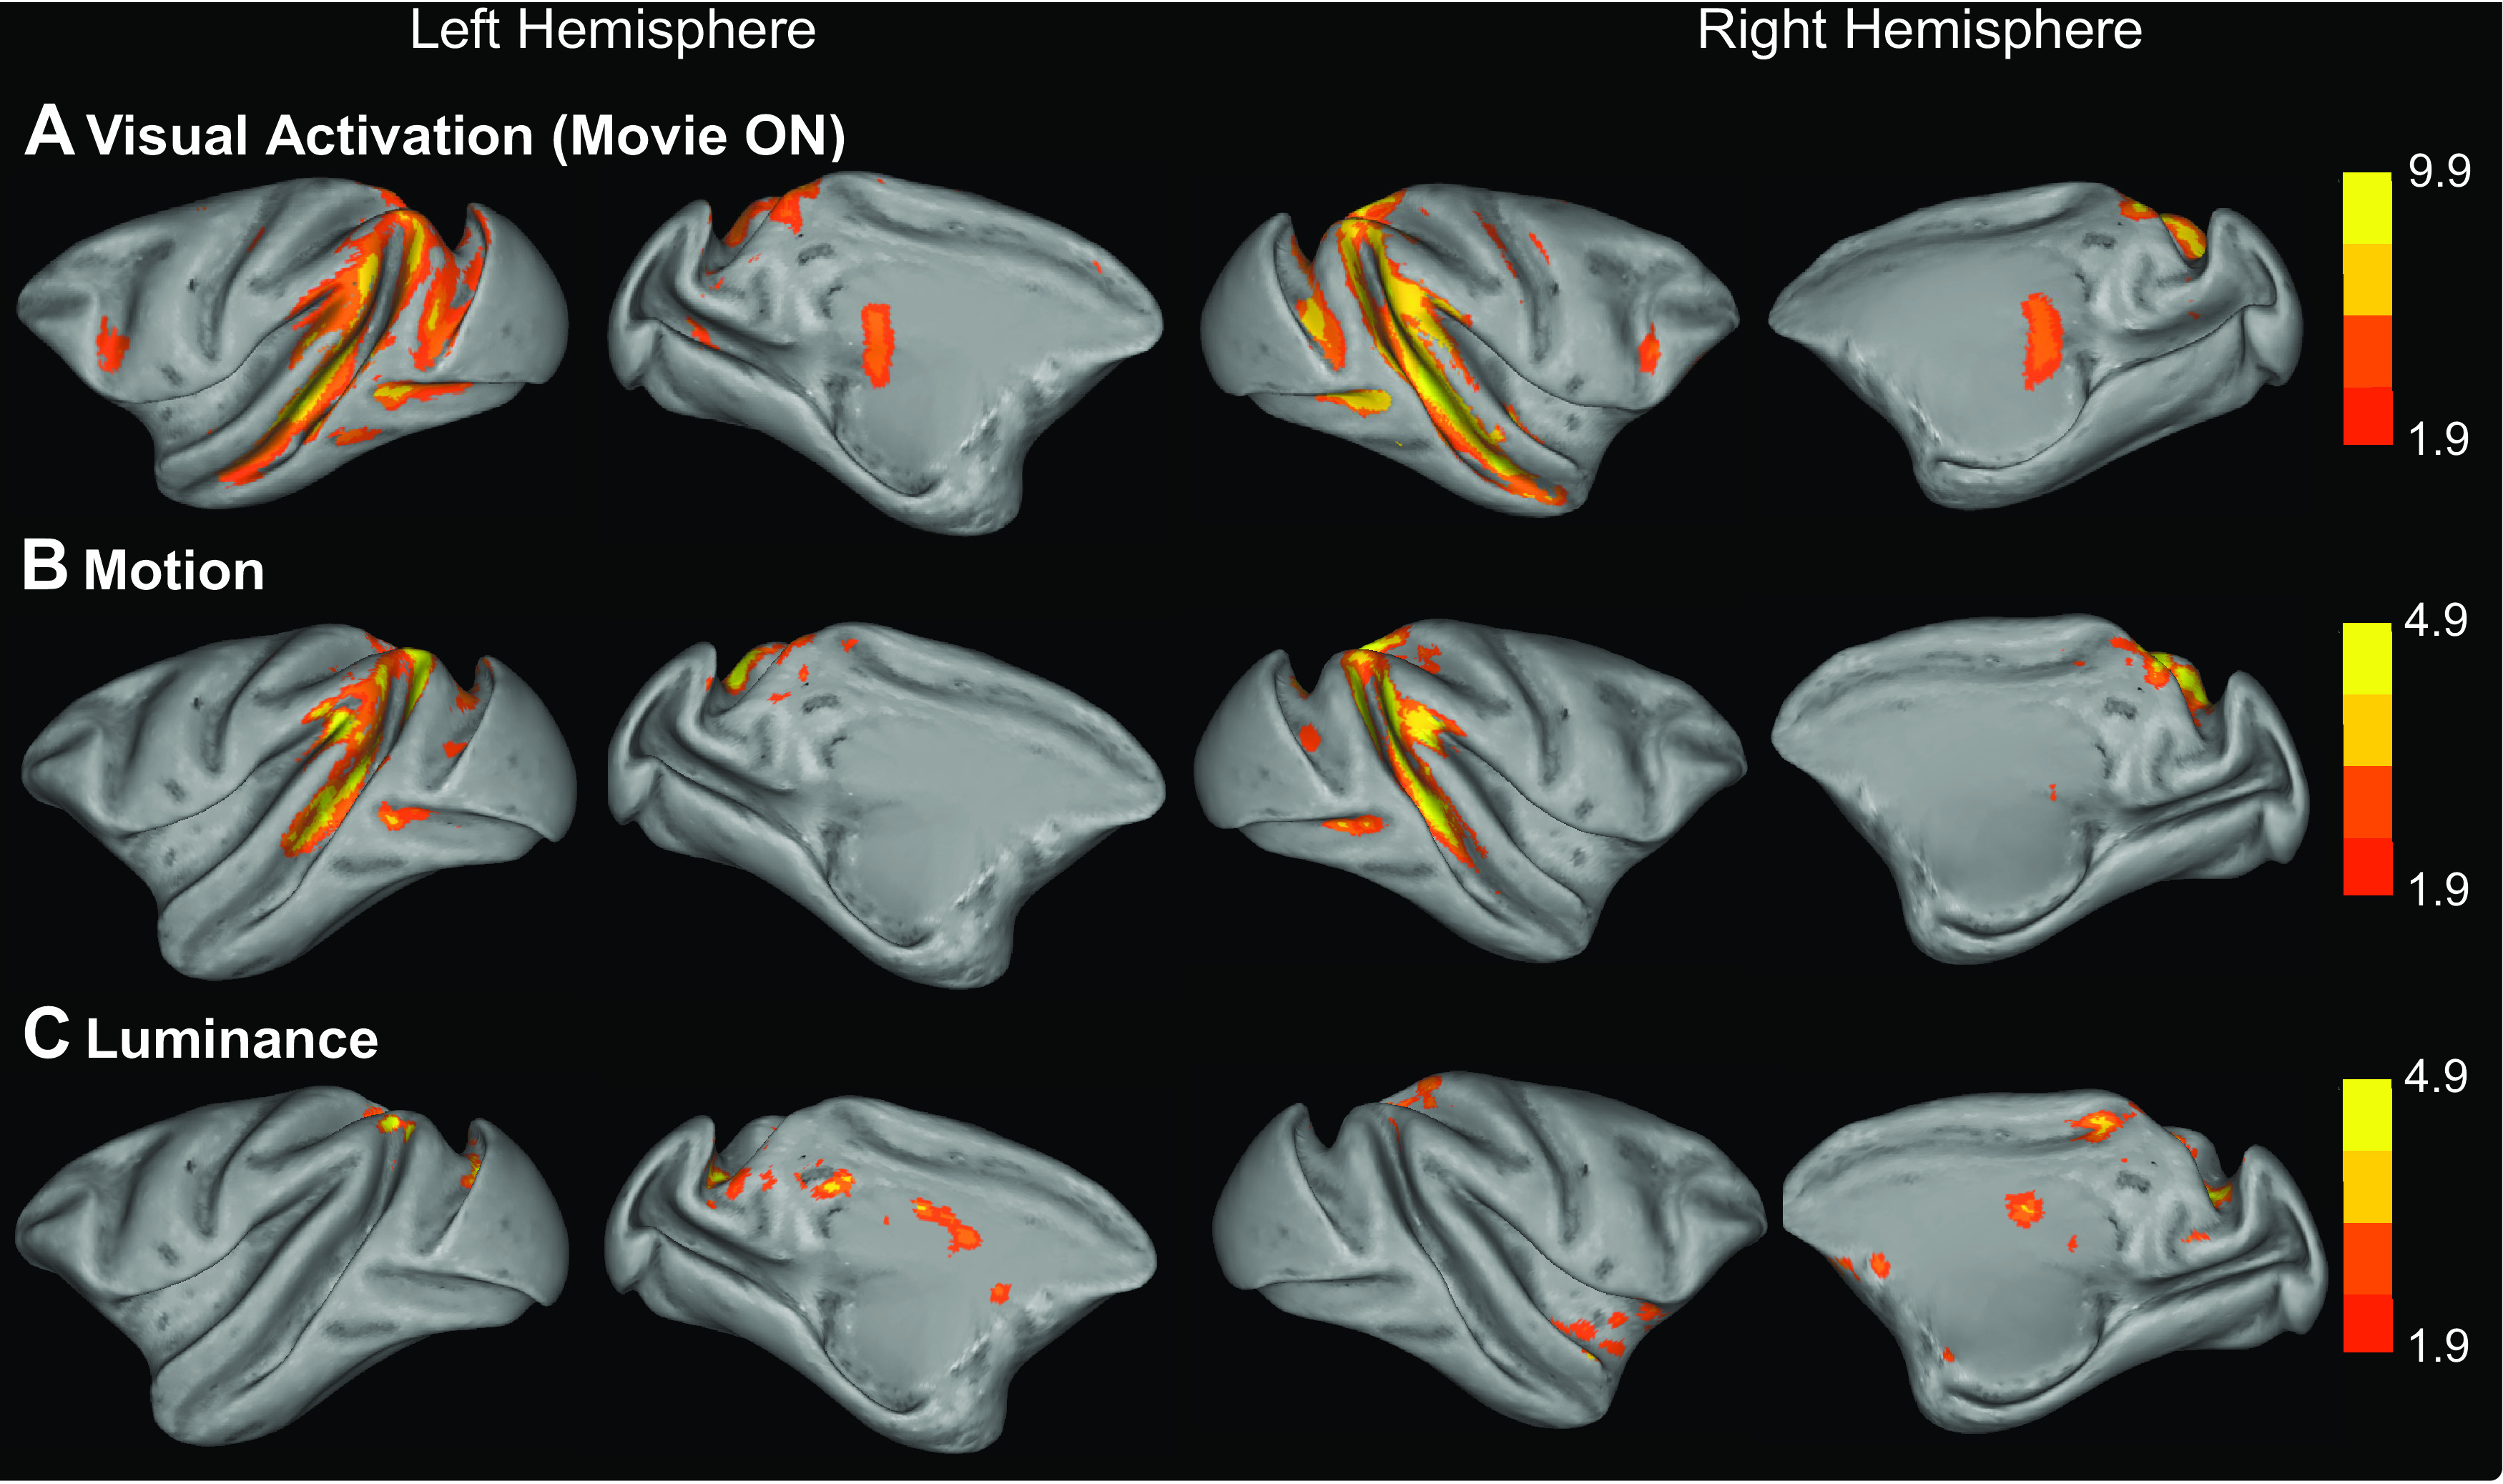
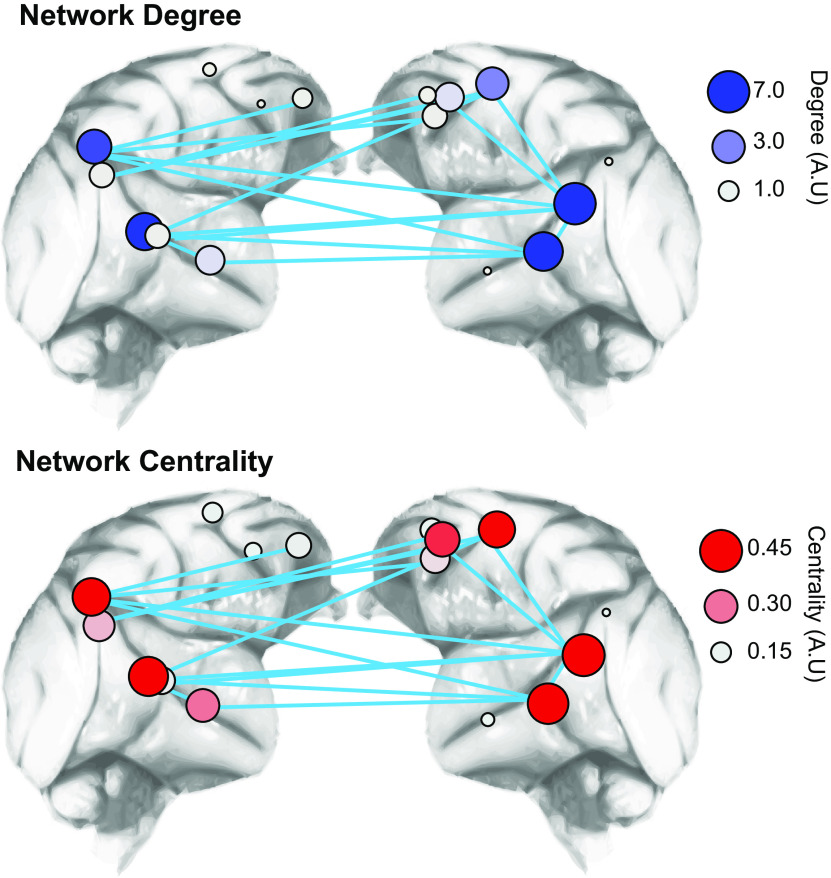
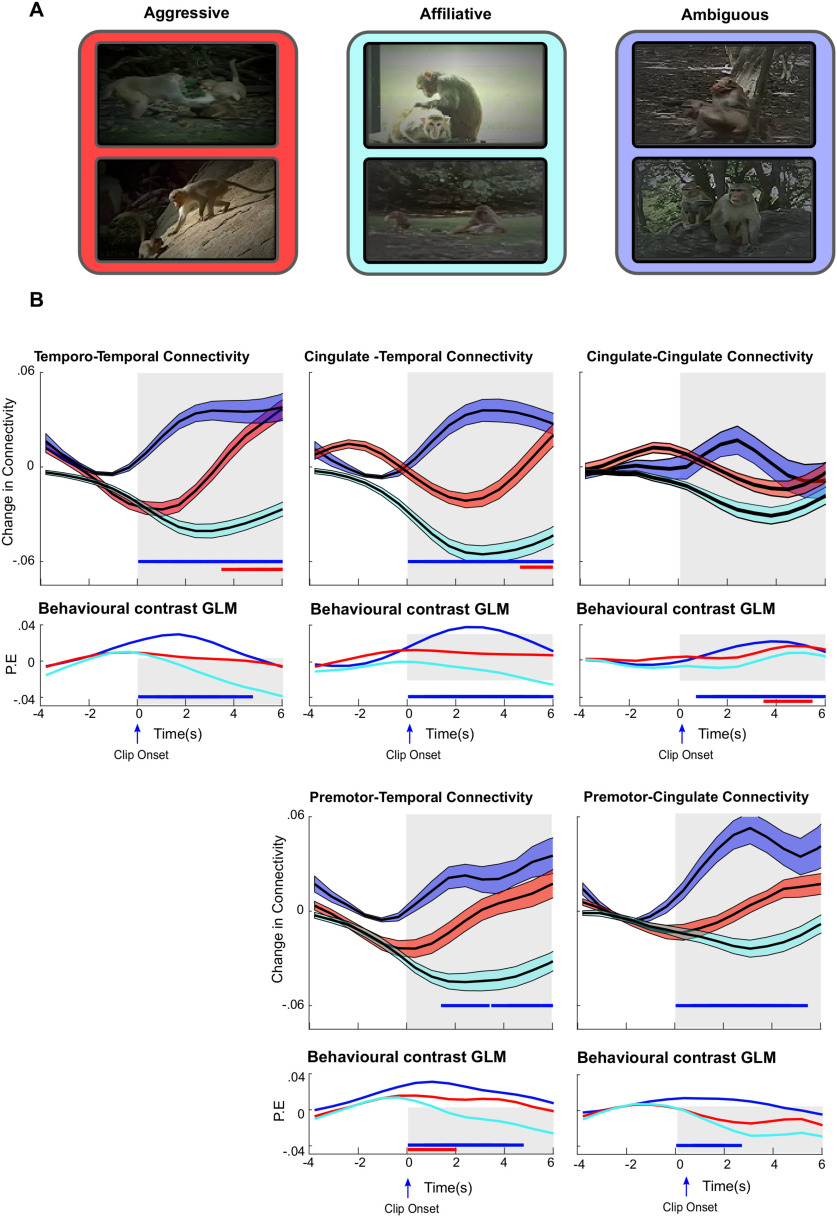
Social behavior is coordinated by a network of brain regions, including those involved in the perception of social stimuli and those involved in complex functions, such as inferring perceptual and mental states and controlling social interactions. The properties and function of many of these regions in isolation are relatively well understood, but less is known about how these regions interact while processing dynamic social interactions. To investigate whether the functional connectivity between brain regions is modulated by social context, we collected fMRI data from male monkeys (Macaca mulatta) viewing videos of social interactions labeled as "affiliative," "aggressive," or "ambiguous." We show activation related to the perception of social interactions along both banks of the superior temporal sulcus, parietal cortex, medial and lateral frontal cortex, and the caudate nucleus. Within this network, we show that fronto-temporal functional connectivity is significantly modulated by social context. Crucially, we link the observation of specific behaviors to changes in functional connectivity within our network. Viewing aggressive behavior was associated with a limited increase in temporo-temporal and a weak increase in cingulate-temporal connectivity. By contrast, viewing interactions where the outcome was uncertain was associated with a pronounced increase in temporo-temporal, and cingulate-temporal functional connectivity. We hypothesize that this widespread network synchronization occurs when cingulate and temporal areas coordinate their activity when more difficult social inferences are being made.SIGNIFICANCE STATEMENT Processing social information from our environment requires the activation of several brain regions, which are concentrated within the frontal and temporal lobes. However, little is known about how these areas interact to facilitate the processing of different social interactions. Here we show that functional connectivity within and between the frontal and temporal lobes is modulated by social context. Specifically, we demonstrate that viewing social interactions where the outcome was unclear is associated with increased synchrony within and between the cingulate cortex and temporal cortices. These findings suggest that the coordination between the cingulate and temporal cortices is enhanced when more difficult social inferences are being made.

Keywords: fMRI; face-processing; monkey; social cognition.


Figures

Figure 1.
Figure 1.
Video structure, features of interest, and low-level confounds. A, Individual runs consisted of 4 video sequences interleaved with periods of blank. Each video sequence consisted of 5 to 20 s long clips of macaques engaged in social and nonsocial behaviors. Social behaviors were classified as aggressive interactions (red), affiliative interactions (cyan), or ambiguous behavior (blue). In each video sequence, periods with several immediately abutted video clips alternated with 20 s blank periods (labeled “OFF”). B, Example regressors used in a GLM analysis to localize visual and social activity in the brain. Regressors were calculated from the video content and included visual features (video clips ON/OFF, luminance, and motion) and social features (number of macaques present in each scene). Note regressors shown before convolution with the hemodynamic response function. Ci, Low-level confounds. Cii, Average luminance. Ciii, Percentage of volumes discarded from whole-brain GLM and dynamic connectivity analysis for each subject (M1-M3). Civ, The average motion energy. The mean change in eye position in degrees of visual angle calculated as the Euclidean distance between adjacent samples for each subject (M1-M3) for each of the three behaviors of interest (aggressive affiliative, and ambiguous). Errorbars denote the SEM.
Figure 2.
Figure 2.
Cortical activation on viewing single actors and multiple actors engaged in natural behavior. A-C, Inflated brains showing significant clusters from three contrasts derived from the number of actors visible in the videos. All data presented are from the third-level GLM analysis that combined activations from all 3 animals. The contrasts include scenes with a single actor versus scenes with no actors visible (A), scenes containing multiple actors versus scenes with no actors visible (B), and scenes containing multiple actors versus scenes containing single actors, regardless of the behavior of the visible actors (C). Medial frontal lobe activation from the multiple versus single actor contrast is shown as insets overlaid on coronal anatomic slices. All data shown survived a cluster correction at z statistic > 1.9 and p < 0.05.
Figure 3.
Figure 3.
Cortical activation associated with low-level visual video features. A-C. Inflated brains showing significant clusters from three contrasts of low-level visual features calculated from the videos. All data presented are from the third-level GLM analysis combining activation from all 3 animals. The contrasts include the following: the basic visual activation during each session (video ON/OFF, A); the motion within the video, calculated by a block matching algorithm examining differences between frames of the video content (see Materials and Methods for details, B); and the luminance of the video scenes (C). Note the differences in scales as different thresholds (z statistic > 6.5 z statistic > 1.9 and z statistic > 1.9) were applied to the data shown in A-C, respectively, and all images were cluster-corrected at p < 0.05.
Figure 4.
Figure 4.
The structure and dynamic functional connectivity of the putative social network. A, Surface maps and coronal slices showing the 16 ROIs selected from the z statistic maps in Figure 2 as constituting the core of a social network. Magenta represents medial frontal cortex. Cyan represents lateral PFC. Yellow represents temporal/parietal ROIs. Exact ROI coordinates are available in Extended Data Figure 4-1. B, Single-session examples of the global dynamics of the network. The average dynamic functional connectivity between ROIs in the network, calculated using a time-windowed phase synchrony measure (top, black trace; calibration: 100 s, 0.5 AU) and the average variance in functional connectivity within the network (bottom, red trace; calibration: 100 s, 0.1 AU). Both examples were averaged over the 880 s of unique video content presented in a single session. The ON/OFF structure of the video is shown behind each trace (movie ON/OFF represented by light blue/gray bars, respectively). Interruptions in the bars represent the stop/start of each of the four individual runs. Stars represent peaks in mean network connectivity and mean variance in connectivity, respectively. C, D, Detailed analysis of the structure of the putative social network in the absence of visual stimulation (C) and during nonsocial visual stimulation (D). Functional connectivity matrices (top) show the strength of all possible connections between ROIs during both these conditions. Suprathreshold connections (the strongest 15% of connections, outlined in black) were selected from both matrices and the anatomic properties of the connections visualized with two network schematics. In the first schematic, suprathreshold connections (shown in light blue) are displayed, linking the relevant ROIs (colored according to the above scheme) of the core network (middle). In addition, suprathreshold connections are summarized in a simplified representation linking the left and right frontal and temporal lobes. The thickness of the connection between these lobes corresponds to the proportion of the total suprathreshold connections, which are present between the lobes (bottom).
Figure 5.
Figure 5.
Social modulation of network functional connectivity. A, Average connectivity matrices calculated from scenes during which monkeys viewed multiple macaques engaged in each of the three social interactions of interest (aggressive, affiliative, and ambiguous behavior). B, Results of a repeated-measures ANOVA assessing the degree to which network functional connectivity was modulated by social interaction (within-subject factor with three levels, aggressive/affiliative/ambiguous; for details, see Materials and Methods). The z statistic and p values obtained from this analysis for each connection are displayed as summary matrices. Connections with the strongest social modulation were selected with a threshold of z > 2.05 (equivalent to the strongest 15% of connections, suprathreshold connections outlined in black). C, Suprathreshold connections are graphically represented in blue between ROIs in the network (left). Simplified graphical representation of connections between the left and right frontal and temporal lobes. The thickness of the connecting line represents the proportion of suprathreshold connections displaying social modulation of functional connectivity.
Figure 6.
Figure 6.
Network degree and eigenvector centrality of suprathreshold socially modulated connections. Graphical representation of degree (top) and eigenvector centrality (bottom) of each ROI calculated from suprathreshold socially modulated connections. ROIs with greater degree (blue nodes) and centrality (red nodes) indicated as larger and stronger colored nodes within the network. The positions of ROIs are approximate, and all ROIs are shown on lateral cortical surface.
Figure 7.
Figure 7.
Viewing ambiguous behavioral interactions drives increased functional connectivity between cingulate gyrus and temporal lobe. The average time course of functional connectivity between the cingulate gyrus and premotor cortex and temporal lobe ROIs aligned to the onset of clips in which the behavioral interactions were classified as aggressive (red), affiliative (cyan), or ambiguous (blue). A, Example frames of the three behaviors contained in the clips. B, Top subplots, The clip-onset triggered functional connectivity calculated from temporo-temporal (top left panels), cingulate-temporal (top middle panels), cingulate-cingulate (top right panels), premotor-temporal (bottom middle panels), and premotor-cingulate (bottom right panels) connections for each of the three behaviors viewed. Consistent with previous analyses, only the strongest 15% of connections were considered. Colored bounds denote the SEM. Top subplots, Colored bars represent time points with functional connectivity significantly stronger than pre-onset baseline (significance was determined by one-sample, one-tailed, t test p < 0.05). Bottom subplots for each panel show parameter estimates for three contrasts: ambiguous > the average of affiliative and aggressive behavior (blue); aggressive > the average of affiliative and ambiguous behavior (red); and affiliative > the average of aggressive and ambiguous behavior (cyan). Bottom subplots, Colored bars represent time points at which the relevant contrast is significant at p < 0.05. All p values corrected for multiple comparisons using Bonferroni correction.

Similar articles

Cited by

References

    1. Aharon I, Etcoff N, Ariely D, Chabris CF, O'Connor E, Breiter HC (2001) Beautiful faces have variable reward value: fMRI and behavioral evidence. Neuron 32:537–551. 10.1016/S0896-6273(01)00491-3 - DOI - PubMed
    1. Ainsworth M, Browncross H, Mitchell DJ, Mitchell AS, Passingham RE, Buckley MJ, Duncan J, Bell AH (2018) Functional reorganisation and recovery following cortical lesions: a preliminary study in macaque monkeys. Neuropsychologia 119:382–391. 10.1016/j.neuropsychologia.2018.08.024 - DOI - PMC - PubMed
    1. Alves PN, Foulon C, Karolis V, Bzdok D, Margulies DS, Volle E, de Schotten T (2019) Subcortical anatomy of the default mode network: a functional and structural connectivity study. bioRxiv 528679.
    1. Apps MA, Ramnani N (2014) The anterior cingulate gyrus signals the net value of others' rewards. J Neurosci 34:6190–6200. 10.1523/JNEUROSCI.2701-13.2014 - DOI - PMC - PubMed
    1. Arioli M, Canessa N (2019) Neural processing of social interaction: coordinate-based meta-analytic evidence from human neuroimaging studies. Hum Brain Mapp 40:3712–3737. 10.1002/hbm.24627 - DOI - PMC - PubMed

LinkOut - more resources