. 2021 Jun 15;118(24):e2024176118.
doi: 10.1073/pnas.2024176118.

Accurate genomic variant detection in single cells with primary template-directed amplification

Affiliations

Accurate genomic variant detection in single cells with primary template-directed amplification

Veronica Gonzalez-Pena et al. Proc Natl Acad Sci U S A. .

Abstract

Improvements in whole genome amplification (WGA) would enable new types of basic and applied biomedical research, including studies of intratissue genetic diversity that require more accurate single-cell genotyping. Here, we present primary template-directed amplification (PTA), an isothermal WGA method that reproducibly captures >95% of the genomes of single cells in a more uniform and accurate manner than existing approaches, resulting in significantly improved variant calling sensitivity and precision. To illustrate the types of studies that are enabled by PTA, we developed direct measurement of environmental mutagenicity (DMEM), a tool for mapping genome-wide interactions of mutagens with single living human cells at base-pair resolution. In addition, we utilized PTA for genome-wide off-target indel and structural variant detection in cells that had undergone CRISPR-mediated genome editing, establishing the feasibility for performing single-cell evaluations of biopsies from edited tissues. The improved precision and accuracy of variant detection with PTA overcomes the current limitations of accurate WGA, which is the major obstacle to studying genetic diversity and evolution at cellular resolution.

Keywords: genome editing off-target; mutagenesis; single-cell sequencing; whole genome amplification.


Conflict of interest statement

Competing interest statement: C.G. is a Co-Founder and Board Member of BioSkryb Genomics, which is commercializing primary template-directed amplification.

Figures

Fig. 1.
Fig. 1.
Overview of PTA. (A) Comparison of MDA to PTA. Both MDA and PTA take advantage of the processivity, strand displacement activity, and low error rate of the Phi29 polymerase. However, in MDA, exponential amplification at locations where the polymerase first extends the random primers results in overrepresentation of random loci and alleles. In contrast, in PTA, the incorporation of exonuclease-resistant terminators in the reaction result in smaller double-stranded amplification products that undergo limited subsequent amplification, resulting in a quasilinear process with more amplification originating from the primary template. As a result, errors have limited propagation from daughter amplicons during subsequent amplification compared to MDA. In addition, PTA has improved and reproducible genome coverage breadth and uniformity, as well as diminished allelic skewing. (B) Yield of PTA and MDA reactions over time with either a single cell or no template control (NTC) showing MDA has a much steeper slope as the reaction undergoes exponential amplification. In addition, PTA has very little product detected in NTC samples, compared to similar yields for MDA whether there is a single cell or NTC. (C) Example of SCMDA coverage and uniformity across chromosome 1 in 100 kb bins. (D) Example of PTA coverage and uniformity across chromosome 1 in 100 kb bins. (Error bars represent one SD.)
Fig. 2.
Fig. 2.
Single-cell genome coverage breadth and uniformity of different WGA methods. PTA and SCMDA were performed on random GM12878 cells (n = 10, dot represents the mean of 10 individual cells) while DOP-PCR (n = 3), GE MDA (n = 3), Qiagen MDA (n = 3), MALBAC (n = 3), LIANTI (n = 11), or PicoPlex (n = 3) were performed on selected BJ1 cells as part of the LIANTI study. (A) Genome coverage comparison across different methods at increasing number of single end sequencing reads. PTA approaches the genome coverage obtained in both bulk samples at every sequencing depth. Note that 600 million 150 bp single reads represents about 30× whole genome coverage. (B) Genome coverage uniformity as measured by the CV at increasing sequencing depth. (C) Genome coverage uniformity as measured by the Lorenz curves. The diagonal line represents perfectly uniform genome coverage. The further a curve deviates from the diagonal line, the more bias in genome coverage. PTA is the WGA method that most closely approximates to the genome coverage uniformity obtained from bulk sequencing. The bulk curve was calculated from reads of unamplified bulk GM12878 sample. (D) Reproducibility of amplification uniformity. The Gini Index measures the departure from perfect uniformity. Smaller SD and lower Gini Index values were measured in PTA samples (purple asterisk), as compared to the other WGA methods. (For dot and line plots, error bars represent one SD; for boxplots, center line is the median; box limits represent upper and lower quartiles; whiskers represent 1.5× interquartile range; points show outliers.)
Fig. 3.
Fig. 3.
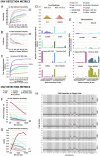
Improved PTA coverage metrics increase variant detection accuracy. (A) Comparison of the SNV detection sensitivity in single cells. The SNV sensitivity of each method was calculated as the ratio of the variants identified in each cell by that method to the variants identified in the corresponding unamplified bulk sample at a given sequencing depth. The increased genome coverage, as well as the more uniform distribution of the reads across the genome significantly improves the detection of SNVs by PTA over all other single-cell WGA methods. (B) Comparison of SNV calling precision in single cells. Discordant calls in single cells (FP plus somatic variants) were defined as variant calls in single cells not found in the corresponding bulk samples. Methods using low temperature lysis and/or isothermal polymerase produced significantly lower discordant calls than methods using thermostable polymerases. (C) Summary of SNV calling accuracy for each method at decreasing variant quality score log-odds (VQSLOD) score from GATK. (D) Comparison of allele dropout and frequencies of SNVs called heterozygous in the bulk sample. PTA more evenly amplifies both alleles in the same cell, resulting in significantly diminished allelic dropout and skewing. (E) Comparison of discordant variant call allele frequencies. The quasilinear amplification and suppression of error propagation in PTA result in lower discordant calls than all other methods. (F) Mean CV of coverage at increasing bin size in a primary leukemia sample using the latest commercially available kits as an estimate of CNV calling accuracy (corresponding coverage and SNV calling metrics for these methods in these samples presented in SI Appendix, Fig. S5, n = 5 for each method). (G) Mean MAPD at increasing bin size as a second estimate of CNV calling sensitivity (n = 5 for each method). (H) Example of CNV profiles of PTA product from single cells and DNA from the corresponding bulk sample. The red arrow represents an area where subclonal gain of chromosome 21 was suggested but not called in the bulk sample, while three of eight cells were found to have the same alteration (additional cells and samples are presented in SI Appendix, Figs. S7 and S8). (For dot and line plots, error bars represent one SD; for boxplots, center line is the median; box limits represent upper and lower quartiles; whiskers represent 1.5× interquartile range; points show outliers.)
Fig. 4.
Fig. 4.
Using kindred cells to more accurately measure SNV types. (A) Overview of strategy for kindred cell experiment where single cells are plated and cultured prior to reisolation, PTA, and sequencing of individual cells. (B) Strategy for classifying variant types by comparing bulk and single-cell data. (C) Germline SNV calling sensitivity and precision for each cell using the bulk as the gold standard. (D) Total number of true positive germline variants detected in each cell. (E) Percent of variants that were called heterozygous for different variant classes. (F) Measured somatic variant rates in a single CD34+ human cord blood cell after focusing on the higher quality variant calls (DP ≥ 10, GQ ≥ 20, allele frequency ≥ 0.35) of 0.33 +/− 0.02 somatic SNVs per CD34+ cord blood cell.
Fig. 5.
Fig. 5.
Measuring mutagenicity in vivo at single-cell resolution using DMEM. In the DMEM assay, human cells are exposed to a test compound. Exposed cells then undergo PTA and single-cell sequencing to create a map of genome–mutagen interactions in living cells. (A) Single cells exposed to N-ethyl-N-nitrosourea (ENU) or D-mannitol (MAN) show a dose-dependent increase in ENU-induced mutagenesis. (n = 5 for all samples except highest dose of ENU where n = 4.) (B) Base change preference by ENU and D-mannitol identify the previously recognized T to C (A to G) and T to A (A to T) base changes as being most common with ENU exposure. (C) Identification of a unique ENU mutational signature, which was deconvoluted into known COSMIC single base substitution signatures. The relative proportion of COSMIC signatures were then used to reconstruct a signature that can then be compared to the original ENU signature to identify which changes are captured by the approach. (For boxplots, center line is the median; box limits represent upper and lower quartiles; whiskers represent 1.5× interquartile range; points show outliers.)
Fig. 6.
Fig. 6.
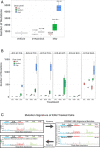
Measuring off-target activity of genome editing strategies at single-cell resolution. (A) Overview of experimental and computational strategy where single edited cells are sequenced and indel calling is limited to sites with up to five mismatches with the protospacer. (B) Number of indel calls per cell. Each control or experimental cell type underwent indel calling where the target region had up to five base mismatches with either the VEGFA or EMX1 protospacer sequences. The gRNA or control listed in the key specify which gRNA that cell received. Instances where the indel is called in a genomic region that does not match the gRNA received by that cell are presumed to be false positives. (C) Table of total number of off-target indel locations called that were either unique to one cell or found in multiple cells. (D) Genomic locations of recurrent indels with EMX1 or VEGFA gRNAs. On-target sites are noted in gray. (E) Circos plots of SV identified in each cell type that received either the EMX1 or VEGFA gRNA with sites that contained at least one recurrent breakpoint seen across cell types in green or only in that cell type in red. The number of SV detected per cell is plotted to the right. (For boxplots, center line is the median; box limits represent upper and lower quartiles; whiskers represent 1.5× interquartile range; points show outliers.)

References

    1. Maciejewska A., Jakubowska J., Pawłowski R., Whole genome amplification of degraded and nondegraded DNA for forensic purposes. Int. J. Legal Med. 127, 309–319 (2013). - PMC - PubMed
    1. Poulakakis N., et al. ., Ancient DNA forces reconsideration of evolutionary history of Mediterranean pygmy elephantids. Biol. Lett. 2, 451–454 (2006). - PMC - PubMed
    1. Marcy Y., et al. ., Dissecting biological “dark matter” with single-cell genetic analysis of rare and uncultivated TM7 microbes from the human mouth. Proc. Natl. Acad. Sci. U.S.A. 104, 11889–11894 (2007). - PMC - PubMed
    1. Gawad C., Koh W., Quake S. R., Single-cell genome sequencing: Current state of the science. Nat. Rev. Genet. 17, 175–188 (2016). - PubMed
    1. Priest J. R., et al. ., Early somatic mosaicism is a rare cause of long-QT syndrome. Proc. Natl. Acad. Sci. U.S.A. 113, 11555–11560 (2016). - PMC - PubMed

Publication types

LinkOut - more resources