. 2021 Jun 15;118(24):e2025053118.
doi: 10.1073/pnas.2025053118.

ALS- and FTD-associated missense mutations in TBK1 differentially disrupt mitophagy

Affiliations

ALS- and FTD-associated missense mutations in TBK1 differentially disrupt mitophagy

Olivia Harding et al. Proc Natl Acad Sci U S A. .

Abstract

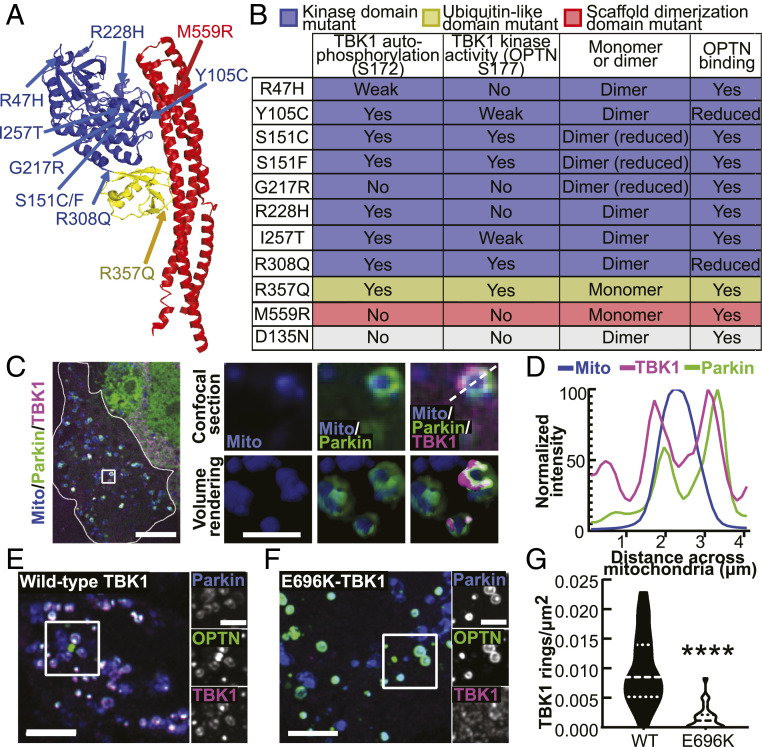
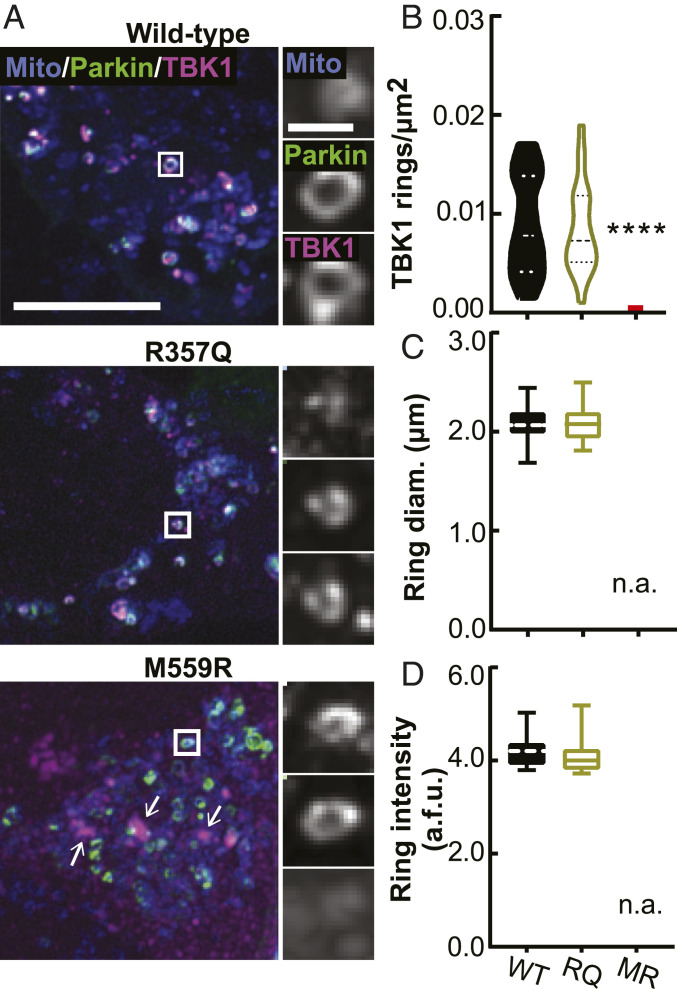
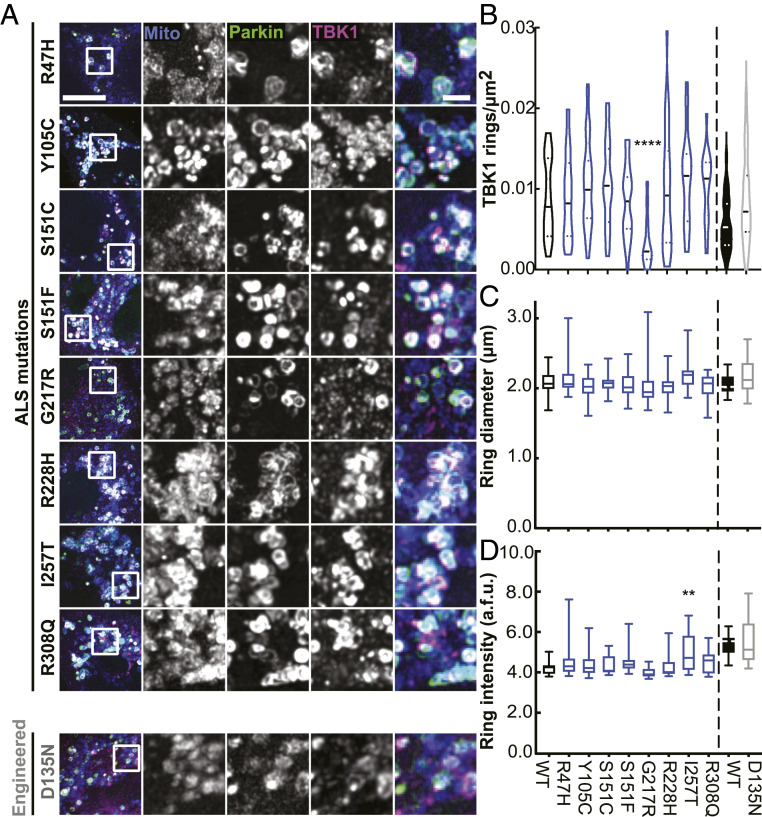
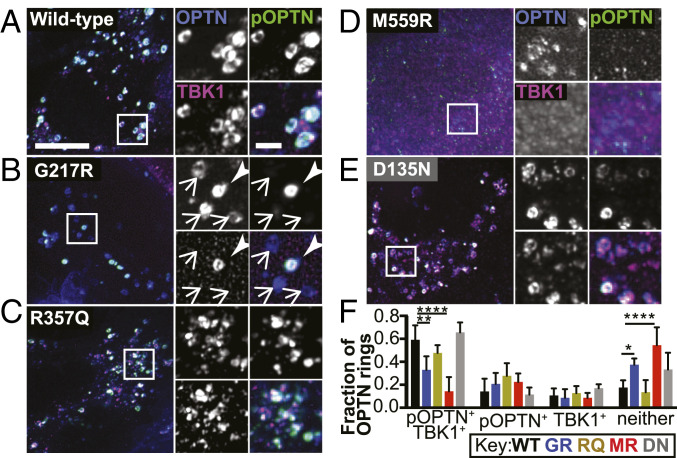
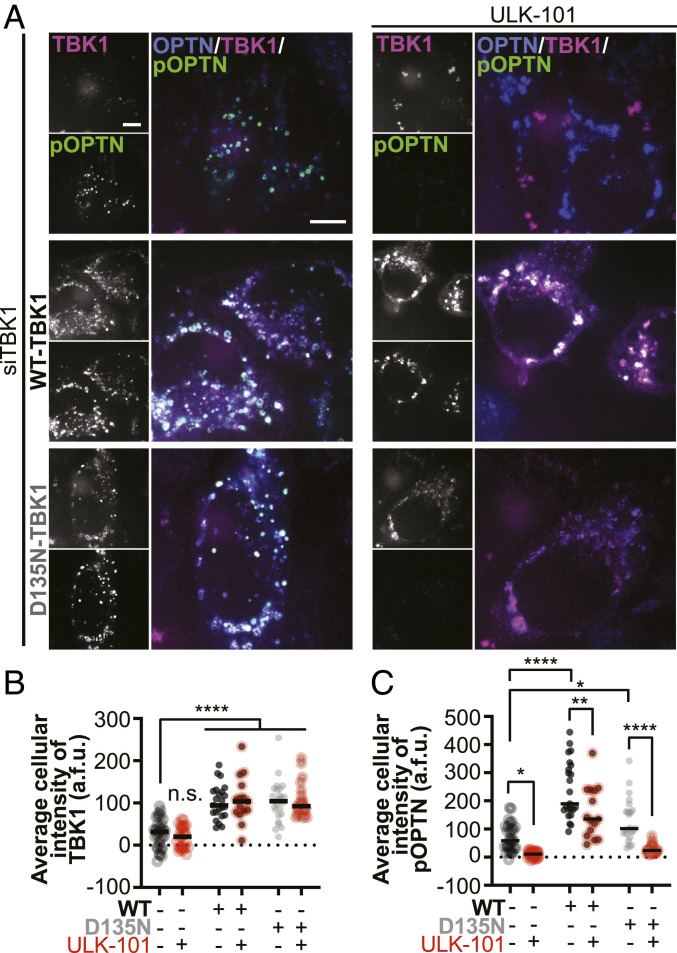
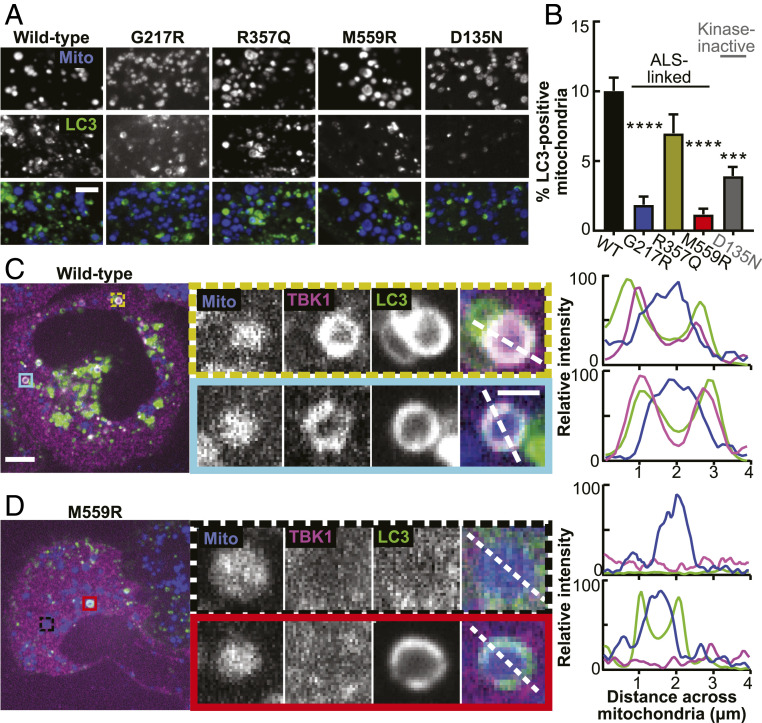
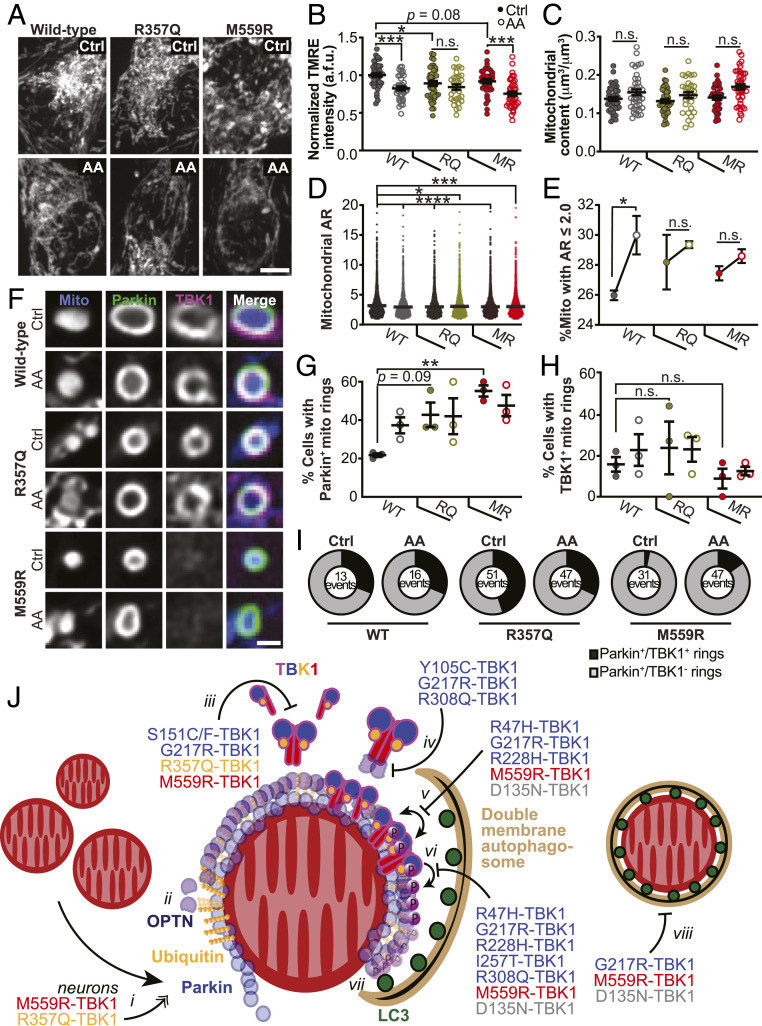
TANK-binding kinase 1 (TBK1) is a multifunctional kinase with an essential role in mitophagy, the selective clearance of damaged mitochondria. More than 90 distinct mutations in TBK1 are linked to amyotrophic lateral sclerosis (ALS) and fronto-temporal dementia, including missense mutations that disrupt the abilities of TBK1 to dimerize, associate with the mitophagy receptor optineurin (OPTN), autoactivate, or catalyze phosphorylation. We investigated how ALS-associated mutations in TBK1 affect Parkin-dependent mitophagy using imaging to dissect the molecular mechanisms involved in clearing damaged mitochondria. Some mutations cause severe dysregulation of the pathway, while others induce limited disruption. Mutations that abolish either TBK1 dimerization or kinase activity were insufficient to fully inhibit mitophagy, while mutations that reduced both dimerization and kinase activity were more disruptive. Ultimately, both TBK1 recruitment and OPTN phosphorylation at S177 are necessary for engulfment of damaged mitochondra by autophagosomal membranes. Surprisingly, we find that ULK1 activity contributes to the phosphorylation of OPTN in the presence of either wild-type or kinase-inactive TBK1. In primary neurons, TBK1 mutants induce mitochondrial stress under basal conditions; network stress is exacerbated with further mitochondrial insult. Our study further refines the model for TBK1 function in mitophagy, demonstrating that some ALS-linked mutations likely contribute to disease pathogenesis by inducing mitochondrial stress or inhibiting mitophagic flux. Other TBK1 mutations exhibited much less impact on mitophagy in our assays, suggesting that cell-type-specific effects, cumulative damage, or alternative TBK1-dependent pathways such as innate immunity and inflammation also factor into the development of ALS in affected individuals.

Keywords: OPTN; Parkin; TBK1; mitophagy; neurodegeneration.


Conflict of interest statement

The authors declare no competing interest.

Figures

Fig. 1.
Fig. 1.
ALS-linked TBK1 mutations are found throughout the molecule and induce biochemical, biophysical, and cellular deficits. (A) Protein databank structure for TANK-binding kinase 1 (TBK1) (PDB 4IWO) (13). Domains are designated by color coding: kinase domain residues 1 to 308 (blue), ubiquitin-like domain residues 309 to 387 (yellow), and scaffolding dimerization domain residues 388 to 657 (red). ALS-linked mutations are indicated by arrows and labels of their respective colors. Some mutations likely disrupt the structure of TBK1, a phenomenon not represented by this model. (B) Table summarizing biochemical results for the ALS-linked mutants published by Ye et al. (8) and the engineered kinase-inactive D135N-TBK1 (gray). (C) Confocal section of a HeLa cell (outlined in white) expressing a mitochondria-localized fluorophore (blue), Parkin (green), and WT-TBK1 (magenta), fixed after treatment with CCCP for 90 min. The Inset (white box) and zoom images (Right) exhibit rounded mitochondria that have recruited Parkin and TBK1. A volume rendering is also shown (Right, bottom row). (Scale bars: zoom out, 10 μm; zoom in, 2 μm.) (D) Relative signal intensities for mitochondria, Parkin, and TBK1 are quantified across the diameter of a damaged mitochondria (white dashed line in C, zoom). (E and F) HeLa cells depleted of endogenous TBK1 expressing Parkin, OPTN, and WT- (E) or E696K- (F) TBK1, fixed after treatment with CCCP for 90 min. Inset (white box) and zoom images (Left) demonstrate multiple rings with colocalized mitophagy components. (Scale bars: zoom out, 10 μm; zoom in, 4 μm.) (G) Quantification of E and F as rings/μm2 for each cell. n = 22 to 25 cells from three independent experiments. Dashed line, median; dotted lines, 25th and 75th quartiles. ****P < 0.0001 by Student’s unpaired t test. Images E and F shown here are insets; for representative images of whole fields, reference SI Appendix, Fig. S2B.
Fig. 2.
Fig. 2.
TBK1 mutants that are unable to dimerize are differentially recruited to damaged mitochondria. (A) Maximum intensity projection images of fixed HeLa cells depleted of endogenous TBK1 expressing a mitochondria-localized fluorophore (blue), Parkin (green), and WT- (Top Row), R357Q- (Middle Row), or M559R- (Bottom Row) TBK1 (magenta) fixed after 90 min CCCP. There are some aggregates of M559R-TBK1 (arrows) that are not coincident with mitochondria. (Scale bars: zoom out, 10 μm; zoom in, 2 μm.) Images shown are insets; for representative images of whole fields, reference SI Appendix, Fig. S2C. (BD) Quantification of TBK1 rings/μm2 (B), ring diameter (C), and ring signal intensity (D). ****P < 0.0001 by ordinary one-way ANOVA with Dunnett’s multiple comparisons test. Dashed line, median; dotted lines, 25th and 75th quartiles. No M559R-TBK1 rings were evident, so all data points are 0 for rings/μm2 (red line), and no data can be displayed for size and intensity. n = 22 to 26 cells from three independent experiments. Data in C and D analyzed by Student’s unpaired t test. Not applicable, n.a. Arbitrary fluorescent units, a.f.u.
Fig. 3.
Fig. 3.
A kinase domain mutation that abolishes the autophosphorylation ability of TBK1 results in fewer TBK1 rings. (A) Maximum intensity projection images of fixed HeLa cells depleted of endogenous TBK1 expressing fluorescent mitochondrial marker (blue), Parkin (green), and TBK1 variants (magenta) and fixed after treatment with CCCP for 90 min. Images shown are insets; for representative images of whole fields, reference SI Appendix, Fig. S3A. (BD) Quantification of TBK1 rings/μm2 (B), ring diameter (C), and ring signal intensity (D). WT-TBK1 ring data (indicated by black outlined plot and bars) are transferred from Fig. 2 for comparison. n = 22 to 32 cells from at least three independent experiments. For ring density, (B) horizontal dashed lines, median; horizontal dotted lines, 25th and 75th quartiles. For (BD) vertical dashed lines distinguish separate data sets. **P < 0.01, ****P < 0.0001 by ordinary one-way ANOVA with Dunnett’s multiple comparisons test. Arbitrary fluorescent units, a.f.u.
Fig. 4.
Fig. 4.
TBK1 variants exhibit differing kinetics and affinities with damaged mitochondria. (A) Representative confocal sections of live HeLa cells depleted of endogenous TBK1 expressing Parkin (green) and TBK1 variants (magenta), treated with CCCP for up to 90 min. White box (Inset) indicates a single representative event tracked over time to measure recruitment of Parkin and TBK1. Stills from timelapse are shown in the panels. Time is indicated as min:sec from initial Parkin recruitment. (Scale bars: zoom out, 10 μm; zoom in, 2 μm.) (B) Background-subtracted TBK1 signal intensity tracked over time with respect to Parkin half maximum (0, vertical dotted line). n = 3 to 6 representative events from at least three independent experiments. Error bars indicate SEM. (C) A representative Western blot of HEK TBK1−/− cells expressing the respective TBK1 variants, treated with CCCP or vehicle, and enriched for mitochondria (Left) or cytosol (Right). Quantification was carried out on Mito fractions to compare association of the respective TBK1 variants and Parkin with mitochondria. Numbers to the left of blots indicate kDa. (D) Quantification of C with Parkin (Top) and TBK1 (Bottom) bands normalized to TOM20 and compared to average level of WT-TBK1–expressing cells treated with CCCP (dotted line). *P ≤ 0.05, **P < 0.01 by ordinary one-way ANOVA with Dunnett’s multiple comparisons test. Error bars indicate SEM. n = 3 independent experiments.
Fig. 5.
Fig. 5.
ALS-linked TBK1 mutants suppress OPTN phosphorylation. (AE) Maximum intensity projection images of HeLa cells depleted of endogenous TBK1 and expressing Parkin (not tagged), OPTN (blue), and WT- (A), G217R- (B), R357Q- (C), M559R- (D), or D135N- (E) TBK1 variants (magenta), fixed after treatment with CCCP for 90 min. Phospho-S177 OPTN is tagged with an antibody (green). In B, one ring is positive for phospho-OPTN and TBK1 (arrowhead), and the others are negative for both (arrows). (Scale bars: zoom out, 10 μm; zoom in, 2 μm.) Images shown are insets; for representative images of whole fields, reference SI Appendix, Fig. S6A. (F) For each cell, the percentage of OPTN rings in each category was calculated. Error bars indicate SD. n = 8 to 15 cells from at least three independent experiments. *P ≤ 0.05, **P < 0.01, ****P < 0.0001 by ordinary one-way ANOVA with Dunnett’s multiple comparisons test.
Fig. 6.
Fig. 6.
ULK1 contributes to OPTN phosphorylation independent of TBK1 kinase activity. (A) Maximum intensity projection images of HeLa cells depleted of endogenous TBK1 and expressing Parkin (not tagged) and OPTN (blue). Phospho-S177-OPTN was labeled with an antibody (green). In the Top Row, cells were not rescued with exogenous TBK1; magenta channel shows fluorescent ligand alone. In the Middle and Bottom Rows cells were rescued with WT- and D135N-TBK1, respectively (magenta). Half of each set was treated with the ULK1 complex inhibitor ULK-101 (Right Column) and all were fixed after treatment with CCCP for 90 min. (Scale bars, 8 μm.) (B and C) Whole-cell average intensities of TBK1 (B) or pOPTN (C) signal after background subtraction was measured for each condition. Bars indicate medians. n = 8 to 15 cells from at least three independent experiments. n.s., not significant (n.s. where not specified), *P ≤ 0.05, **P < 0.01, ****P < 0.0001 by two-way ANOVA with multiple comparisons.
Fig. 7.
Fig. 7.
TBK1 recruitment and phosphorylation of OPTN are both necessary for efficient mitochondrial engulfment by the LC3-positive autophagosome. (A) Representative confocal images of fixed HeLa cells depleted of endogenous TBK1 and expressing Parkin (not tagged), a fluorescent mitochondrial marker (blue), LC3 (green), and TBK1 (respectively indicated above each column), fixed after treatment with CCCP for 90 min. (Scale bar, 3 μm.) (B) Percent of LC3-positive mitochondria in cells expressing the respective TBK1 mutants. n = 5 to 15 cells from at least three independent experiments. ***P < 0.001, ****P < 0.0001 by ordinary one-way ANOVA with Dunnett’s multiple comparisons test. Error bars indicate SEM. (C and D) Representative confocal images of fixed HeLa cells depleted of endogenous TBK1 and expressing Parkin (not tagged), a fluorescent mitochondrial marker (blue), WT- (C) or M559R- (D) TBK1 (magenta), and LC3 (green) fixed after treatment with CCCP for 90 min. Insets (colored boxes and zoom panels) display examples of mitophagy events. The adjacent traces (Right) display quantification of relative signal intensity of each channel over a line scan (white dashed lines) across the diameter of the rounded mitochondria. (Scale bars: zoom out, 10 μm; zoom in, 2 μm.) Images shown in A, C, and D are insets; for representative images of whole fields, reference SI Appendix, Fig. S7.
Fig. 8.
Fig. 8.
Expression of ALS-associated TBK1 mutants alters mitochondrial network health and sensitivity to oxidative stress, and a model for the deleterious effects of TBK1 mutations in mitophagy. (A and B) Representative images (A) and quantification (B) of TMRE fluorescence intensity. Control basal conditions, Ctrl. Mean ± SEM; n = 30 to 42 neurons from three to four biological replicates; 7 days in vitro (DIV). Not significant, n.s.; *P ≤ 0.05, ***P < 0.001 by one-way ANOVA with Sidak’s multiple comparisons test. (Scale bar, 5 μm.) (C) Quantification of mitochondrial content by volume. Mean ± SEM; n = 30 to 42 neurons from three to four biological replicates; 7 DIV. Not significant, n.s., by Kruskal–Wallis ANOVA with Dunn’s multiple comparisons test. (D) Quantification of mitochondrial AR for all mitochondria observed. Mean ± SEM; n = 30 to 42 neurons from three to four biological replicates; 7 DIV. *P ≤ 0.05, ***P < 0.001, ****P < 0.0001 by one-way ANOVA with Dunnett’s multiple comparisons test. (E) Percent of mitochondria with a mitochondrial AR 2. Mean ± SEM; n = 30 to 42 neurons from three to four biological replicates; 7 DIV. Not significant, n.s.; *P ≤ 0.05 by one-way ANOVA with Sidak’s multiple comparisons test. (F) Representative images of Parkin-positive mitochondria with examples that are TBK1 positive (WT and R357Q) and TBK1 negative (M559R). (Scale bar, 1 μm.) (G and H) Quantification of the percent of neurons with Parkin-positive (G) or TBK1-positive (H) mitochondria rings. Mean ± SEM; n = 25 to 32 neurons from three biological replicates; 7 DIV. Not significant, n.s.; **P < 0.01 by one-way ANOVA with Sidak’s multiple comparisons test. (I) Quantification of the number of Parkin-positive mitochondria (total) that are TBK1 positive (black sector) or TBK1 negative (gray sector). n = 25 to 32 neurons from three biological replicates; total number of events are shown; 7 DIV. (J) Model for TBK1 involvement in mitophagy and effects of mutants. i) Upon mitochondrial depolarization, Parkin (blue circles) is recruited to the OMM and ubiquitinates (gold spheres) outer membrane proteins. In neurons, expression of R357Q- or M559R-TBK1 induces more rounded, Parkin-positive mitochondria. ii) Ubiquitin chains recruit OPTN (purple circles), which interact with ubiquitin via their UBAN domains. TBK1 is not required for this interaction. iii) TBK1 (multicolored cartoon) monomers constitutively dimerize along their scaffolding dimerization domains. Five mutations disrupt this dimerization, including R357Q-TBK1 and M559R-TBK1, which have completely disrupted dimerization. iv) TBK1 associates with OPTN at its CTD, thus TBK1 may be corecruited with OPTN to the mitophagy site. Three ALS-linked mutations in TBK1 exhibit disrupted OPTN association, yet Y105C-TBK1 and R308Q-TBK1 can still be recruited to the damaged mitochondria; thus TBK1 can also be independently recruited. v) Formation of TBK1 multimers at the mitochondria surface promotes TBK1 transautophosphorylation, by which TBK1 is activated upon phosphorylation at S172 (purple circles with “P”). Four ALS-linked TBK1 mutants and the engineered D135N-TBK1 have diminished or abolished activation. vi) Activated TBK1 phosphorylates the mitophagy receptor OPTN at S177. Activated TBK1 may also promote autophagosomal membrane expansion (tan crescent). vii) Phosphorylated OPTN is necessary to recruit the LC3-coated (dark green circles) autophagosome. viii) The double membrane autophagosome completely engulfs a damaged mitochondria.

Similar articles

Cited by

References

    1. Cirulli E. T., et al. ., Exome sequencing in amyotrophic lateral sclerosis identifies risk genes and pathways. Science 347, 1436–1441 (2015). - PMC - PubMed
    1. Brenner D., et al. ., Hot-spot KIF5A mutations cause familial ALS. Brain 141, 688–697 (2018). - PMC - PubMed
    1. Freischmidt A., et al. ., Haploinsufficiency of TBK1 causes familial ALS and fronto-temporal dementia. Nat. Neurosci. 18, 631–636 (2015). - PubMed
    1. Freischmidt A., Müller K., Ludolph A. C., Weishaupt J. H., Andersen P. M., Association of mutations in TBK1 with sporadic and familial amyotrophic lateral sclerosis and frontotemporal dementia. JAMA Neurol. 74, 110–113 (2017). - PubMed
    1. van Rheenen W.et al. .; PARALS Registry; SLALOM Group; SLAP Registry; FALS Sequencing Consortium; SLAGEN Consortium; NNIPPS Study Group , Genome-wide association analyses identify new risk variants and the genetic architecture of amyotrophic lateral sclerosis. Nat. Genet. 48, 1043–1048 (2016). - PMC - PubMed

Publication types

MeSH terms

Substances

LinkOut - more resources