. 2021 Jun 15;118(24):e2103240118.
doi: 10.1073/pnas.2103240118.

Single-cell analyses of renal cell cancers reveal insights into tumor microenvironment, cell of origin, and therapy response

Affiliations

Single-cell analyses of renal cell cancers reveal insights into tumor microenvironment, cell of origin, and therapy response

Yuping Zhang et al. Proc Natl Acad Sci U S A. .

Abstract

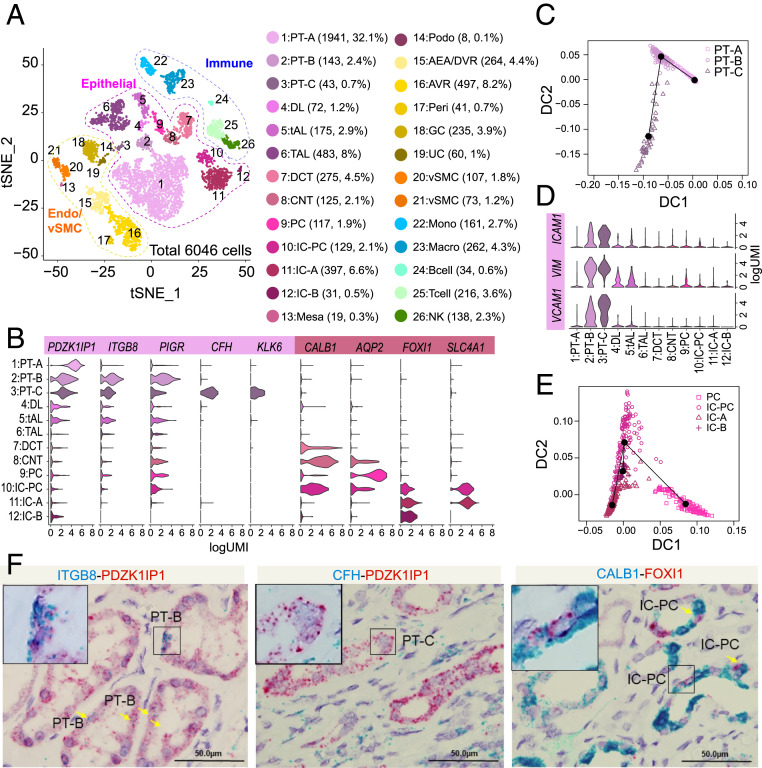
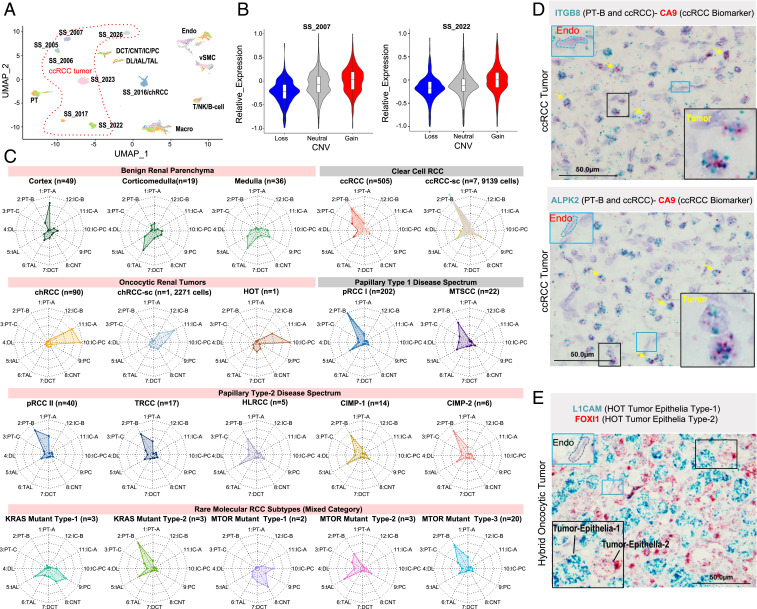
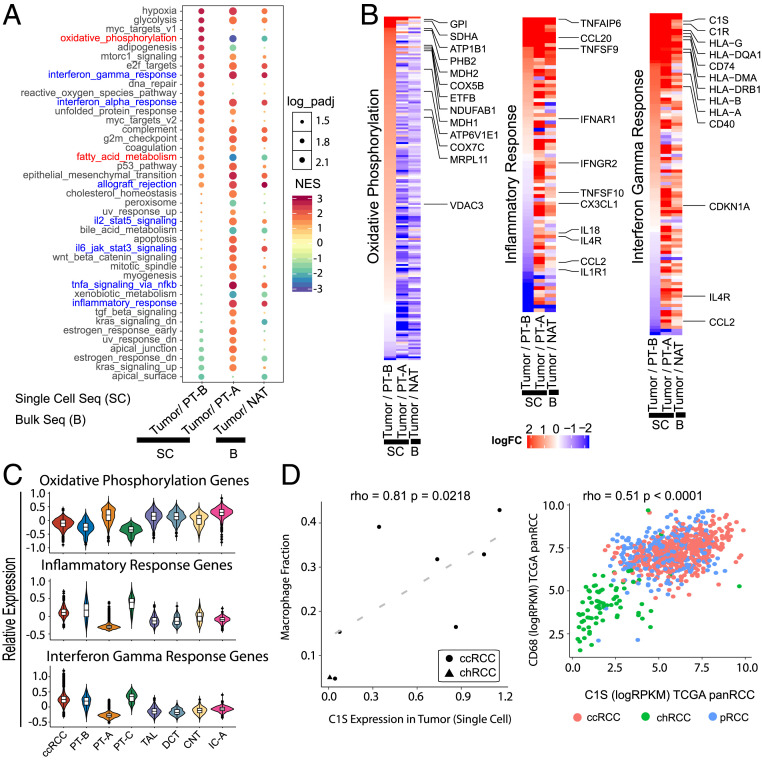
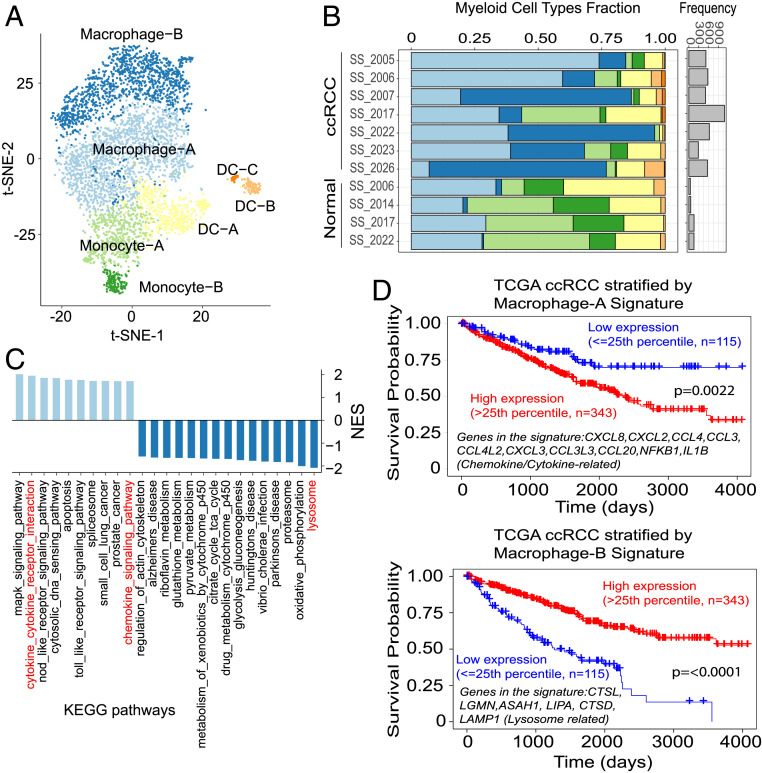
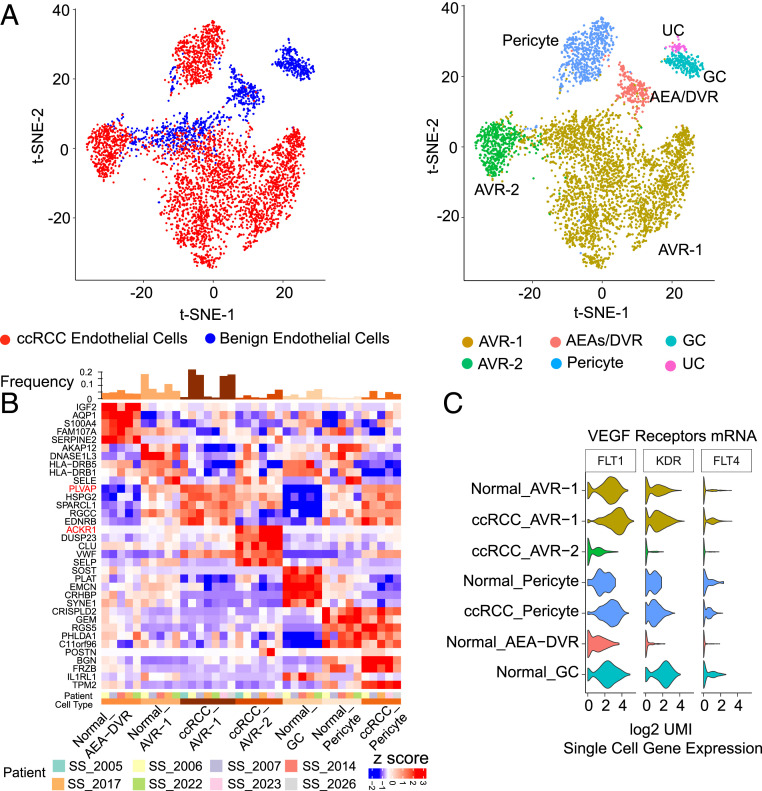
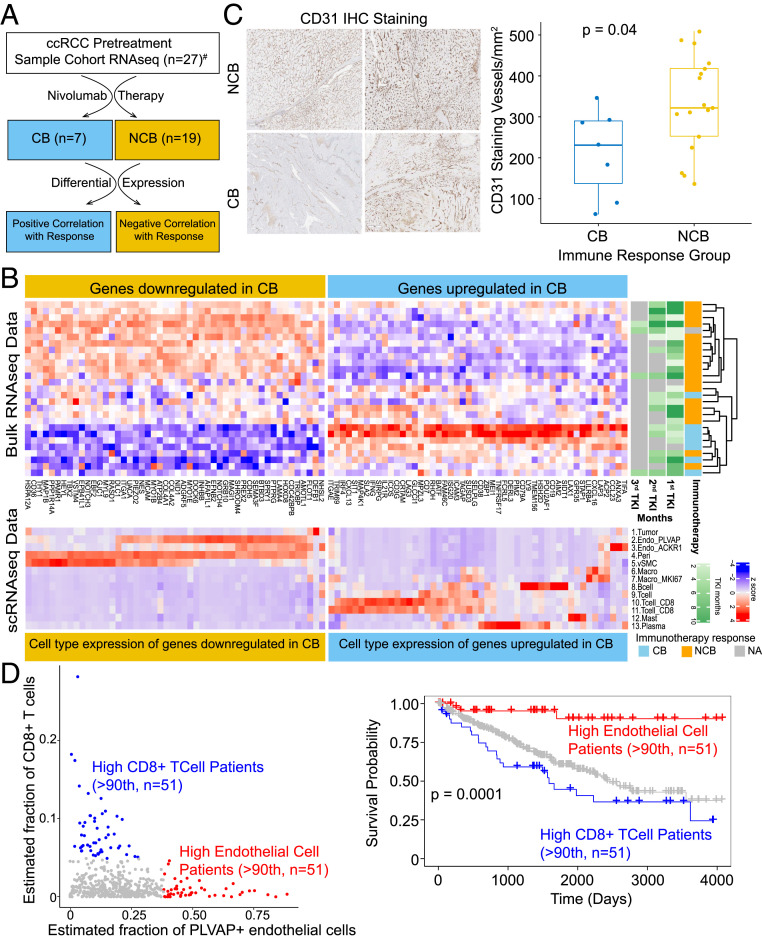
Diverse subtypes of renal cell carcinomas (RCCs) display a wide spectrum of histomorphologies, proteogenomic alterations, immune cell infiltration patterns, and clinical behavior. Delineating the cells of origin for different RCC subtypes will provide mechanistic insights into their diverse pathobiology. Here, we employed single-cell RNA sequencing (scRNA-seq) to develop benign and malignant renal cell atlases. Using a random forest model trained on this cell atlas, we predicted the putative cell of origin for more than 10 RCC subtypes. scRNA-seq also revealed several attributes of the tumor microenvironment in the most common subtype of kidney cancer, clear cell RCC (ccRCC). We elucidated an active role for tumor epithelia in promoting immune cell infiltration, potentially explaining why ccRCC responds to immune checkpoint inhibitors, despite having a low neoantigen burden. In addition, we characterized an association between high endothelial cell types and lack of response to immunotherapy in ccRCC. Taken together, these single-cell analyses of benign kidney and RCC provide insight into the putative cell of origin for RCC subtypes and highlight the important role of the tumor microenvironment in influencing ccRCC biology and response to therapy.

Keywords: cell of origin; clear cell renal cell carcinoma; renal cell carcinoma; single-cell RNA sequencing; tumor microenvironment.


Conflict of interest statement

Competing interest statement: A.A. and P.M. are coauthors on an article [S. M. Esagian et al. BJU International, 10.1111/bju.15324 (2021)].

Figures

Fig. 1.
Fig. 1.
Single-cell analysis of benign human kidney reveals novel nephron tubular epithelial cell types. (A) Single-cell atlas of human kidney. t-SNE plot of scRNA-seq data from 6,046 cells obtained from six benign kidney samples. Cell clusters found therein representing 26 cell types are shown. DL, descending limb; DCT, distal convoluted tubule; CNT, connecting duct; Mesa, mesangial cells; Podo, podocytes; Peri, pericytes; vSMC, vascular smooth muscle cells; Mono, monocytes; Macro, macrophages; NK, natural killer cells. (B) Violin plots depicting gene expression patterns of select cell type markers: PDZK1IP1 (all PT cells), ITGB8 (PT-B and -C), PIGR (PT-B and -C), CFH (PT-C), KLK6 (PT-C), CALB1 (IC-PC, CNT), AQP2 (PC), FOXI1 (IC-PC, IC-A, IC-B), and SLC4A1 (IC-PC, IC-A). (C) Trajectory analysis of the three PT cell clusters identified: the common PT-A and rare/novel PT-B and PT-C. (D) As in B except showing stem/progenitor cell markers (VCAM1, VIM, ICAM1) across different cell types. (E) Trajectory analysis of distal tubule IC, PC, and IC-PC populations. (F) Validation of PT-B, PT-C, and IC-PC cells in benign adjacent kidney by RNA-ISH dual staining. PT-B marker ITGB8 (Left) and PT-C marker CFH (Middle) in blue channel and pan-PT cell marker PDZK1IP1 in red channel. IC-PC marker CALB1 in blue channel and IC marker FOXI1 in red channel (Right). (Scale bars for all images, 50 μm.)
Fig. 2.
Fig. 2.
Cell of origin predictions for RCCs. (A) Impact of patient-specific CNV on tumor epithelial cell gene expression. UMAP plot of cell types captured from seven different ccRCC samples, where tumor epithelial cells clustered according to patient, while nontumor cells from different patients clustered according to cell types. (B) Individual examples reemphasize the association between genome-wide CNV gains and losses and single-cell gene expression patterns in the tumor epithelia. (C) Delineation of the P-CO for various RCCs. The “radar” plots indicate the probabilities based on a random forest classifier of a given query gene expression dataset (single-cell data from tumor epithelia of RCCs or bulk data from benign renal tissues, different anatomic locations, and tumors) to resemble a given benign epithelial cell type (periphery), as depicted by the spokes/radii. The predicted closest normal cell types for the various tumor tissues analyzed include the following. (Row 1) benign: bulk renal cortex, bulk cortico-medullary, bulk medullary; ccRCC tumors: bulk ccRCC, single-cell ccRCC; (row 2) oncocytic renal tumors: bulk chRCC, single-cell chRCC, HOT; papillary type-1 tumors: bulk pRCC type-1, bulk MTSCC; (row 3) papillary type-2 tumors: bulk pRCC type-2, TRCC, HLRCC, CIMP (-1, -2); (row 4) rare molecular subtypes: KRAS-mutant types 1 and 2 and MTOR-mutant types 1 to 3. (D) Lineage-specific marker validation by RNA-ISH dual staining. ITGB8 expression (blue) validates PT-B as P-CO for ccRCC (Top). CA9 (red) is a general biomarker of ccRCC. As in Top, except using ALPK2 as a second PT-B marker (Bottom). (E) Mutual exclusivity observed in FOXI1 and L1CAM dual stains reveals the distinct identity of two tumor epithelial cell types in a HOT. (Scale bar, 50 μm.)
Fig. 3.
Fig. 3.
ccRCC tumor epithelial cells actively promote immune infiltration. (A) Pathway enrichments identified by GSEA of single-cell (SC) data for ccRCC tumor epithelial cells vs. the P-CO PT-B cells (first column) or the common PT-A cell population (second column). The tumor epithelia vs. P-CO showed fewer concepts, as compared with tumor epithelia vs. PT-A. Results from bulk RNA-seq (B) data for tumor vs. benign NAT is displayed alongside (third column). Concept names in red show reversal in patterns based on reference used. All immune/inflammation-related concepts are in blue. (B) Expression pattern of genes that constitute the “Hallmark Oxidative Phosphorylation” (Left), “Hallmark Inflammatory Response” (Middle), and “Hallmark Interferon Gamma Response” (Right) concepts from A. Columns within each subpanel (left to right) show the fold-change ratios in tumor vs. PT-B, tumor vs. PT-A, or bulk tumor vs. bulk NAT analysis, respectively. (C) Violin plots representing average of absolute gene expression values of all genes that constitute the three concepts across the tumor epithelia and various normal cell types. (D) C1S expression in tumor epithelia is associated with macrophage infiltration as represented by scatter plots based on both scRNA-seq (Left) and TCGA pan-RCC bulk RNA-seq (Right).
Fig. 4.
Fig. 4.
Myeloid cell types detected through single-cell analyses of ccRCC and their associations with survival. (A) t-SNE plot depicts the seven major myeloid lineage cell types captured by scRNA-seq: macrophages-A and -B, monocytes-A and -B, and dendritic cells (DC)-A, -B, and -C. (B) Stacked bar plot shows samplewise frequency/composition of the myeloid cell types. Myeloid cell numbers in general are much higher in tumors compared with adjacent normal tissues (bar plot, Right). Macrophage-B population is enriched in tumors compared with normal. (C) Significantly enriched KEGG pathways (FDR < 0.05) in macrophage-B vs. macrophage-A population comparison. Light blue bars: positively enriched in macrophage-A; dark blue bars: positively enriched in macrophage-B. (D) Survival plots (TCGA-ccRCC bulk RNA-seq data) based on signature genes that are differentially expressed between macrophage-A and macrophage-B populations.
Fig. 5.
Fig. 5.
Endothelial cell types in ccRCC. (A, Left) t-SNE plot of the endothelial cell types in benign adjacent kidney and ccRCC samples. (A, Right) t-SNE plot showing the diversity in endothelial cell type in benign adjacent kidney and ccRCC tumor tissues. The predominant endothelial population in tumors was AVR-1, followed by AVR-2. (B) Heat map depicting the top markers associated with the different endothelial subtypes. PLVAP, a marker of the AVR-1 population, and ACKR1, a marker of the AVR-2 population, are highlighted in red. (C) Messenger RNA expression of VEGF receptors FLT1, KDR, and FLT4 shows low expression in ACKR1-positive ccRCC AVR-2 population (violin plots).
Fig. 6.
Fig. 6.
Endothelial cell content informs response to immunotherapy and survival in ccRCC patients. (A) Schematic workflow of the integrative analysis; CB, clinical benefit (patients with complete or partial response); NCB, no clinical benefit (patients with progressive disease or stable disease); #response information not available for one patient. (B, Top) Heat map of up- and down-regulated genes associated with treatment response. Tyrosine kinase inhibitor (TKI) treatment durations prior to immunotherapy are provided in the TKI annotation tracks on the right, and immunotherapy response category is shown next to that. NA, immunotherapy response information not available for one patient. (B, Bottom) Expression of response-associated genes among the various cell types identified by scRNA-seq. Genes down-regulated in CB category are mostly expressed among the endothelial cell types (yellow box), while genes up-regulated in CB (blue box) are predominantly expressed in immune cell compartments. (C) CD31/PECAM1 immunohistochemistry, representative images (Left) and quantitation (Right). (D) Scatter plot (Left) shows the mutual exclusivity of outlier samples with high estimated fraction of CD8+ T cells (blue dots) and patients with high estimated endothelial cells (red dots) in TCGA ccRCC bulk RNA-seq data. Kaplan–Meier plot shows the survival probability between the two groups. Patients with high endothelial cell fraction showed significant difference (P = 0.0001) in survival outcome compared with patients enriched with CD8+ T cells.

Similar articles

Cited by

References

    1. Udager A. M., Mehra R., Morphologic, molecular, and taxonomic evolution of renal cell carcinoma: A conceptual perspective with emphasis on updates to the 2016 World Health Organization classification. Arch. Pathol. Lab. Med. 140, 1026–1037 (2016). - PubMed
    1. Clark D. J.et al. .; Clinical Proteomic Tumor Analysis Consortium , Integrated proteogenomic characterization of clear cell renal cell carcinoma. Cell 179, 964–983.e31 (2019). - PMC - PubMed
    1. Davis C. F.et al. .; The Cancer Genome Atlas Research Network , The somatic genomic landscape of chromophobe renal cell carcinoma. Cancer Cell 26, 319–330 (2014). - PMC - PubMed
    1. Lindgren D., et al. ., Cell-type-specific gene programs of the normal human nephron define kidney cancer subtypes. Cell Rep. 20, 1476–1489 (2017). - PubMed
    1. Prasad S. R., et al. ., Segmental disorders of the nephron: Histopathological and imaging perspective. Br. J. Radiol. 80, 593–602 (2007). - PubMed

Publication types