. 2021 Jun 15;118(24):e2020078118.
doi: 10.1073/pnas.2020078118.

Antipsychotic drugs counteract autophagy and mitophagy in multiple sclerosis

Affiliations

Antipsychotic drugs counteract autophagy and mitophagy in multiple sclerosis

Simone Patergnani et al. Proc Natl Acad Sci U S A. .

Abstract

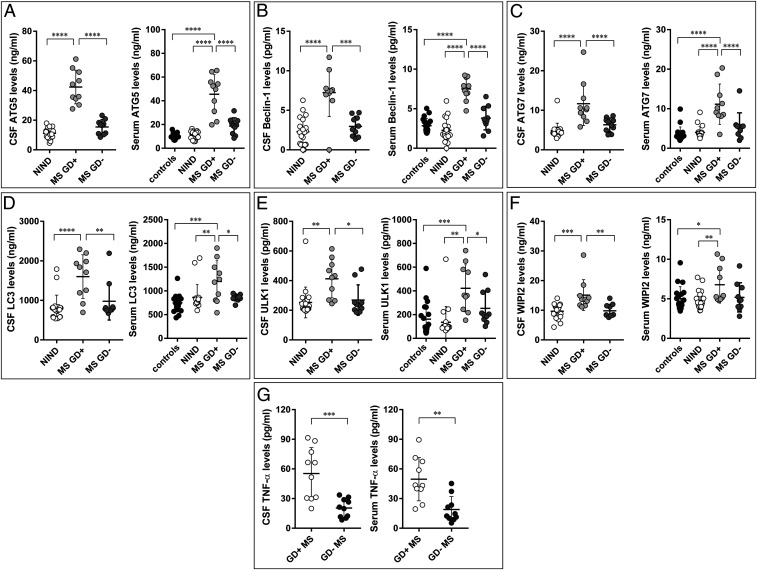
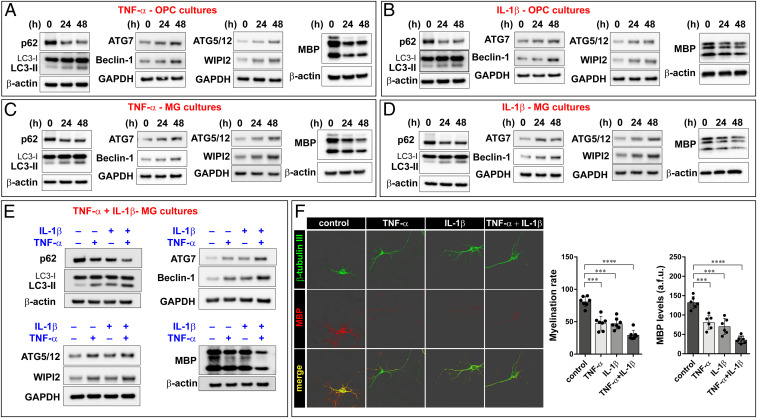
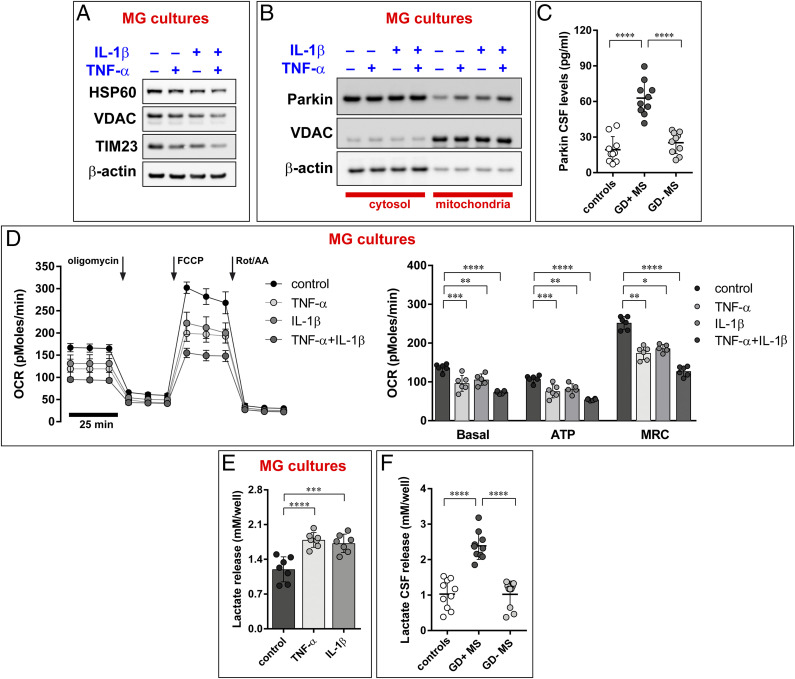
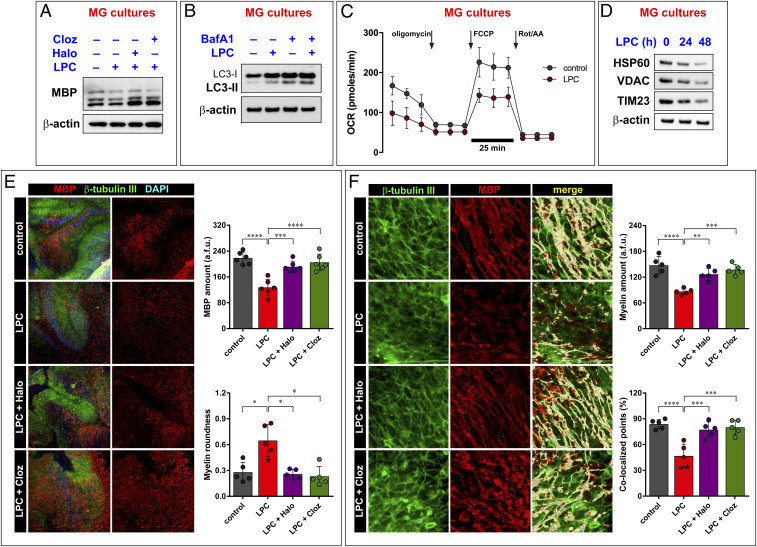
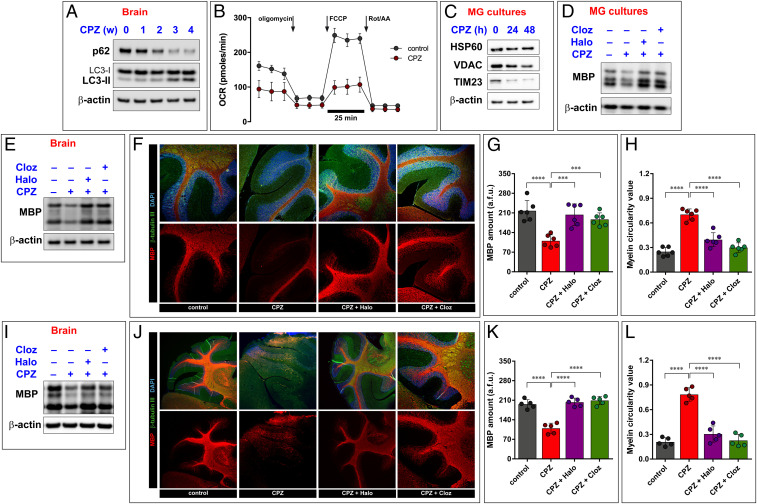
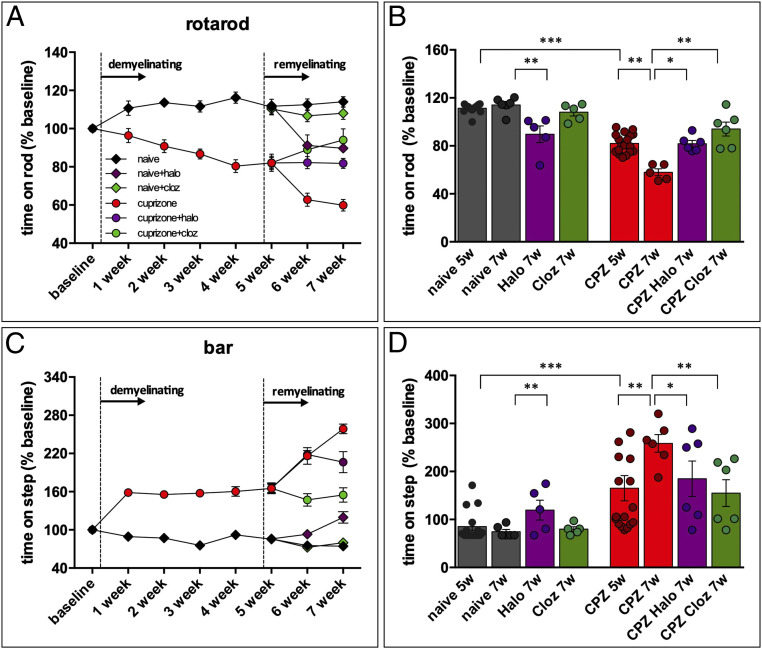
Multiple sclerosis (MS) is a neuroinflammatory and neurodegenerative disease characterized by myelin damage followed by axonal and ultimately neuronal loss. The etiology and physiopathology of MS are still elusive, and no fully effective therapy is yet available. We investigated the role in MS of autophagy (physiologically, a controlled intracellular pathway regulating the degradation of cellular components) and of mitophagy (a specific form of autophagy that removes dysfunctional mitochondria). We found that the levels of autophagy and mitophagy markers are significantly increased in the biofluids of MS patients during the active phase of the disease, indicating activation of these processes. In keeping with this idea, in vitro and in vivo MS models (induced by proinflammatory cytokines, lysolecithin, and cuprizone) are associated with strongly impaired mitochondrial activity, inducing a lactic acid metabolism and prompting an increase in the autophagic flux and in mitophagy. Multiple structurally and mechanistically unrelated inhibitors of autophagy improved myelin production and normalized axonal myelination, and two such inhibitors, the widely used antipsychotic drugs haloperidol and clozapine, also significantly improved cuprizone-induced motor impairment. These data suggest that autophagy has a causal role in MS; its inhibition strongly attenuates behavioral signs in an experimental model of the disease. Therefore, haloperidol and clozapine may represent additional therapeutic tools against MS.

Keywords: antipsychotic drugs; autophagy; mitochondria; multiple sclerosis; remyelination.


Conflict of interest statement

The authors declare no competing interest.

Figures

Fig. 1.
Fig. 1.
CSF and serum levels of autophagic elements. ATG5 (A), Beclin-1 (B), ATG7 (C), LC3 (D), ULK1 (E) WIPI2 (F), and TNF-α (G) levels in CSF and serum of patients with no inflammatory neurological diseases (NIND), healthy individuals (controls), and MS patients grouped according to MRI disease activity. MS Gd+: MRI-active MS; MS Gd-: MRI-inactive MS. Each point represents a single observation, including outliers. ****P < 0.0001, ***P < 0.001, **P < 0.01, *P < 0.05.
Fig. 2.
Fig. 2.
TNF-α and IL-1-β boost autophagy and provoke demyelination in vitro MS models. Proinflammatory cytokines TNF-α (A) and IL-1-β (B) cause activation of autophagy in OPC cultures, as denoted by increases in LC3-II, ATG7, Beclin-1, ATG5/12, and WIPI2 and reduction in p62 protein levels. Cytokines exposure is also associated with decreased MBP levels. (C and D) Similar results were obtained in MG cell cultures. (E) The concurrent use of both TNF-α and IL-1-β determines increased activation of autophagy and higher demyelination than the single treatments in MG cultures. Immunoblots are representative of at least three independent experiments. Quantification of the Western blot performed is reported in SI Appendix, Table S1. Notably, the primary antibody against ATG5 also detect the ATG12-ATG5 conjugated form. (F) Fluorescence microscopy analysis of the axonal marker β-tubulin III and myelin marker MBP reveals that proinflammatory cytokines provoke a reduction in myelination capacity. Representative three-dimensional images are shown. All data presented are the mean ± SD of at least three separated experiments; two-way ANOVA with Dunnett’s multiple comparison test, ****P < 0.0001, ***P < 0.001.
Fig. 3.
Fig. 3.
TNF-α and IL-1-β increase mitophagic events with consequent loss of mitochondrial functioning. (A) Proinflammatory cytokines prompt activation of mitophagic process, as indicated by a reduction in mitochondrial proteins. HSP60, VDAC, and TIM23 were used as markers of mitochondrial matrix, outer and inner membrane, respectively. (B) Parkin recruitment into mitochondria, analyzed after subcellular fractionation of MG cultures pretreated with TNF-α and IL-1-β. Immunoblots are representative of at least three independent experiments. Quantification of the Western blot performed is reported in SI Appendix, Table S1. (C) CSF Parkin levels in the CSF of control, MS patients in active phase, and MS patients in remission phase. The groups are different according to ANOVA (P < 0.0001): Gd+ MS > Gd− MS (Tukey’s test: P < 0.0001); Gd+ MS > Controls (Tukey’s test: P < 0.0001). (D) Mitochondrial respiration in MG cultures pretreated with TNF-α and IL-1-β was assessed by using the Seahorse Mito Stress test with oligomycin (ATP synthase inhibitor), FCCP (mitochondrial uncoupler), and a mix of rotenone and Rot/AA (specific inhibitors for the ETC complex I and III, respectively). The arrows indicate time of drug injection. The graphs depict the mean ± SD of at least n = 5 experiments; two-way ANOVA with Dunnett’s multiple comparison test, *P < 0.01. Calculated parameters shown are as follows: Basal rate (Basal) was calculated by the equation (OCR before addition of oligomycin − OCR after addition of Rot/AA). ATP production (ATP) was indicated as OCR before addition of oligomycin − OCR after addition of FCCP. Maximal rate was calculated as the highest OCR after addition of FCCP subtracted from the OCR after addition of Rot/AA. The groups are different according to two-way ANOVA with Dunnett’s multiple comparison test ****P < 0.0001, ***P < 0.001, and **P < 0.01. (E) Lactate release in media collected from MG cultures (the data are the mean ± SD of at least three independent experiments. Two-way ANOVA with Dunnett’s multiple comparison test, ****P < 0.0001, ***P < 0.001. (F) Lactate release in in the CSF of control, MS patients in active phase and MS patients in remission phase. The groups are different according to ANOVA (P < 0.0001): Gd+ MS > Gd− MS (Tukey’s test: P < 0.0001); Gd+ MS > Controls (Tukey’s test: P < 0.0001).
Fig. 4.
Fig. 4.
Modulation of autophagy increases myelin production in vitro. Immunoblots showing the ability of autophagy inhibitor compound CC (2.5 µM) to inhibit autophagy without affecting the normal autophagic flux (A) and to restore normal myelin levels following treatment with TNF-α or IL-1-β, either alone or in combination (B). Early-stage autophagy inhibitor 3-MA (2.5 µM) reduces autophagic activities, as suggested by a decrease in LC3-II levels (C) and reverts TNFα- or IL-1-β–mediated loss of myelin (D). Genetic interference on the essential autophagic gene ATG7 decreases the autophagosomal formation (E) and restores the myelin loss provoked by proinflammatory cytokines (F). The late-stage inhibitor CQ blocks autophagy by interfering with LC3-II degradation. At demonstration of this, the vacuolar H+-ATPase inhibitor BafA1 that inhibits the autophagosome–lysosome fusion does not increase LC3-II levels than the CQ (1 µM) treatment alone (G). Interestingly, clozapine (Cloz) and haloperidol (Halo) 1 µM exert the same effect as CQ (H and I). Clozapine and haloperidol (like the late-stage autophagy inhibitor CQ) also revert TNFα- or IL-1-β–mediated loss of myelin (JL). All experiments are performed in MG cultures. Immunoblots are representative of at least three independent experiments. Quantification of the Western blot performed is reported in SI Appendix, Table S1.
Fig. 5.
Fig. 5.
Haloperidol and Clozapine revert demyelination events in ex vivo MS model. The demyelinating agent LPC causes MBP loss in MG cultures (A). This feature is abolished by cotreating cells with the autophagy inhibitors haloperidol (Halo) and clozapine (Cloz). Similar to proinflammatory cytokines, LPC boosts autophagy (B), causes mitochondrial function impairment (C), and activates mitochondrial autophagy (D). Calculated values of the Seahorse assay are reported in SI Appendix, Fig. S5. (E) Ex vivo analysis performed in OSC confirms the ability of the antipsychotic agents Halo and Cloz to improve myelinization following LPC treatment. (F) Fluorescence shape (myelin roundness) and colocalization between MBP (red) and the neuronal marker β-tubulin III (green). Immunoblots are representative of at least three independent experiments. Quantification of the Western blot performed is reported in SI Appendix, Table S1. The graphs in C, E, and F represent the mean ± SD of five experiments; two-way ANOVA with Dunnett’s multiple comparison test, ****P < 0.0001, ***P < 0.001, **P < 0.01.
Fig. 6.
Fig. 6.
Antipsychotic drugs improve myelination in a mouse model of demyelination. CPZ administration causes activation of autophagy in brains of mice treated for 4 wk, as shown by a progressive increase in the lipidated form of LC3 (LC3-II) and a parallel decrease of p62. This event also excludes that CPZ may interfere with the correct execution of the autophagic flux (A). CPZ also provokes loss of mitochondrial functioning and activation of mitophagy, as denoted by Seahorse assay (B) and immunoblot for mitochondrial proteins (C). Calculated values for Seahorse assay are shown in SI Appendix, Fig. S6C. As a result of these effects, CPZ causes loss of MBP both in in MG cultures (D) and in brain homogenates (E). Before starting CPZ administration, mice were treated with haloperidol (Halo) and clozapine (Cloz). These drugs demonstrated to be efficacious in preventing the CPZ-dependent loss of myelin, as shown by immunoblot (E) and immunohistochemistry (F) performed in cerebellar slices. The graphs indicate the myelin levels (G) and linearity (H) detected in the cerebellar slices obtained from CPZ-treated mice. Antipsychotic compounds not only prevent the demyelination induced by CPZ but also improve the remyelination process. In this case, haloperidol and clozapine were administered after the 5-wk CPZ period. Remyelination events have been assessed by immunoblot of brain homogenates (I) and by immunohistochemistry of cerebellar slices (J). Relative quantifications of myelin amount (K) and linearity (L) are shown. All Immunoblots are representative of at least three independent experiments, and their quantification is reported in SI Appendix, Table S1. Two-way ANOVA with Dunnett’s multiple comparison test, ****P < 0.0001, ***P < 0.001.
Fig. 7.
Fig. 7.
Haloperidol (Halo) and clozapine (Cloz) reverse motor deficit in the CPZ mouse model. Following a 5-wk CPZ treatment, Haloperidol (Halo) or Clozapine (Cloz) (0.5 mg/kg) were administered intraperitoneal twice per week for 2 wk. Motor activity was evaluated in the rotarod (A and B) and bar test (C and D). The dark gray diamonds and bars represent control animals; the red circles and bars represent CPZ-treated animals; the purple diamonds and bars are naïve animals treated with Halo; the purple circles and bars are CPZ animals treated with Halo; the green diamonds and bars are naïve animals treated with Cloz; the green circles and bars are CPZ animals treated with Cloz. The data are means ± SEM of eight determinations per group. *P < 0.05, **P < 0.01, two-way ANOVA for repeated measures followed by the Bonferroni test.

Comment in

  • Antipsychotics, versatility in action.
    Mahapatra S, Reis Marques T. Mahapatra S, et al. Proc Natl Acad Sci U S A. 2021 Jul 13;118(28):e2108946118. doi: 10.1073/pnas.2108946118. Proc Natl Acad Sci U S A. 2021. PMID: 34244436 Free PMC article. No abstract available.

References

    1. Patergnani S., et al. ., Mitochondria in multiple sclerosis: Molecular mechanisms of pathogenesis. Int. Rev. Cell Mol. Biol. 328, 49–103 (2017). - PubMed
    1. Thompson A. J., Baranzini S. E., Geurts J., Hemmer B., Ciccarelli O., Multiple sclerosis. Lancet 391, 1622–1636 (2018). - PubMed
    1. Sharief M. K., Hentges R., Association between tumor necrosis factor-alpha and disease progression in patients with multiple sclerosis. N. Engl. J. Med. 325, 467–472 (1991). - PubMed
    1. Palle P., Monaghan K. L., Milne S. M., Wan E. C. K., Cytokine signaling in multiple sclerosis and its therapeutic applications. Med. Sci. (Basel) 5, E0023 (2017). - PMC - PubMed
    1. Seppi D., et al. ., Cerebrospinal fluid IL-1β correlates with cortical pathology load in multiple sclerosis at clinical onset. J. Neuroimmunol. 270, 56–60 (2014). - PubMed

Publication types

MeSH terms