. 2021 Jul 16;27(8):946-958.
doi: 10.1261/rna.078776.121.

Ribosomal RNA degradation induced by the bacterial RNA polymerase inhibitor rifampicin

Affiliations

Ribosomal RNA degradation induced by the bacterial RNA polymerase inhibitor rifampicin

Lina Hamouche et al. RNA. .

Abstract

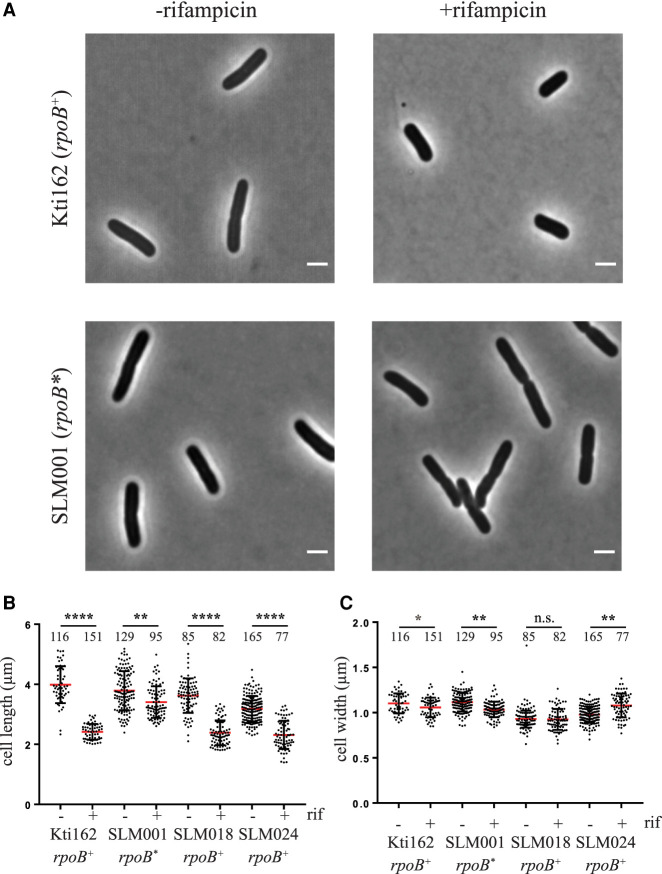
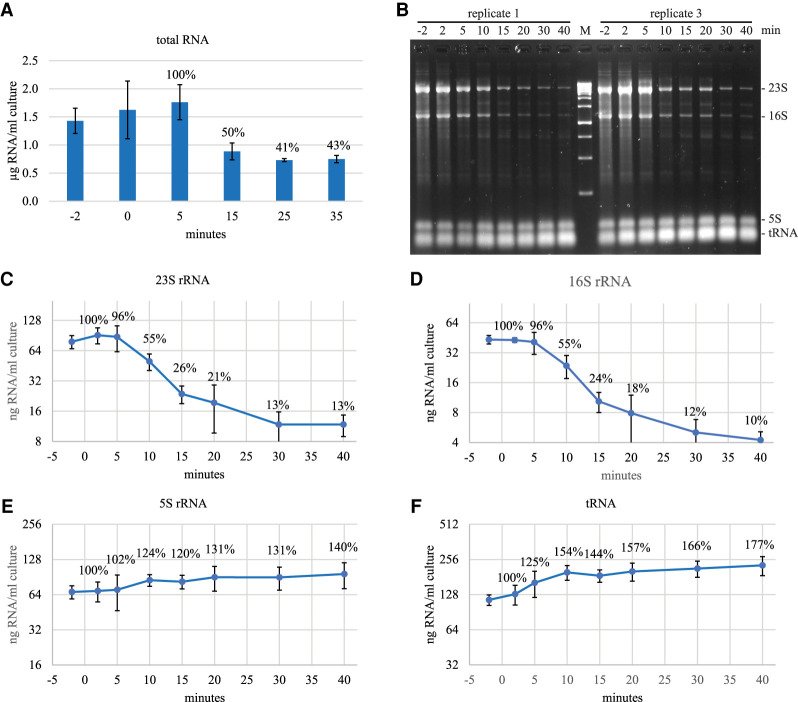
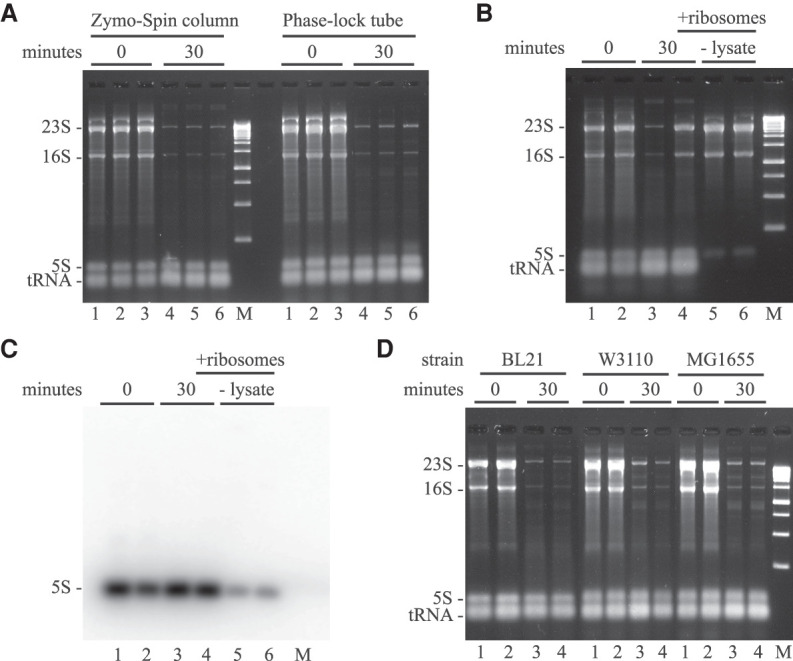
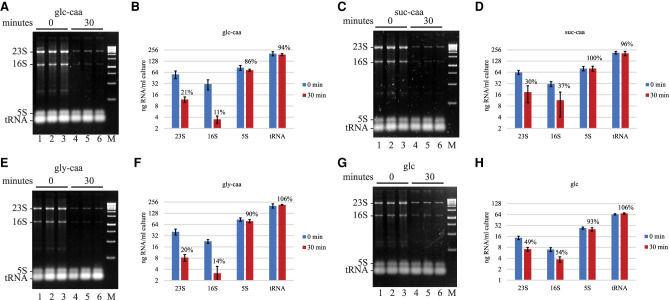
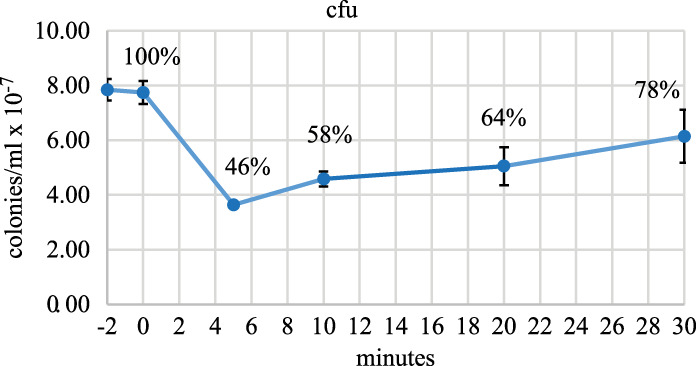
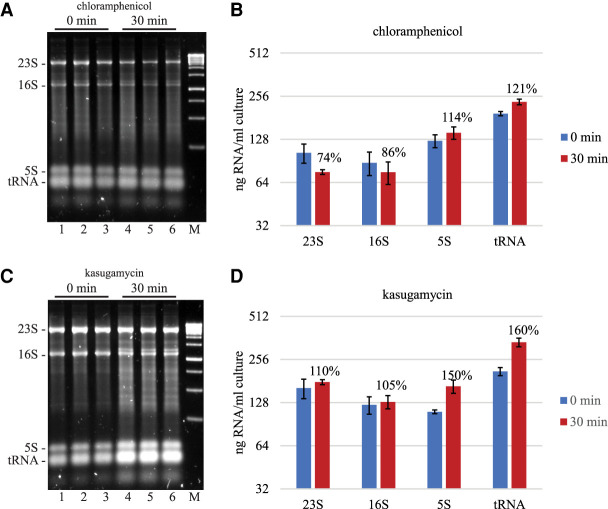
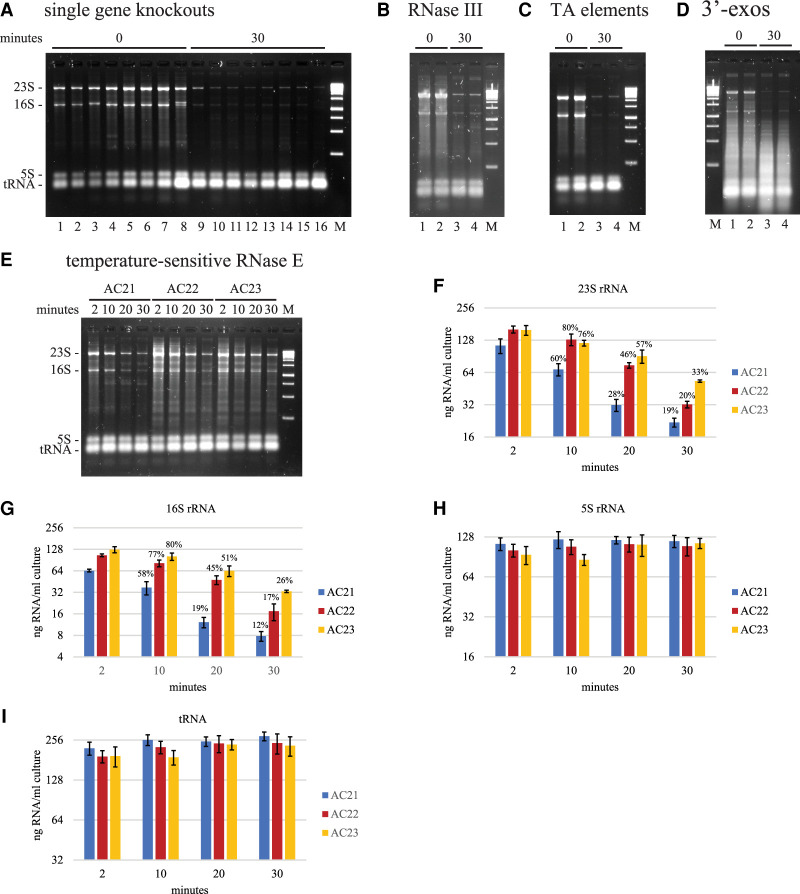
Rifampicin, a broad-spectrum antibiotic, inhibits bacterial RNA polymerase. Here we show that rifampicin treatment of Escherichia coli results in a 50% decrease in cell size due to a terminal cell division. This decrease is a consequence of inhibition of transcription as evidenced by an isogenic rifampicin-resistant strain. There is also a 50% decrease in total RNA due mostly to a 90% decrease in 23S and 16S rRNA levels. Control experiments showed this decrease is not an artifact of our RNA purification protocol and therefore due to degradation in vivo. Since chromosome replication continues after rifampicin treatment, ribonucleotides from rRNA degradation could be recycled for DNA synthesis. Rifampicin-induced rRNA degradation occurs under different growth conditions and in different strain backgrounds. However, rRNA degradation is never complete, thus permitting the reinitiation of growth after removal of rifampicin. The orderly shutdown of growth under conditions where the induction of stress genes is blocked by rifampicin is noteworthy. Inhibition of protein synthesis by chloramphenicol resulted in a partial decrease in 23S and 16S rRNA levels whereas kasugamycin treatment had no effect. Analysis of temperature-sensitive mutant strains implicate RNase E, PNPase, and RNase R in rifampicin-induced rRNA degradation. We cannot distinguish between a direct role for RNase E in rRNA degradation versus an indirect role involving a slowdown of mRNA degradation. Since mRNA and rRNA appear to be degraded by the same ribonucleases, competition by rRNA is likely to result in slower mRNA degradation rates in the presence of rifampicin than under normal growth conditions.

Keywords: PNPase; RNase E; RNase R; cell size; mRNA degradation; ribosomal RNA degradation; rifampicin.


Figures

FIGURE 1.
FIGURE 1.
Cell dimensions. The Kti162 strain expressing RNase E-mCherry, SLM018 strain expressing PNPase-msfGFP, SLM024 strain expressing RhlB-msfGFP, and the isogenic rifampicin resistant strain SLM001 were grown to OD600 = 0.5 in LB at 37°C. (A) Phase contrast images before and 30 min after adding rifampicin (150 µg/mL). The bar in the lower right corner of each micrograph indicates scale (2 µm). (B,C) Scatter plots of cell length (B) and width (C). Since the results of two independent experiments were the same, the data were pooled. The number of cells that were measured are indicated at the top of the distribution profile. Statistical significance of the difference between untreated and rifampicin treated cells was calculated using the nonparametric Mann–Whitney test: (****) P < 0.0001; (***) 0.0001 < P < 0.001; (**) 0.001 < P < 0.01; (*) 0.01 < P < 0.05; n.s. = P > 0.05.
FIGURE 2.
FIGURE 2.
RNA levels after rifampicin treatment. The Kti162 strain was grown in LB at 37°C to OD600 = 0.5 and then treated with rifampicin (150 µg/mL). (A) Total RNA. The 0 min time point was taken immediately after the addition of rifampicin. RNA was extracted from equal volumes of culture. Quantities are expressed as micrograms of RNA per mL of culture. The graph shows the average and standard deviation of three biological replicates. Percentages indicate levels relative to the 5 min time point. (B) RNA was fractionated on 2.4% agarose gels and then stained with SYBR Safe. A gel loaded with RNA from two biological replicates is shown. M = double-stranded DNA size markers. (CF) Levels of 23S, 16S and 5S rRNA, and tRNA after rifampicin addition were quantified from three biological replicates. Nominal amounts of RNA were determined using the fluorescence of known quantities of the 500 and 1500 bp double-stranded DNA size markers as standards. The graphs show the average and standard deviation expressed as nanograms of RNA per mL of culture. Percentages indicate levels relative to the 2 min time point.
FIGURE 3.
FIGURE 3.
Rifampicin-induced degradation of 23S and 16S rRNA in E. coli K12 and B strains. Total RNA extracted from equal volumes of culture was separated by agarose gel electrophoresis. In A, B, and D, the gels were imaged by SYBR Safe staining. M = DNA size markers. (A) RNA was extracted by cell lysis in TRIzol and purification with either a Zymo-Spin column kit or Phase-lock fractionation and precipitation with isopropanol. Lanes 13, RNA extraction immediately after the addition of rifampicin (biological replicates). Lanes 46, corresponding RNA extraction 30 min after the addition of rifampicin. (B) RNA was extracted by cell lysis in TRIzol and purification with a Zymo-Spin column kit. Lanes 1 and 2, RNA extraction immediately after the addition of rifampicin (biological replicates). Lanes 3 and 4, corresponding RNA extraction 30 min after the addition of rifampicin. In lane 4, ribosomes were added to the cell extract before purification. In lanes 5 and 6, RNA was isolated from purified ribosomes (-lysate). (C) Northern blot of RNA from B probed with 32P-oligonucleotide specific to 5S rRNA. (D) Rifampicin-induced rRNA degradation in BL21, W3110, and MG1655 strains of E. coli. Lanes 1 and 2, total RNA immediately after the addition of rifampicin (biological replicates). Lanes 3 and 4, corresponding RNA 30 min after the addition of rifampicin.
FIGURE 4.
FIGURE 4.
Rifampicin-induced rRNA degradation in MOPS media supplements with carbon sources and casamino acids. (A,C,E,G) SYBR Safe stained agarose gels. E. coli strain NCM3416 was grown in MOPS medium at 37°C supplemented with glucose (glc), succinate (suc) or glycerol (gly), and casamino acids (caa), except in G. Final concentration of carbon source and casamino acids was 0.5% and 0.2%, respectively. Each gel shows three biological replicates. The 0 min time point was taken immediately after the addition of rifampicin. (B,D,F,H) Levels of 23S, 16S and 5S rRNA, and tRNA were quantified from six biological replicates. Nominal amounts of RNA were determined as described (Fig. 2). The graphs show the average and standard deviation expressed as nanogram of RNA per mL of culture. Percentages represent normalization of the 30 min time point after rifampicin addition to the 0 min time point.
FIGURE 5.
FIGURE 5.
Colony forming units after treatment with rifampicin. Viable cells per mL of culture were measured by colony formation after serial dilution (10−6-fold) and plating on LB in the absence of antibiotic. Rifampicin was added at 0 min. The graph shows the average and standard deviation of colony forming units (cfu) from three biological replicates. Percentages represent normalization to the −2 min time point.
FIGURE 6.
FIGURE 6.
Effect of protein synthesis inhibitors on rRNA and tRNA levels. Total RNA extracted from equal volumes of culture was separated by agarose gel electrophoresis. The gels were imaged by SYBR Safe staining. M = DNA size markers. (A,C) NCM3416 grown in LB medium at 37°C was treated with chloramphenicol (125 µg/mL) or kasugamycin (1 mg/mL). The 0 min time points were taken immediately after addition of antibiotic. Lanes 13 are biological replicates; lanes 46, the corresponding 30 min time points. (B,D) Quantification of 23S, 16S, 5S rRNA, and tRNA levels showing the average and standard deviation from six biological replicates. Percentages represent normalization to the 0 min time point.
FIGURE 7.
FIGURE 7.
Ribonucleases involved in rifampicin-induced rRNA degradation. Total RNA extracted from equal volumes of culture was separated by agarose gel electrophoresis. The gels were imaged by SYBR Safe staining. M = DNA size markers. In panels AD, the 0 min time points were taken immediately after the addition of rifampicin (150 µg/mL). (A) Single gene knockouts. Lanes 1 to 8 correspond to mutant strains with gene deletions that result in the loss of the following proteins: RNase I, RNase II, RNase G, RNase R, RNase PH, poly(A)polymerase, PNPase and YbeY. (B) RNase III. Rifampicin treatment of the BL321 strain, which contains the rnc105 mutant allele resulting in a lack of RNase III activity (Portier et al. 1987). (C) TA elements. Rifampicin treatment of the ΔTA10 strain, in which ten toxin-antitoxin elements have been disrupted (Goormaghtigh et al. 2018). Each of these elements encodes an mRNA interferase that inactivates mRNA by endoribonucleolytic cleavage. (D) 3′-exos. Rifampicin treatment of the CA244 strain, which contains a knockout of the rnr gene encoding RNase R and the mutant pnp200 allele encoding a temperature-sensitive variant of PNPase (Cheng and Deutscher 2003). The strain was grown to OD600 = 0.1 at 30°C in LB and then shifted to 42°C. Rifampicin was added 4 h after the temperature shift. (E) RNase E. AC21, AC22, and AC23 are isogenic strains containing the rne+, rne(F68L)ts, and rne(G66S)ts alleles, respectively (Carpousis et al. 1994). The strains were grown to OD600 = 0.5 at 30°C in LB and then shifted to 43.5°C for 10 min before the addition of rifampicin (150 µg/mL). RNA was extracted 2, 10, 20, and 30 min after the addition of rifampicin. (FI) Quantification of RNA levels. The bar graphs show the average and standard deviation of 23S, 16S, and 5S rRNA, and tRNA levels from three biological replicates performed as shown in E. AC21 is the isogenic wild-type control. AC22 and AC23 harbor mutant alleles encoding temperature-sensitive variants of RNase E. Percentages represent normalization to the 2 min time point.

Similar articles

Cited by

References

    1. Akerlund T, Nordstrom K, Bernander R. 1995. Analysis of cell size and DNA content in exponentially growing and stationary-phase batch cultures of Escherichia coli. J Bacteriol 177: 6791–6797. 10.1128/jb.177.23.6791-6797.1995 - DOI - PMC - PubMed
    1. Alifano P, Palumbo C, Pasanisi D, Tala A. 2015. Rifampicin-resistance, rpoB polymorphism and RNA polymerase genetic engineering. J Biotechnol 202: 60–77. 10.1016/j.jbiotec.2014.11.024 - DOI - PubMed
    1. Baba T, Ara T, Hasegawa M, Takai Y, Okumura Y, Baba M, Datsenko KA, Tomita M, Wanner BL, Mori H. 2006. Construction of Escherichia coli K-12 in-frame, single-gene knockout mutants: the Keio collection. Mol Syst Biol 2: 2006 0008. 10.1038/msb4100050 - DOI - PMC - PubMed
    1. Babitzke P, Kushner SR. 1991. The Ams (altered mRNA stability) protein and ribonuclease E are encoded by the same structural gene of Escherichia coli. Proc Natl Acad Sci 88: 1–5. 10.1073/pnas.88.1.1 - DOI - PMC - PubMed
    1. Bakshi S, Choi H, Mondal J, Weisshaar JC. 2014. Time-dependent effects of transcription- and translation-halting drugs on the spatial distributions of the Escherichia coli chromosome and ribosomes. Mol Microbiol 94: 871–887. 10.1111/mmi.12805 - DOI - PMC - PubMed

LinkOut - more resources