. 2021 Jun 7;12(6):582.
doi: 10.1038/s41419-021-03880-9.

Effects of short-chain fatty acids in inhibiting HDAC and activating p38 MAPK are critical for promoting B10 cell generation and function

Affiliations

Effects of short-chain fatty acids in inhibiting HDAC and activating p38 MAPK are critical for promoting B10 cell generation and function

Fagui Zou et al. Cell Death Dis. .

Abstract

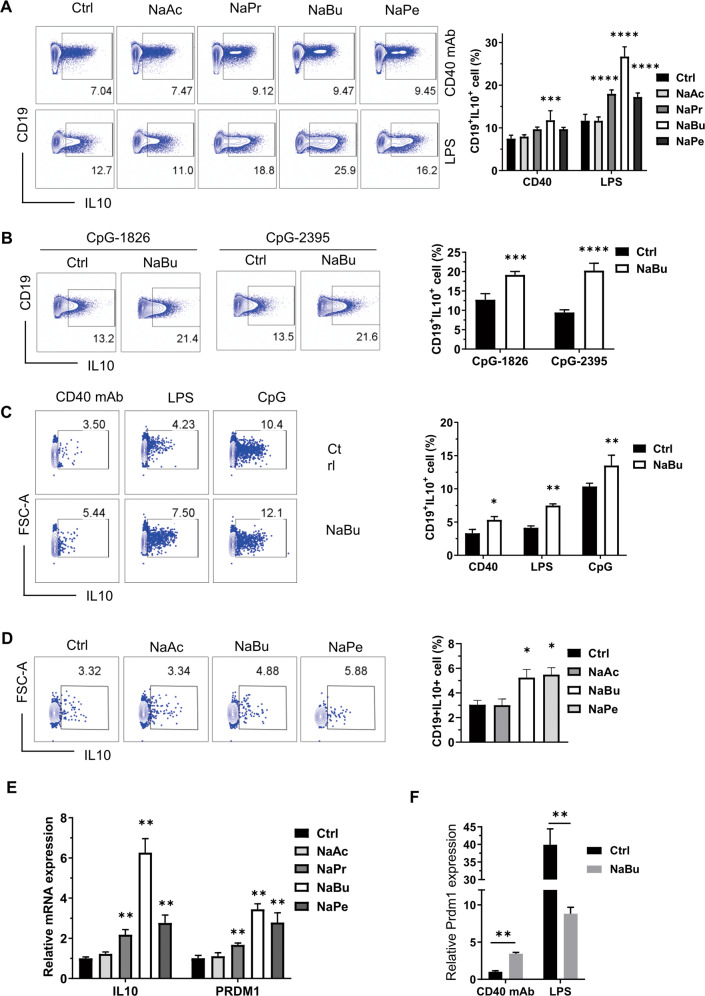
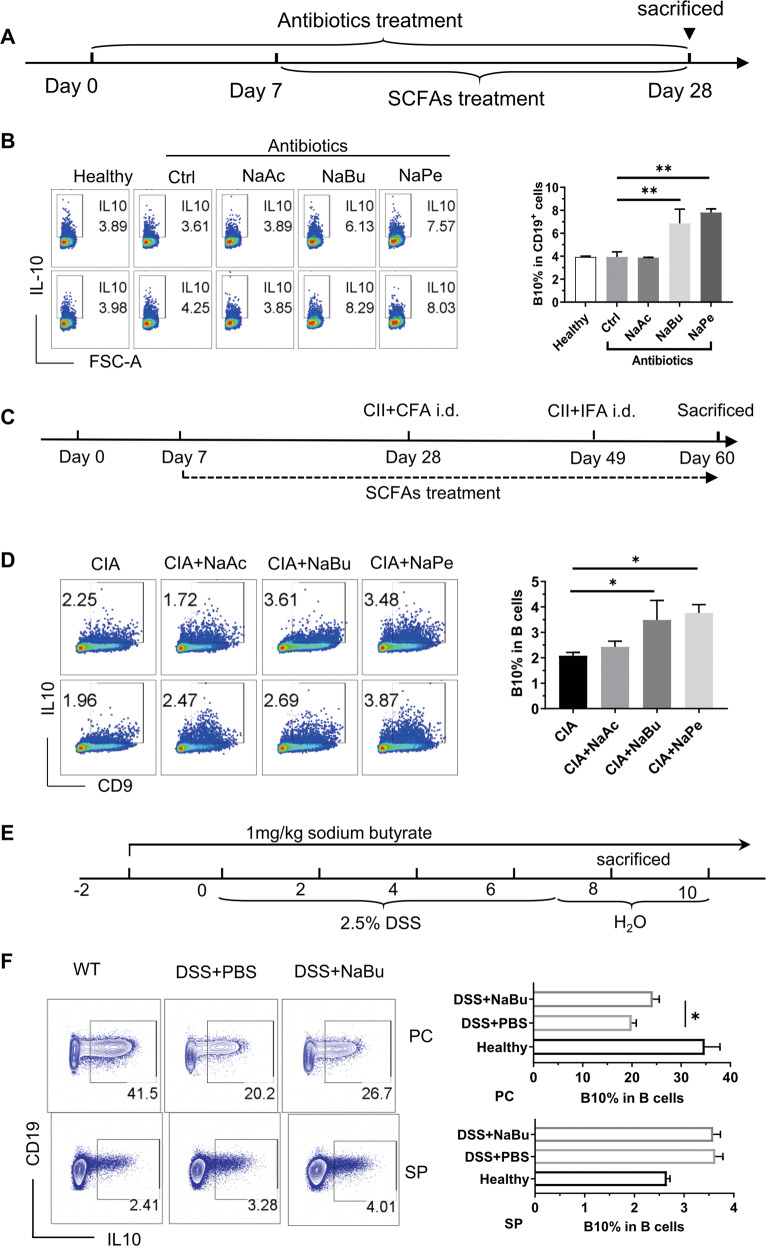
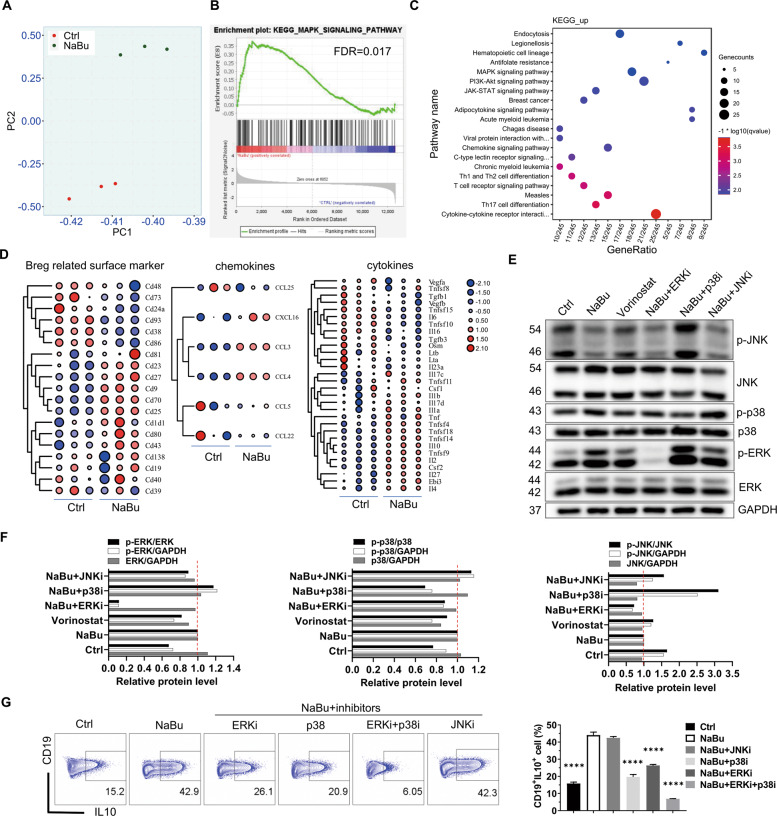
B10 cells are regulatory B cells capable of producing IL-10 for maintaining immune homeostasis. Dysregulation of B10 cells occurs in autoimmune and inflammatory diseases. Modulation or adoptive transfer of B10 cells is a promising therapeutic strategy. The short-chain fatty acids (SCFAs), the metabolites of microbiota, play a critical role in maintaining immune homeostasis and are the potential drugs for the modulation of B10 cells. It is not clear whether and how SCFAs upregulate the frequency of B10 cells. Here, we found that SCFAs could promote murine and human B10 cell generation in vitro. Upregulation of B10 cells by butyrate or pentanoate was also observed in either healthy mice, mice with dextran sodium sulfate (DSS)-induced colitis, or mice with collagen-induced arthritis. Moreover, SCFA treatment could ameliorate clinical scores of colitis and arthritis. Adoptive transfer of B cells pretreated with butyrate showed more alleviation of DSS-induced colitis than those without butyrate. A further study demonstrates that SCFAs upregulate B10 cells in a manner dependent on their histone deacetylase (HDAC) inhibitory activity and independent of the G-protein-coupled receptor pathway. Transcriptomic analysis indicated that the MAPK signaling pathway was enriched in B10 cells treated with butyrate. A study with inhibitors of ERK, JNK, and p38 MAPK demonstrated that activating p38 MAPK by butyrate is critical for the upregulation of B10 cells. Moreover, HDAC inhibitor has similar effects on B10 cells. Our study sheds light on the mechanism underlying B10 cell differentiation and function and provides a potential therapeutic strategy with SCFAs and HDAC inhibitors for inflammation and autoimmune diseases.


Conflict of interest statement

The authors declare no competing interests.

Figures

Fig. 1
Fig. 1. SCFAs promote both murine and human B10 cell generation in vitro.
A Representative FACS plots of splenic B cells purified from C57BL/6J mice and cultured with murine CD40 mAb or LPS in the absence or presence of corresponding SCFAs (0.5 mM) for 48 h. The right bar graph is a statistical result of B10 cell percentage. B Representative FACS plots of murine splenic B cells cultured with CpG-1826 or CpG-2395 and incubated with or without NaBu. C Representative FACS plots of human PBMCs stimulated by LPS, CpG-ODN 2395, or human CD40 mAb with or without sodium butyrate (0.5 mM) for 48 h. D Representative FACS plots of human PBMCs stimulated by human CD40 mAb with or without 0.5 mM of NaAc, NaBu, or NaPe for 48 h. E Statistical mRNA level of IL-10 and PRDM1 detected by RT-qPCR in purified murine B cells cultured with or without SCFAs under the existence of CD40 mAb for 48 h. F Statistical mRNA level of PRDM1 detected by RT-qPCR in purified murine B cells cultured with or without SCFAs under the existence of CD40 mAb or LPS for 48 h. The data are presented as mean ± SD from at least three independent experiments. *P < 0.05, **p < 0.01, ***p < 0.001, and ****p < 0.0001 compared to Ctrl with the same stimuli.
Fig. 2
Fig. 2. Sodium butyrate inhibits cell proliferation and promotes B10 cell differentiation.
Murine splenic B cells were isolated and labeled with CFSE and then cultured with CD40 mAb (A), LPS (B), or CpG-ODN 2395 (C) in the presence or absence of sodium butyrate for 48 h. Representative FACS plots of IL-10 secretion and CFSE dilution, followed by proliferation of B cells were shown in the left and middle panels, while the right panels showed the statistical results. The data are presented as mean ± SD from three independent experiments. **P < 0.01 compared to Ctrl at the same culture time.
Fig. 3
Fig. 3. SCFAs promote B10 cell generation in vivo.
A Schematic diagram of the procedure adopted for treating C57BL/6J mice with SCFAs. Mice were randomly grouped and administered with antibiotics in drinking water for 7 days to clear the gut bacteria and then received SCFAs in drinking water containing antibiotics for 3 weeks before being sacrificed for sampling. B Representative FACS plots of IL-10+ cells in CD19+ B cells from PBMCs of mice treated as described in “Materials and methods” with the procedure of (A). Cells were cultured with L + PIM for 5 h before staining. The right bar graph is a statistical result of B10 cell percentage (similarly hereinafter). C Schematic diagram of procedure adopted for treating DBA/1J mice with SCFAs for prevention of collagen-induced arthritis. Mice were treated the same as in (A) before they received their first immunization with CII plus CFA on Day 28, then got the immune boost with CII plus IFA on Day 49, and finally they were sacrificed on Day 60. SCFAs were provided in the drinking water from Day 7 to 60. D Representative FACS plots of IL-10+ cells in CD19+ B cells from splenocytes of mice in (C). Cells were cultured with CD40 mAb for 48 h and L + PIM for the last 5 h. E Schematic diagram of procedure treating C57BL/6 mice with SCFAs for preventing colitis induced with DSS. F Representative FACS plots of IL-10+ cells in CD19+ B cells from the spleen or peritoneal cavity fluids of mice in (D). Cells were cultured with L + PIM for 5 h before staining. The data are presented as mean ± SD from at least six mice in each group. *P < 0.05 and **p < 0.01, compared to Ctrl (B), CIA (D) or DSS+PBS (F) as indicated.
Fig. 4
Fig. 4. Sodium butyrate promotes B10 cell functions.
A Inhibition of T cell proliferation by B cells. B cells isolated with CD19 microbeads were treated by LPS with or without sodium butyrate for 2 days and then washed twice with PBS before coculture for 72 h (100 or 200 × 103) with fresh splenocytes (100 × 103) at a ratio of 1:1 or 2:1 in a plate coated with CD3e and CD28 antibody. The left panel shows the representative FACS plots of T cells and the right panel shows the statistical results. B Inhibition of DSS-induced colitis by i.p. injection of NaBu daily with the same procedure as in Fig. 3E. The severity of colitis was evaluated by DAI scores and examination of histological colon sections (H&E stained). C Upregulation of Treg by NaBu in lymphocytes from peripheral blood, spleen, and LN of mice in (B). D Inhibition of DSS-induced colitis by i.p. injection (green arrows) of CD19+ B cells pretreated with NaBu for 48 h as shown in the schematic diagram. The severity of colitis was evaluated by DAI scores and examination of histological colon sections (H&E stained). E Upregulation of Treg by Breg transfer in lymphocytes from the spleen and LN of mice in (D). F Inhibition of CIA by NaBu treatment with the same procedure as in Fig. 3C. Scale bar represents 200 μm in each microscopy image. The data are presented as mean ± SD from at least six mice in each group or three independent experiments. *P < 0.05, **p < 0.01, and ***p < 0.001 compared to the healthy group (B), Breg (D), or as indicated.
Fig. 5
Fig. 5. Promotion of B10 cell generation by SCFAs is independent of GPCR activity.
A, B The mRNA expression of GPR41, GPR43, and GPR109A detected by RT-qPCR in murine splenic naive B cells (A) and B cells cultured with or without 500 μM SCFAs under the existence of CD40 mAb for 2 days (B). CF B10 cell frequency in purified splenic B cells cultured with or without 500 μM NaBu, 10 μM GPR43 antagonist (C), 1 μM GPR43 agonist (D), 1 μM GPR41 antagonist AR420626 (E), or 1 mM GPR109A agonist niacin (F) under the existence of CD40 mAb or LPS for 2 days. The data are presented as mean ± SD from three independent experiments. *P < 0.05, **p < 0.01, and ***p < 0.001 compared between the groups as indicated.
Fig. 6
Fig. 6. Promotion of B10 cell generation by butyrate depends on its HDAC inhibitory activity.
A Purified splenic B cells were polarized to Bregs after a 2-day coculture with indicated SCFAs or Trichostatin A (TSA, an HDAC inhibitor with high efficiency) in the presence of LPS; the nuclear protein was prepared and tested for HDAC inhibition by ELISA. BD B10 cell frequency in purified splenic B cells cultured with or without sodium acetate (B), HDAC inhibitors TSA or vorinostat (C), or HAT inhibitor (HATi) anacardic acid (D) under the existence of CD40 mAb or LPS for 2 days. Results were shown as representative FACS plots or bar graphs. The data are presented as mean ± SD from three independent experiments. *P < 0.05, **p < 0.01, and ***p < 0.001 compared to Ctrl or as indicated.
Fig. 7
Fig. 7. Promotion of B10 cell generation by butyrate and HDACi is dependent on ERK and p38 MAPK activity.
Splenic B cells isolated from C57BL/6J mice were cultured with or without NaBu under the existence of LPS for 2 days and harvested for RNA-seq analysis. A The principal component analysis was performed on total normalized counts before statistical analysis. B, C Potential key pathways involved in the promotion of B10 cell generation by butyrate. DEGs identified as fold change >2 and p value of < 0.05 were used for gene set enrichment analysis (B) and KEGG pathway analysis (C). D Heatmap of the fold change of differentially expressed cytokines, chemokines, and Breg-related surface markers in cells treated with NaBu compared to the control. EG Protein level evaluated by immunoblot analysis (E, F) and B10 cell frequency detected by flow cytometry (G) in B cells, which were cultured for 48 h in the presence of LPS with or without NaBu (1 mM) or MAPK inhibitors including ERKi (5 μM), p38i (5 μM), and JNIKi (1 μM). The relative protein levels in immunoblots were semi-quantified by the Image J software and the ratio between the level of phosphorylated and total target protein was calculated and visualized as bar graphs in (F). The data are presented as mean ± SD from three independent experiments. ****P < 0.0001 compared to NaBu.

Similar articles

Cited by

References

    1. Fillatreau S, Sweenie CH, McGeachy MJ, Gray D, Anderton SM. B cells regulate autoimmunity by provision of IL-10. Nat. Immunol. 2002;3:944–950. doi: 10.1038/ni833. - DOI - PubMed
    1. Shen P, et al. IL-35-producing B cells are critical regulators of immunity during autoimmune and infectious diseases. Nature. 2014;507:366–370. doi: 10.1038/nature12979. - DOI - PMC - PubMed
    1. Parekh VV, et al. B cells activated by lipopolysaccharide, but not by anti-Ig and anti-CD40 antibody, induce anergy in CD8+ T cells: role of TGF-beta 1. J. Immunol. 2003;170:5897–5911. doi: 10.4049/jimmunol.170.12.5897. - DOI - PubMed
    1. Zou, F. G. et al. Expression and function of tetraspanins and their interacting partners in B cells. Front. Immunol.9, 1606 (2018). - PMC - PubMed
    1. Candando KM, Lykken JM, Tedder TF. B10 cell regulation of health and disease. Immunol. Rev. 2014;259:259–272. doi: 10.1111/imr.12176. - DOI - PMC - PubMed

Publication types

MeSH terms

Substances