. 2021 Jun 7;12(6):588.
doi: 10.1038/s41419-021-03849-8.

Oxytocin receptor induces mammary tumorigenesis through prolactin/p-STAT5 pathway

Affiliations

Oxytocin receptor induces mammary tumorigenesis through prolactin/p-STAT5 pathway

Dan Li et al. Cell Death Dis. .

Abstract

Oxytocin receptor (OXTR) is involved in social behaviors, thermoregulation, and milk ejection, yet little is known about its role in breast cancer. To investigate the role of OXTR in mammary gland development and tumorigenesis, a transgenic mouse model of OXTR overexpression (++Oxtr) was used. Overexpression of OXTR-induced progressive mammary hyperplasia, unexpected milk production, and tumorigenesis in females. OXTR-induced mammary tumors showed ERBB2 upregulation and mixed histological subtypes with predomination of papillary and medullary carcinomas. OXTR overexpression led to an activation of prolactin (PRL)/p-STAT5 pathway and created a microenvironment that promotes mammary-specific tumorigenesis. PRL inhibitor bromocriptine (Br) could mitigate OXTR-driven mammary tumor growth. The study demonstrates Oxtr is an oncogene and a potential drug target for HER2-type breast cancer.


Conflict of interest statement

The authors declare no competing interests.

Figures

Fig. 1
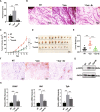
Fig. 1. Tumor onset and histology analysis.
A Kaplan–Meier plot of tumor-free survival for wild-type (WT) (n = 29) and ++Oxtr females (n = 30). B Tumor incidence analysis, WT, n = 29 and ++Oxtr, n = 30. C Tumor growth measurement by volume (n = 9). D Tumor weights 30 days after palpation (n = 8). Data were represented as mean ± SD. ***P < 0.001, calculated using two-tailed unpaired t-test and Log-rank (Mantel–Cox) test. E Representative macroscopic view of tumors in ++Oxtr females. Scale bar: 1 mm. F Histology analysis of ++Oxtr mammary tumors. Representative images of H&E staining of mammary tumors showing major histological subtypes: a. Papillary carcinomas with squamous phenotype. b. Papillary carcinomas with mucus and lipid droplets. c. Medullary carcinomas. d. Glandular carcinomas. e. Poorly differentiated carcinoma. f. Clear cell carcinoma. Scale bar: 100 μm. Pie chart shows distribution of each subtype.
Fig. 2
Fig. 2. Preneoplastic mammary hyperplasia and unexpected milk production.
Mammary glands (fourth pair) of ++Oxtr and WT females at 3, 7, and 9 months (3 M, 7 M, 9 M) were harvested. A Whole-mount staining of mammary gland. Scale bar: 500 μm. B H&E staining of mammary gland showing ducts full of proteinaceous material (Arrowhead). Scale bar: 100 μm. C Macroscopic images of mammary gland (third pair) with ducts full of milk (Arrowhead). Scale bar: 1 cm. D Milk accumulation in third mammary gland of 5-month-old WT (n = 19) and ++Oxtr females (n = 24). E Gene expression of major milk proteins Csn2 and Wap, n = 6. F Immunochemistry staining of Ki67 in mammary gland. Nuclei were stained blue with hematoxylin. Scale bar: 100 μm. Quantitative immunostaining of mammary gland using Image Pro Plus, n = 5. G Ki67 immunostaining of ++Oxtr mammary tumor and WT mammary gland. Scale bar: 100 μm. Quantification of immunostaining using Image Pro Plus, n = 5. H Whole-mount staining of ++Oxtr mammary gland at tumorigenesis and corresponding WT mammary gland. Scale bar: 500 μm. Data were represented as mean ± SD. ***P < 0.001, calculated using two-tailed unpaired t-test.
Fig. 3
Fig. 3. Identification of Erbb2 positive mammary tumors by differentially expressed genes (DEGs).
A Pie chart representation of KEGG pathway enrichment of DEGs between ++Oxtr tumors to WT mammary gland. BE Gene set enrichment analysis (GSEA) showed upregulated genes of cancer proliferation cluster (B), breast cancer-related pathways (C, D), and ERBB2 breast cancer-related pathways (E) were significantly enriched in ++Oxtr tumors. Significance was determined by normalized enrichment score (NES) and FDR. F Heatmap representation of gene expression patterns in human HER2+ breast cancer patients to normal breast (Data from GSE61) and ++Oxtr tumors to WT mammary gland. G Validation of RNAseq results by qPCR. Gene expression of Erbb2, Grb7, Esr1, and Pgr, n = 6. H Gene expression of Tgfa, Egfr, Akt1, and Brca1, n = 6. I Gene expression of Tgfβ1, Pten, p53, and Bcl2, n = 6. J Gene expression of Prlr, Csn2, and Wap, n = 6. Data were represented as mean ± SD. **P < 0.01, ***P < 0.001, calculated using two-tailed unpaired t-test.
Fig. 4
Fig. 4. OXTR overexpression activates PRL/p-STAT5/RANKL pathway at various stages (3 M, 7 M, 9 M, Tumorigenesis).
A Serum prolactin levels, n = 5. B Serum progesterone levels, n = 5. C Immunoblotting analysis of OXTR, p-STAT5, STAT5, and RANKL from fourth mammary gland of ++Oxtr, WT, and ++Oxtr tumors. GAPDH is the loading control. D Immunostaining of p-STAT5 from fourth mammary gland of ++Oxtr, WT, and ++Oxtr tumors. Nuclei were stained blue with hematoxylin. Scale bar: 100 μm. E GSEA plots evaluating enrichment of upregulated genes of STAT5-induced mammary tumors (Data from GSE15119 were reanalyzed) in ++Oxtr tumors. F GSEA plots evaluating enrichment of downregulated genes of STAT5-induced tumors in ++Oxtr tumors. G Venn diagram displayed the overlap between STAT5-binding genes (Data from GSE74826 were reanalyzed) and the upregulated genes in ++Oxtr tumors. H Ontology analysis of overlapping genes between OXTR-upregulated and STAT5-binding genes. I ChIP-seq profiles of STAT5 on Erbb2, Akt1, and Tgfα in mouse mammary gland (Data from GSE2492061, GSE74826, and GSE82275 were obtained). Data represented as mean ± SD. **P < 0.01, ***P < 0.001, calculated using two-tailed unpaired t-test.
Fig. 5
Fig. 5. Bromocriptine treatment of ++Oxtr females results in compromised mammary gland development and tumor growth.
After E0771 cells transplantation, ++Oxtr females were treated with a vehicle or 200 ug (1 mg/ml) bromocriptine (Br) for 15 days. A Serum prolactin (PRL) levels of WT, ++Oxtr, and ++Oxtr females with Br treatment, n = 8. B Whole-mount staining of fourth mammary glands, Scale bar: 500 μm. C Tumor growth (n = 10) by tumor volume. D Representative photos of tumors. E Tumor weights, WT (n = 13), ++Oxtr (n = 10), and ++Oxtr with Br treatment (n = 12). F p-STAT5 immunostaining of tumors. Nuclei were stained blue with hematoxylin. Scale bar: 100 μm. G Immunoblotting analysis of p-STAT5 of tumors. H Gene expression of Erbb2, Akt1, and Tgfα in tumors by qPCR, n = 6. Data were represented as mean ± SD. **P < 0.01, ***P < 0.001, calculated with one-way analysis of variance (ANOVA).
Fig. 6
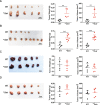
Fig. 6. OXTR overexpression promotes mammary tumor growth, not melanoma or cervical tumor.
For tumor growth analysis, ++Oxtr tumor fragment, E0771, B16, or U14 cells were orthotopically transplanted into fourth mammary gland of 3-month-old WT and ++Oxtr females. Tumors were analyzed on day 15 after transplantation. A Representative photos of mammary tumors from ++Oxtr tumor fragment, Scale bar: 1 cm. Quantitative analysis of mammary tumor weights (n = 5) and volumes (n = 5). B Representative photos of mammary tumors from E0771 cells, Scale bar: 1 cm. Quantitative analysis of mammary tumor weights (n = 5 from WT and n = 8 from ++Oxtr) and volumes (n = 5 from WT and n = 8 from ++Oxtr). C Representative photos of melanoma tumors from B16 cells, Scale bar: 1 cm. Quantitative analysis of melanoma tumor weights (n = 5) and volumes (n = 5). D Representative photos of cervical tumors from U14 cells, Scale bar: 1 cm. Quantitative analysis of cervical tumor weights (n = 5) and volumes (n = 5). Data were represented as mean ± SD. **P < 0.01, ***P < 0.001, calculated using two-tailed unpaired t-test.
Fig. 7
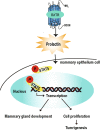
Fig. 7. Role model of OXTR in mammary tumorigenesis.
OXTR overexpression leads to increased prolactin secretion in ++Oxtr females. Prolactin induces phosphorylation and nuclear translocation of p-STAT5 to promote transcription of genes responsible for cell proliferation and milk proteins (Csn2 and Wap). Excessive proliferation of mammary epithelium induces tumorigenesis.

References

    1. Siegel RL, Miller KD, Fuchs HE, Jemal A. Cancer statistics, 2021. CA Cancer J. Clin. 2021;71:7–33. - PubMed
    1. Sorlie T, et al. Gene expression patterns of breast carcinomas distinguish tumor subclasses with clinical implications. Proc. Natl Acad. Sci. USA. 2001;98:10869–10874. doi: 10.1073/pnas.191367098. - DOI - PMC - PubMed
    1. Perou CM, et al. Molecular portraits of human breast tumours. Nature. 2000;406:747–752. doi: 10.1038/35021093. - DOI - PubMed
    1. Andrechek ER, et al. Gene expression profiling of neu-induced mammary tumors from transgenic mice reveals genetic and morphological similarities to ErbB2-expressing human breast cancers. Cancer Res. 2003;63:4920–4926. - PubMed
    1. Pauletti G, Godolphin W, Press MF, Slamon DJ. Detection and quantitation of HER-2/neu gene amplification in human breast cancer archival material using fluorescence in situ hybridization. Oncogene. 1996;13:63–72. - PubMed

Publication types

MeSH terms