. 2021 Jun 7;12(1):3386.
doi: 10.1038/s41467-021-23571-5.

Endometrial receptivity and implantation require uterine BMP signaling through an ACVR2A-SMAD1/SMAD5 axis

Affiliations

Endometrial receptivity and implantation require uterine BMP signaling through an ACVR2A-SMAD1/SMAD5 axis

Diana Monsivais et al. Nat Commun. .

Abstract

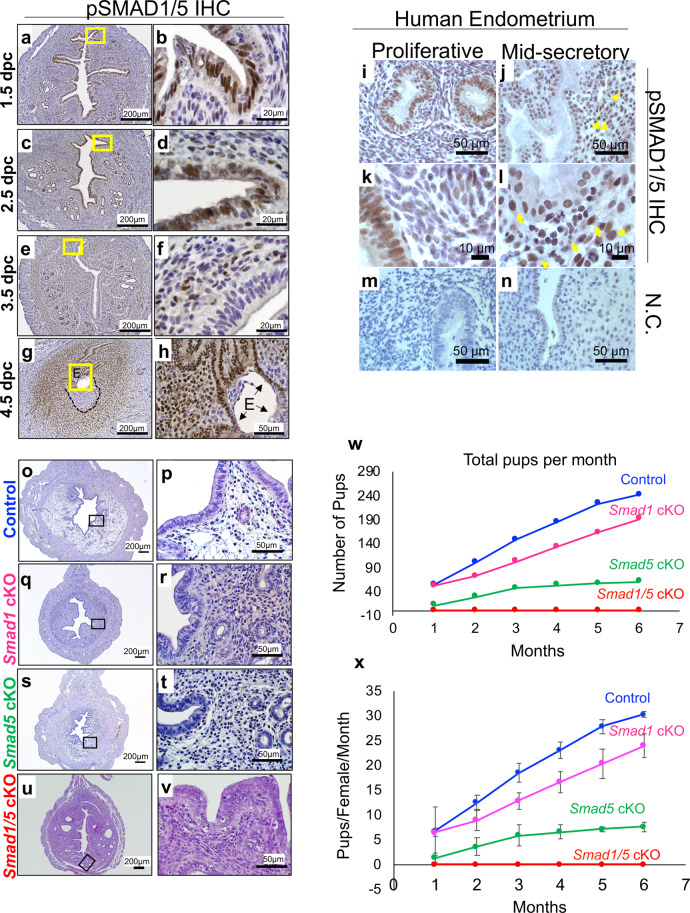
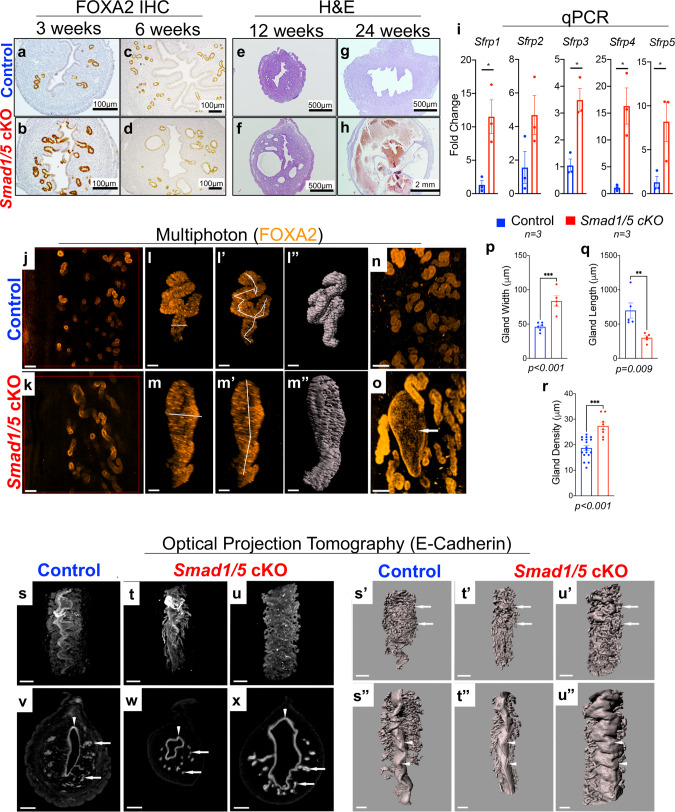
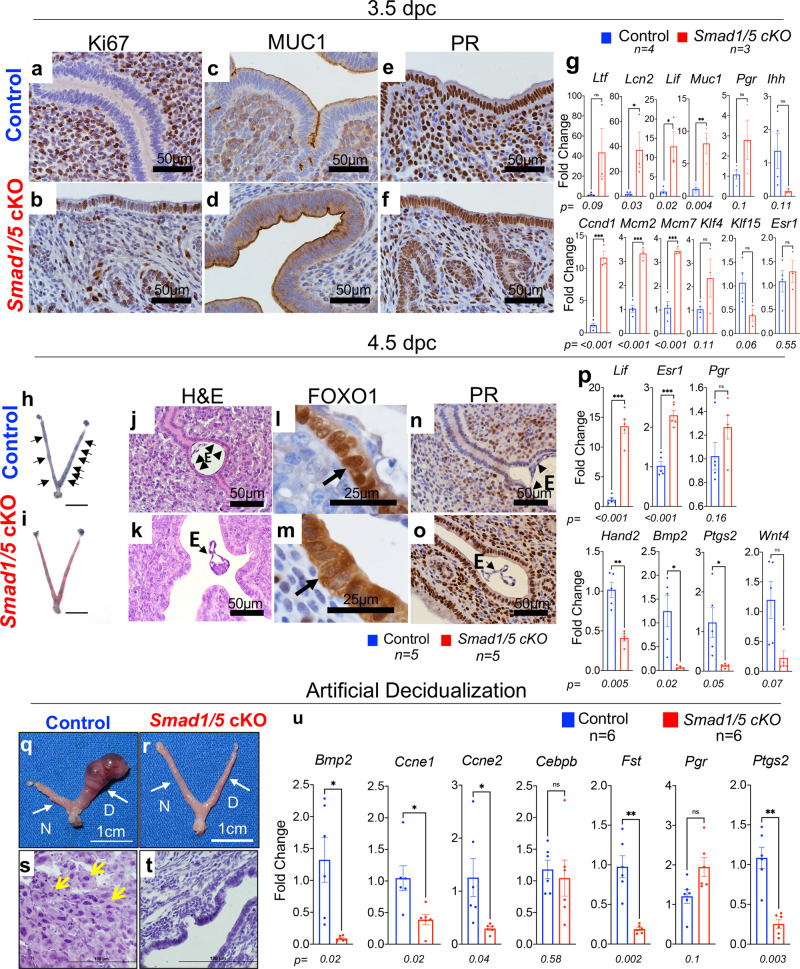
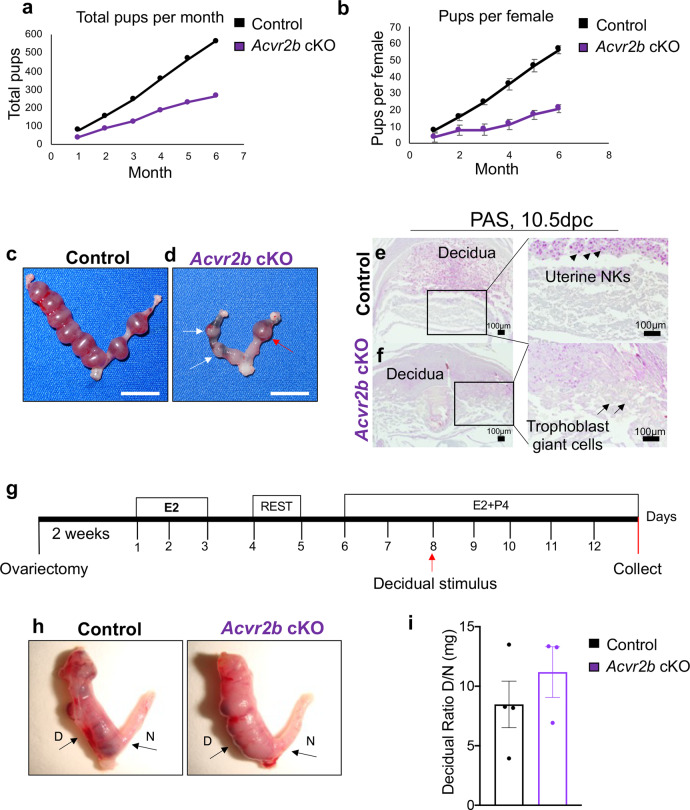
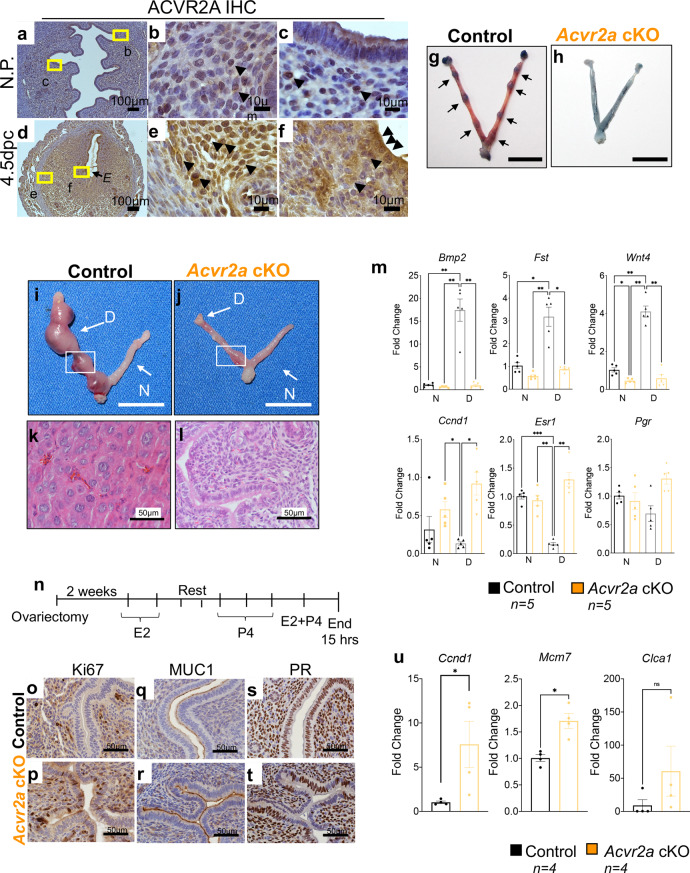
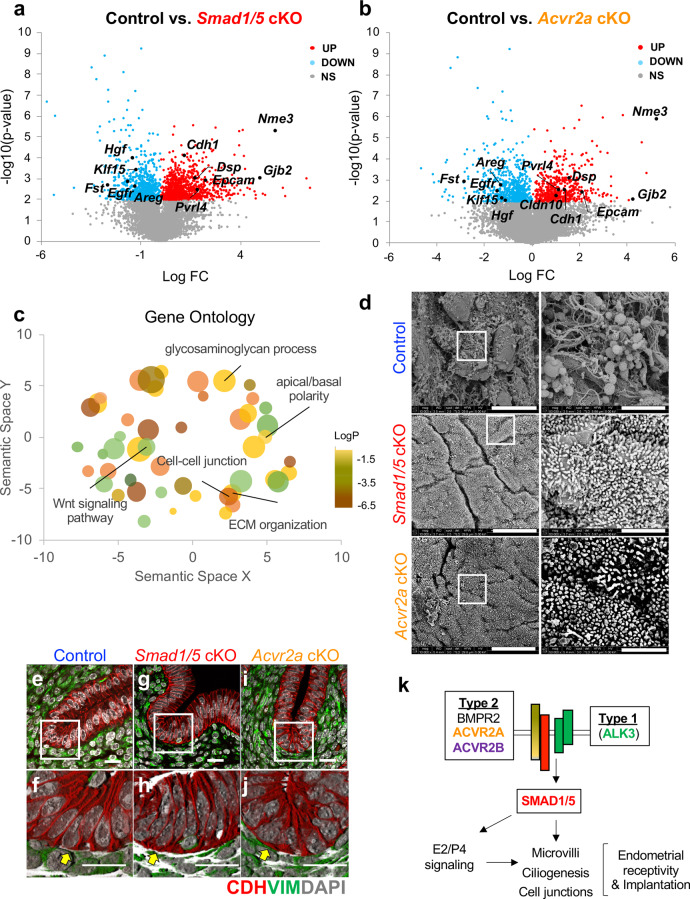
During early pregnancy in the mouse, nidatory estrogen (E2) stimulates endometrial receptivity by activating a network of signaling pathways that is not yet fully characterized. Here, we report that bone morphogenetic proteins (BMPs) control endometrial receptivity via a conserved activin receptor type 2 A (ACVR2A) and SMAD1/5 signaling pathway. Mice were generated to contain single or double conditional deletion of SMAD1/5 and ACVR2A/ACVR2B receptors using progesterone receptor (PR)-cre. Female mice with SMAD1/5 deletion display endometrial defects that result in the development of cystic endometrial glands, a hyperproliferative endometrial epithelium during the window of implantation, and impaired apicobasal transformation that prevents embryo implantation and leads to infertility. Analysis of Acvr2a-PRcre and Acvr2b-PRcre pregnant mice determined that BMP signaling occurs via ACVR2A and that ACVR2B is dispensable during embryo implantation. Therefore, BMPs signal through a conserved endometrial ACVR2A/SMAD1/5 pathway that promotes endometrial receptivity during embryo implantation.


Conflict of interest statement

The authors declare no competing interests.

Figures

Fig. 1
Fig. 1. Conditional deletion of SMAD1/5 results in female infertility.
ah pSMAD1/5 immunohistochemistry (IHC) at 1.5 dpc ab, 2.5 dpc cd, 3.5 dpc e–f, and 4.5 dpc (black dotted lines indicate primary decidual zone) gh. E, embryo. Representative image of the embryo, observed in at least three specimens from different mice. Images in ah represent findings observed in at least three individual samples per pregnancy timepoint. in pSMAD1/5 IHC in human endometrial biopsies obtained during the proliferative phase I, k or mid-secretory j, l of the menstrual cycle. m, n are negative controls, yellow arrows in j, l point to positive decidualized cells in the mid-secretory phase endometrium. Images shown are representative of patterns observed in three proliferative phase and six mid-secretory phase individuals. ov H&E-stained uterine cross-sections from 12-week-old control op, Smad1 cKO qr, Smad5 cKO st, and Smad1/5 cKO uv mice. wx Fertility assessment in Control (n = 8), Smad1 cKO (n = 8), Smad5 cKO (n = 8), and Smad1/5 cKO (n = 8) mice over the course of 6 months. Total pups per month are plotted in w, whereas the number of pups per female per month is plotted in x. Plotted as average pups per female per month ± standard error of the mean (SEM), n = 8 per genotype.
Fig. 2
Fig. 2. Smad1/5 cKO mice develop abnormal uterine glands that appear enlarged and cystic.
ah Histological analysis of control (a, c, e, g) and Smad1/5 cKO (b, d, f, h) uteri stained with FOXA2 (ad) or H&E (eh). Uteri were analyzed at 3 weeks (ab), 6 weeks (cd), 12 weeks (ef), and 24 weeks of age (gh). i Expression of the WNT-pathway inhibitors (Sfrp1-5) was analyzed using qPCR of 12-week-old uterine tissues of control (n = 3) and Smad1/5 cKO (n = 3) mice. Histograms represent mean ± standard error of the mean (SEM), paired, two-tailed, t test, *p < 0.05, **p < 0.01, ***P < 0.001. Sfrp1, p = 0.017; Sfrp2, p = 0.105; Sfrp3, p = 0.007; Sfrp4, p = 0.0107; Sfrp5, p = 0.042. jr Whole-mount immunostaining with FOXA2 antibody followed by multiphoton microscopy (jo) in the uteri of non-pregnant control (j), or Smad1/5 cKO mice (k). lr show analyses performed on individual glands from control (l, l’, l”) or Smad1/5 cKO mice (m, m’, m”) and the corresponding quantification of the width, length, and density of the glands (pr). Total fields counted for gland density analysis: n = 8 in three control mice and n = 18 in three Smad1/5 cKO mice. Histograms represent mean ± standard error of the mean (SEM). Unpaired, two-tailed t test, *p < 0.033, **p < 0.002, ***P < 0.001. Size bar: jk is 500 µm; lm” is 30 µm. Arrow in o indicates enlarged cystic endometrial gland from Smad1/5 cKO. sx Uterine lumen and endometrial glands stained with E-cadherin antibody and scanned by Optical Projection Tomography (OPT). Control (s, s’, s”, v) and Smad1/5 cKO (tu”, wx) whole-mount (su”) and optical cross-sections (vx) are displayed. Arrows in vx point to the uterine glands and arrowheads indicate the uterine lumen. s’–u”) Surface rendering of the mouse uterus emphasizes uterine glands (arrows in s’–u’) and folds in uterine lumen (arrowheads in s”–u”). Scale bar su’ (500 µm), and vx, s”–u” (300 µm). OPT scans and multiphoton imaging were performed in the tissues of at least three control and three Smad1/5 cKO mice.
Fig. 3
Fig. 3. Abnormal endometrial receptivity at 3.5 dpc and defective embryo implantation at 4.5 dpc in Smad1/5 cKO mice.
af Histological analysis of 3.5 dpc uteri from control (a, c, e) and Smad1/5 cKO (b, d, f) mice was performed by staining with Ki67 (ab), MUC1 (cd), or progesterone receptor (PR) (ef). g qPCR analysis from the endometrial epithelium of control (blue bars) or Smad1/5 cKO (red bars) mice. Paired, two-tailed, t test, mean ± SEM, *p < 0.05, **p < 0.001, ***P < 0.0001. hi Whole uteri of control (h) and Smad1/5 cKO (i) mice isolated at 4.5 dpc after injection with Chicago Sky Blue dye; implantation sites in the control mice can be visualized as blue bands (indicated by black arrows). Size bar = 1 cm. jk H&E-stained cross-sections from 4.5 dpc control (j) and Smad1/5 cKO (k) uteri. e=embryo. lo IHC of FOXO1 im and progesterone receptor (PR) no in 4.5 dpc uterine cross-sections of control (ln) and Smad1/5 cKO (mo) mice. Arrows in l, m indicate the nuclear staining of FOXO1 in the controls (l) and cytoplasmic FOXO1 staining in the Smad1/5 cKO mice (m) E embryo. Representative image of the embryo, observed in at least three specimens from different mice. p qPCR analysis of implantation-related markers in control (blue bars, n = 5) and Smad1/5 cKO (red bars, n = 5) uterine tissues collected at 4.5 dpc. Histology and qPCR analyses were performed in at least three samples of each genotype. Histograms represent mean ± SEM. Paired, two-tailed, t test, *p < 0.033, **p < 0.002, ***P < 0.001. qu Analysis of decidualization reveals that compared with controls, Smad1/5 cKO cannot respond to the artificial induction of decidualization. Gross images of control (q) and Smad1/5 cKO (r) uteri, (D, decidual horn; N, non-decidual horn; indicated by white arrows). st H&E stains of uterine cross-sections of the decidual horns of control (s) and Smad1/5 cKO (t) mice. Yellow arrows in (s) indicate decidualized cells. u Gene expression analysis by qPCR of control (blue bars, n = 6) and Smad1/5 cKO (red bars, n = 6) uterine tissues that received the decidual stimulus. Histology and qPCR analyses were performed in at least three samples of each genotype. Histograms represent mean ± SEM. Paired, two-tailed, t test, *p < 0.033, **p < 0.002, ***P < 0.001.
Fig. 4
Fig. 4. Acvr2b cKO mice are subfertile due to mid-gestation defects.
a–b Fertility assessment in the control (n = 10) and Acvr2b cKO (n = 10) mice over the course of 6 months. Total pups per month are plotted in a, while the number of pups per female per month is plotted in b. Data in b represent mean ± standard deviation, analyzed by single-factor ANOVA, p = 0.033. cd Gross uterine images of 10.5 dpc implantation sites of control (c) and Acvr2b cKO (d) mice. Arrows in d indicate hemorrhagic and resorbing implantation sites. Red arrow indicates the implantation site analyzed by PAS in f. Size bar = 1 cm. ef PAS-stained cross-sections from 10.5 implantation sites of control (e) and Acvr2b cKO (f) mice. Uterine natural killer cells (uNKs) are visualized as pink structures (indicated by black arrowheads) in the control implantation sites (e) but are absent in the Acvr2b cKOs (f). Abnormally expanded trophoblast giant cells are observed in the implantation sites of Acvr2b cKO mice (indicated by black arrows). g Experimental scheme used to induce artificial decidualization in control and Acvr2b cKO mice. g Gross images and quantification of the uterine horn weights after a 5-day decidualization. D, decidual horn; N, non-decidualized horn. i Decidual ratio was quantified by calculating the weights of the decidual horn relative to the control non-decidualized horn for each mouse. Images are representative of experiments performed in at least three subjects of each genotype. Histogram in i represents mean ± SEM. Unpaired, two-tailed t test, p = 0.40.
Fig. 5
Fig. 5. Acvr2a cKO mice are infertile and show defective endometrial receptivity.
af ACVR2A immunohistochemistry (IHC) was performed in mouse uterine cross-sections in non-pregnant (ac) and 4.5 dpc pregnant df WT mice. E, denotes embryo; black arrowheads indicate positively-stained cells. gh Images of 4.5 dpc uteri of control (g) and Acvr2a cKO (h) mice injected with Chicago Sky Blue dye to visualize implantation sites (denoted by black arrows in g). Size bar = 1 cm. Decidual response was measured in control (i) and Acvr2a cKO (j) mice. D, decidual horn; N, non-decidual horn; Size bars = 1 cm. kl H&E-stained cross-sections of the decidualized horns of control (k) and Acvr2a cKO (l) mice. m qPCR analysis of decidual-related genes, Bmp2 (p = 0.002), Fst (p = 0.002), Wnt4 (p < 0.0001), Ccnd1 (p = 0.03), Esr1 (p = 0.0007) and Pgr (p = 0.529) in the non-decidual (N) and decidualized (D) tissues of control (black bars, n = 5) and Acvr2a cKO (orange bars, n = 5) mice. Histograms represent mean ± SEM. Analyzed by one-way ANOVA with Tukey’s multiple comparisons post-test, asterisks above each bar represent statistically significant difference, *p < 0.033, **p < 0.002, ***P < 0.001. n Experimental scheme used to test uterine response to steroid hormones (Pollard experiment). ot IHC of uterine tissues from control (o, q, s) and Acvr2a cKO mice (p, r, t), stained with Ki67 (o, p), MUC1 (q, r), and PR (s, t). u qPCR quantification of Ccnd1 (p = 0.046), Mcm7 (p = 0.004) and Clca3 (p = 0.23) in the uteri of control (black bars, n = 4) and Acvr2a cKO (orange bars, n = 4) mice collected 15 h after 10 ng E2 + 1 mg P4 administration. Images represent experiments performed in at least three subjects of each genotype. Histograms u represent mean ±SEM. Paired, two-tailed t test, *p < 0.033, **p < 0.002, ***P < 0.001.
Fig. 6
Fig. 6. Shared signaling pathways between Smad1/5 cKO and Acvr2a cKO mice reveal abnormal retention of apicobasal polarity and defective endometrial receptivity.
ab Volcano plots of differentially expressed transcripts determined by RNAseq between control vs. Smad1/5 cKO (a) and control vs. Acvr2a cKO (b) in the uterine tissues of 3.5 dpc pseudopregnant mice. Red, upregulated (fold change >1.4, p < 0.01 by paired, two-tailed, t test); blue, downregulated (<0.6, p < 0.01); labeled genes share differential expression in both genotypes. c Gene ontology classification of the shared genes in Smad1/5 cKO and Acvr2a cKO mice that are differentially expressed vs. controls. Bubble size and colors are plotted relative to p values, whereas the location in the scatterplot represents functional categorization. d Scanning electron microscopy analysis of the surface of the luminal uterine epithelium of 3.5 dpc control, Smad1/5 cKO, and Acvr2a cKO mice. Size bars = 10 µm (left) or 2 µm (right). Images in d are representative images obtained from analyses of three samples per genotype. ej Immunofluorescence of the uterus of control (ef), Smad1/5 cKO (gh) and Acvr2a cKO (ij) mice at 3.5 dpc of pseudopregnancy. Tissues were stained with E-cadherin (red), vimentin (green), and DAPI (white), e, g, i are confocal z-stacks; f, h, j, are 3D-renderings of the z-stacks. Yellow arrows in the control uterus (f) indicate that E-cadherin immunoreactivity was decreased in the basal region of the luminal epithelium of control mice but maintained in the Smad1/5 cKO (h) and Acvr2a cKO (j) mice. Size bars are 20 µm. ej are representative images of at least three samples analyzed per genotype. k Schematic of the BMP signaling pathway that is active during the window of implantation.

References

    1. Wang H, Dey SK. Roadmap to embryo implantation: clues from mouse models. Nat. Rev. Genet. 2006;7:185–199. doi: 10.1038/nrg1808. - DOI - PubMed
    1. Finn CA, Martin L. The role of the oestrogen secreted before oestrus in the preparation of the uterus for implantation in the mouse. J. Endocrinol. 1970;47:431–438. doi: 10.1677/joe.0.0470431. - DOI - PubMed
    1. Wetendorf M, DeMayo FJ. The progesterone receptor regulates implantation, decidualization, and glandular development via a complex paracrine signaling network. Mol. Cell Endocrinol. 2012;357:108–118. doi: 10.1016/j.mce.2011.10.028. - DOI - PMC - PubMed
    1. Lee K, et al. Indian hedgehog is a major mediator of progesterone signaling in the mouse uterus. Nat. Genet. 2006;38:1204–1209. doi: 10.1038/ng1874. - DOI - PubMed
    1. Li Q, et al. The antiproliferative action of progesterone in uterine epithelium is mediated by Hand2. Science. 2011;331:912–916. doi: 10.1126/science.1197454. - DOI - PMC - PubMed

Publication types

MeSH terms