. 2021 Jun 7;12(1):3349.
doi: 10.1038/s41467-021-23355-x.

B cell signatures and tertiary lymphoid structures contribute to outcome in head and neck squamous cell carcinoma

Affiliations

B cell signatures and tertiary lymphoid structures contribute to outcome in head and neck squamous cell carcinoma

Ayana T Ruffin et al. Nat Commun. .

Abstract

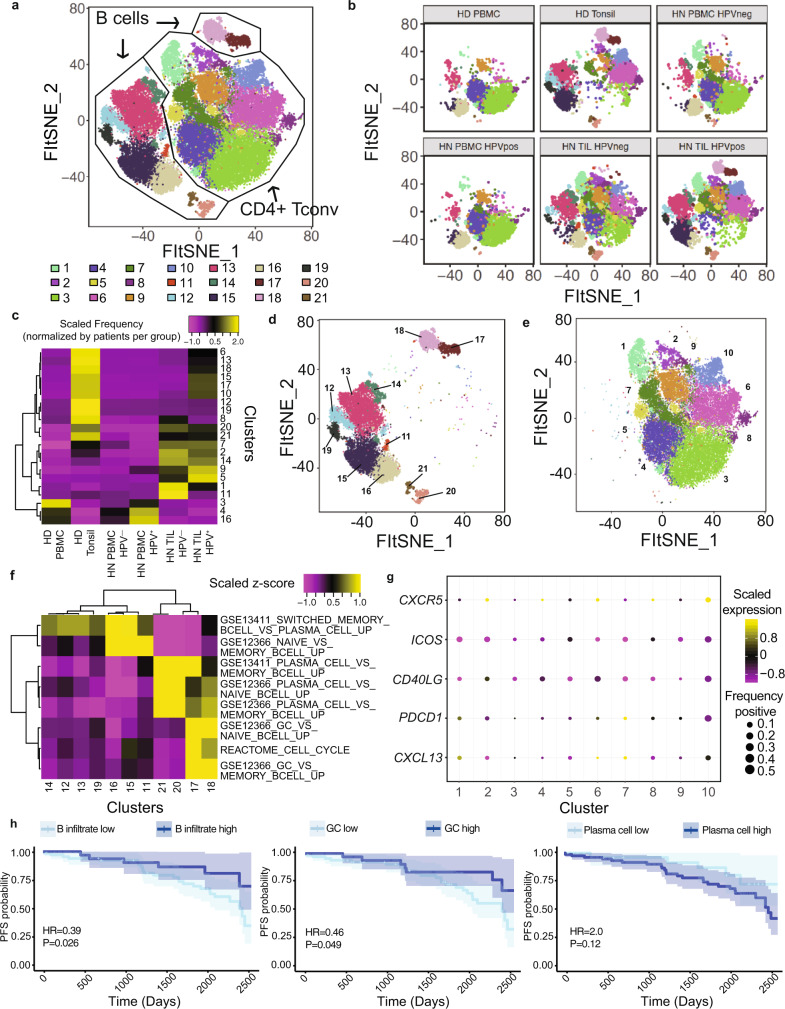
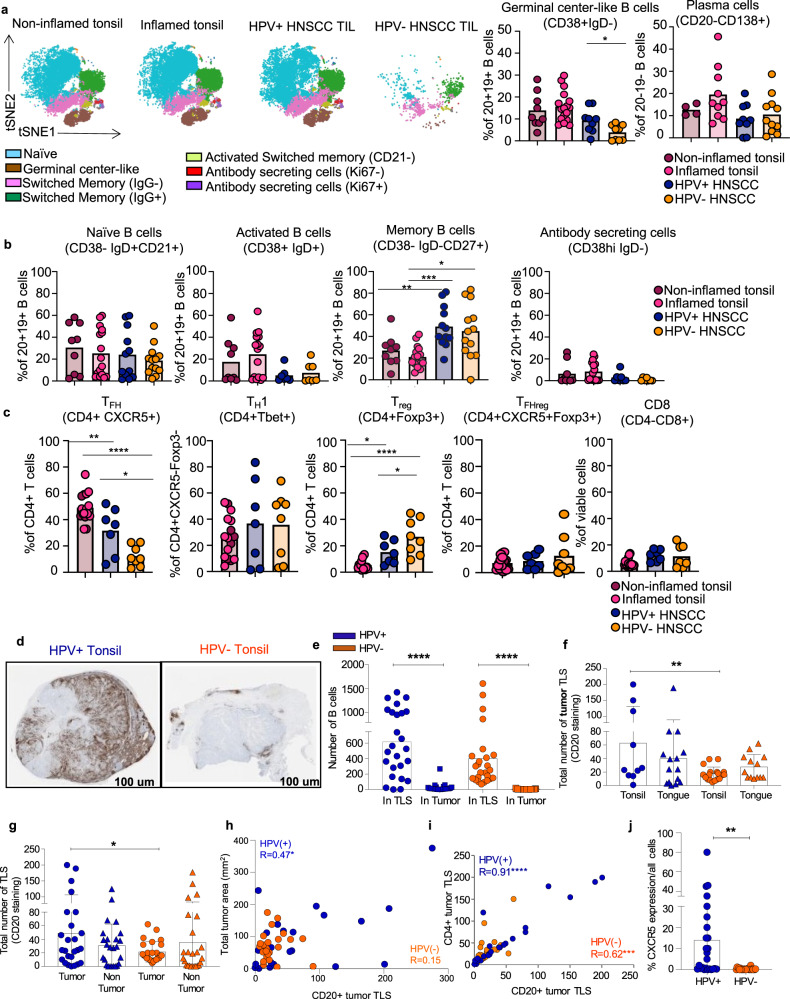
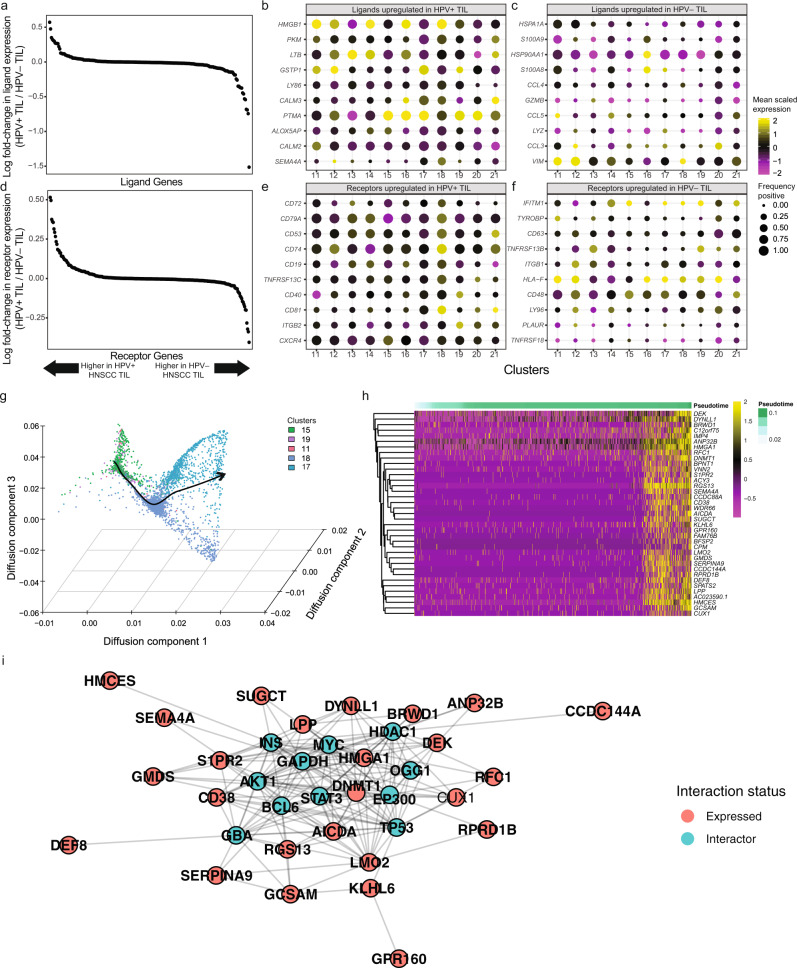
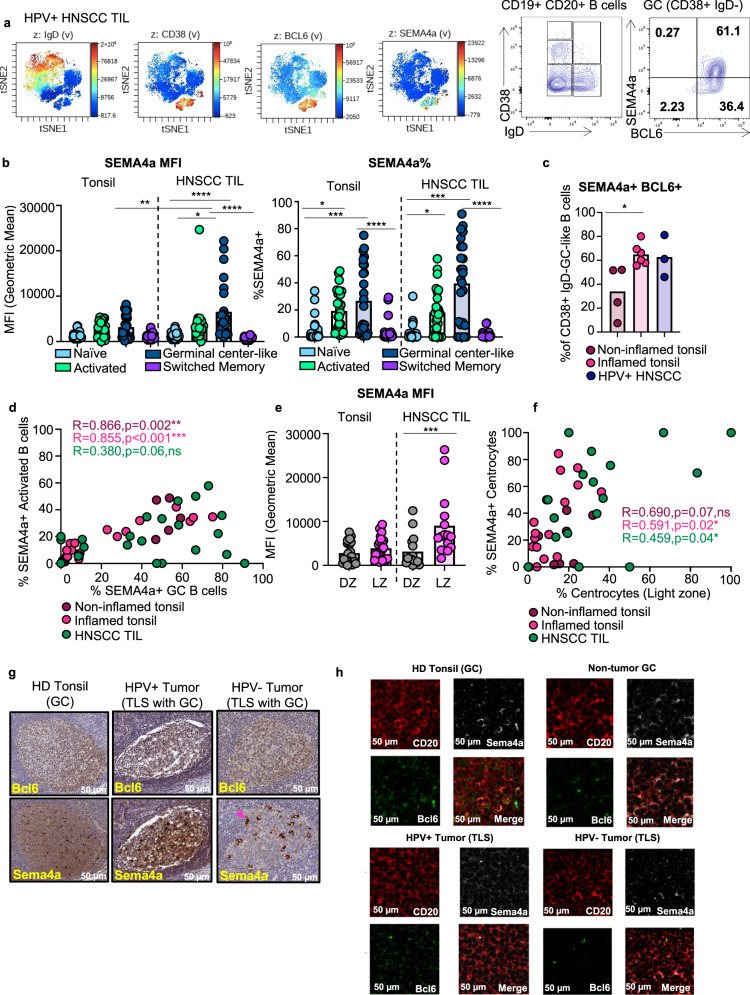
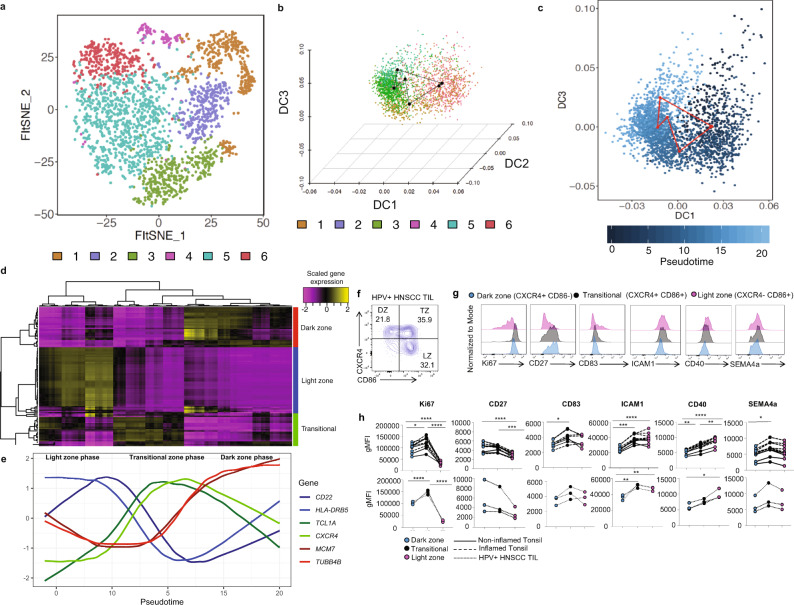
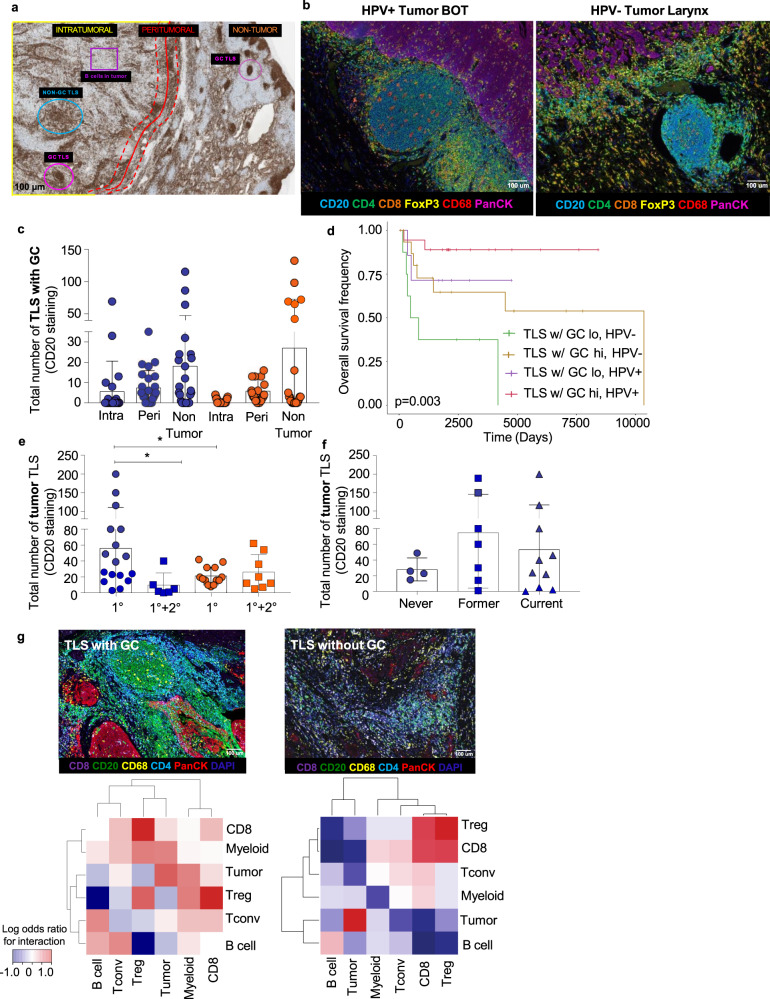
Current immunotherapy paradigms aim to reinvigorate CD8+ T cells, but the contribution of humoral immunity to antitumor immunity remains understudied. Here, we demonstrate that in head and neck squamous cell carcinoma (HNSCC) caused by human papillomavirus infection (HPV+), patients have transcriptional signatures of germinal center (GC) tumor infiltrating B cells (TIL-Bs) and spatial organization of immune cells consistent with tertiary lymphoid structures (TLS) with GCs, both of which correlate with favorable outcome. GC TIL-Bs in HPV+ HNSCC are characterized by distinct waves of gene expression consistent with dark zone, light zone and a transitional state of GC B cells. Semaphorin 4a expression is enhanced on GC TIL-Bs present in TLS of HPV+ HNSCC and during the differentiation of TIL-Bs. Our study suggests that therapeutics to enhance TIL-B responses in HNSCC should be prioritized in future studies to determine if they can complement current T cell mediated immunotherapies.


Conflict of interest statement

D.A.A.V.: cofounder and stockholder—Novasenta, Tizona and Potenza; stockholder—Oncorus and Werewolf; patents licensed and royalties—Astellas, BMS; scientific advisory board member—Tizona, Werewolf and F-Star; consultant—Astellas, BMS, Almirall, Incyte, Bicara; research funding—BMS, Astellas and Novasenta. R.L.F.: a consultant for Aduro Biotech Inc., Bain Capital Life Sciences, Iovance Biotherapeutics Inc., Nanobiotix, Ono Pharmaceutical Co. Ltd., Torque Therapeutics Inc., and TTMS; is on the advisory board for Amgen, AstraZeneca/MedImmune, Bristol-Myers Squibb, EMB Serono, GlaxoSmithKline, Lilly, MacroGenics, Merck, Numab Therapeutics AG, Pfizer, PPD, Regeneron Pharmaceuticals Inc., and Tesaro; receives clinical trial support from AstraZeneca/MedImmune, Bristol-Myers Squibb, and Merck; and receives research funding from Astra-Zeneca/MedImmune, Bristol-Myers Squibb, Tesaro, TTMS, and VentiRx Pharmaceuticals. T.C.B.: Receives research support from Alkermes and Pfizer. A.T.R., A.R.C., T.T., A.L., SaO, S.R.K., C.L., H.A., C.H.L.K., Z.Q., I.A., U.D., S.K., StO, L.G.C., R.S., R.L. declare no competing financial interests.

Figures

Fig. 1
Fig. 1. Differences in tumor-infiltrating B cell and helper CD4+ T cells between HPV− and HPV+ HNSCC contribute to survival.
a Unsupervised clustering of 16,965 B cells and 30,092 helper CD4+ T cells (total of 47,057 cells) from all samples in patient cohort 1 (n = 6 healthy donor PBMC, n = 5 tonsils from sleep apnea patients, and paired blood and tumor specimens from n = 18 patients with HPV− disease and n = 9 patients with HPV+ disease). b Same FItSNE plot as a but showing clusters by sample type. c Heatmap showing the frequencies of cells recovered from each cluster by sample types, where the frequencies of cells were normalized by the number of patients assessed in each group. Tonsil samples, HPV− and HPV+ TIL were enriched for specific clusters. Statistical assessment of observed versus expected cell frequencies are detailed in Supplementary Fig. 3. d, e FItSNE plot (d) showing the clusters containing B cells from a, and the gene sets associated with specific functions for each cluster (e). Canonical B cell lineages, including naïve, switched memory, plasma cells and germinal center B cells were recovered. Interestingly, cells from HPV+ patients had GC B cells, while these cells were largely absent from TIL of HPV− patients. HPV− patients had a higher frequency of naïve and memory B cells. f, g FItSNE plot (f) showing the CD4+ helper T cells from a, and a dot plot highlighting the presence of cells with a T follicular-helper signature (cluster 10). h Progression-free survival (PFS) analysis derived from stratification of HNSCC TCGA patients based on enrichment scores for B cell infiltration, GC B cells, and plasma cells. Gene sets used to calculate enrichment scores were derived from our scRNAseq analysis and applied to bulk mRNAseq data from the TCGA (Methods). Cox proportional hazard models using a log-rank test were used for PFS analysis. The shaded regions represent 95% confidence intervals for the survival curves. Survival curves are derived from 111 HNSCC patients from the TCGA. Source data are available as a Source Data file.
Fig. 2
Fig. 2. High-dimensional flow cytometry and immunohistochemistry reveal distinct TIL-B phenotypes and increased tertiary lymphoid structures in HPV+ HNSCC.
a viSNE plots of B cells collected from non-inflamed and inflamed tonsils, HPV+ and HPV− HNSCC TIL and paired PBL (Supplementary Fig. 7) were analyzed using Cytobank. Non-inflamed tonsil (n = 4), inflamed tonsil (n = 6), HPV + HNSCC (n = 3), HPV− HNSCC (n = 2). Bar plot displaying frequencies of GC B cells and plasma cells in non-inflamed tonsil (n = 9), inflamed tonsil (n = 16), HPV+ HNSCC (n = 9), HPV− HNSCC (n = 9). *P = 0.02 Student‘s 2-sided t test. b Bar plot for frequency of B cell subpopulations. Non-inflamed tonsil (n = 9), inflamed tonsil (n = 16), HPV+ HNSCC (n = 12), HPV− HNSCC (n = 13). **P = 0.004, ***P = 0.0009, *P = 0.03, One way ANOVA followed by Tukey’s multiple comparisons test. c Frequencies of T follicular helper (TFH), regulatory T follicular helper (TFHreg), regulatory T cell (Treg), T helper type 1 (TH1) and CD8 T cells in non-inflamed tonsil (n = 6), inflamed tonsils (n = 10), HPV+ TIL (n = 7), HPV− TIL (n = 8). *P = 0.01,**P = 0.009,****P < 0.0001. *P = 0.04, *P = 0.03, ****P < 0.0001. One-way ANOVA followed by Tukey’s multiple comparisons test. d Representative CD20+ IHC on HPV+ and HPV− HNSCC tumors (×4 magnification). e B cell infiltrate counted within tumor bed compared to TLS. Total numbers from n = 50, 25 HPV+, 25 HPV− were graphed. ****P < 0.0001, Student‘s 2-sided t test. f Tumor TLS by site within the oropharynx (tonsil vs. tongue). Total numbers from n = 50, 25 HPV+, 25 HPV− were graphed. **P = 0.0096, Student‘s 2-sided. Data are presented as mean values ± SEM. g Total number of tumor TLS and non-tumor TLS numbers in HPV+ and HPV− disease. Total numbers from n = 50, 25 HPV+, 25 HPV− were graphed. *P = 0.0249, Student‘s 2-sided t test. Data are presented as mean values ± SEM. h Correlation of CD20+ tumor TLS with tumor area. Total tumor area (mm) for each patient tumor was calculated by a pathologist. *P < 0.05, non-parametric Spearman correlation. i Total tumor TLS independently counted for CD20+ and CD4+ (n = 50, 25 HPV+, 25 HPV−). ****P < 0.0001, ***P < 0.001, non-parametric Spearman correlation. j Total CXCR5 was scored for all cell types (n = 50, 25 HPV+, 25 HPV−).**P = 0.0012, Student‘s 2 sided t test. Source data are provided as a Source Data file.
Fig. 3
Fig. 3. Differentially expressed ligands and receptors in HNSCC and modeling of GC differentiation identify SEMA4A as associated with development and maturation of GC.
a Differential expression of ligands by B cells in the TME of HPV– and HPV+ HNSCC. Number of patient samples is the same as Fig. 1. b Number of cells expressing ligands and magnitude of expression in HPV+ TIL-B by cluster. Consistent with GC B cell and formation of TLS, LTB was one of the top expressed ligands across HPV+ TIL-B. SEMA4A expression was largely restricted to clusters 17 and 18, which are GC TIL-B. c Expression of top ligands by HPV− TIL-B included several chemokines (CCL4 and CCL5). d Differential expression of receptors by B cells in the TME of HPV– and HPV+ HNSCC. e Top receptors expressed by HPV+ TIL-B including genes associated with GC function including CD40 and CXCR4. f Top receptors in HPV– B cells included CD63, which is associated with downregulation of CXCR4 and is suppressed by Bcl6. g Diffusion map embedding of B cell associated with a lineage spanning naïve and GC B cells identified by slingshot (Methods). B cells are shown by their clusters identified in Fig. 1, and the line connecting the clusters denotes the differentiation trajectory with increasing pseudotime. h Heatmap showing the top genes that are temporally associated with CD38 expression dynamics during progression from naïve B cells to GC B cells. SEMA4A follows the same expression dynamics as CD38. A total of 1000 cells were randomly sampled from the entire naïve cell to GC B cell dataset for visualization in the heatmap. i Inferred protein-protein interactions from Cytoscape for the top genes that share temporal dynamics with CD38. Nodes represent genes, and edges in the network represent putative protein-protein interactions. BCL6, p53, AKT, and MYC were all inferred to be interacting with proteins encoded by genes that follow the expression dynamics of CD38. All analysis in this figure is derived from all patients in our scRNAseq cohort.
Fig. 4
Fig. 4. SEMA4a expression is increased in GC TIL-Bs in TLS in HNSCC.
a Individual viSNE feature plots demonstrating expression level of canonical markers used to identify B cell subpopulations in Fig. 2a. Number of samples is the same as Fig. 1. Representative flow plot showing traditional flow gating strategy for B cell subsets quantified in Fig. 2a, b and SEMA4a co-expression with BCL6. CD19+CD20+ B cells were gated on CD38 and IgD. CD38+ IgD− (GC B cells) were than gated on SEMA4a and BCL6 b Bar plot showing geometric mean fluorescence intensity (gMFI) of SEMA4A on B cell subsets. Statistical analysis by ordinary one-way ANOVA followed by Tukey’s multiple comparisons test. *P = 0.02 **P = 0.0013, ***P = 0.0007, ***P = 0.0004, ****P < 0.0001 Bar plot showing frequencies of SEMA4A positivity on B cell subsets. c Bar plot comparing the frequency of SEMA4a+ BCL6+ GC B cells. Statistical analysis by ordinary one-way ANOVA followed by Tukey’s multiple comparisons *P = 0.02. d Scatter plot comparing the frequency of SEMA4a+ GC-B cells to SEMA4a+ activated B cells. Statistical analysis by Spearman correlation. **P = 0.002 ***P < 0.001 ns; not significant e Bar plot showing MFI of SEMA4a on dark zone (DZ) and light zone (LZ) GC B cells. Statistical analysis by Student‘s two-sided t test (Mann–Whitney) **P = 0.001. f Scatter plot comparing the frequency of SEMA4a+ light zone GC-B cells to total light zone GC B cells. Statistical analysis by Spearman correlation. *P = 0.02, *P = 0.04, ns; not significant g Representative IHC for BCL6 and SEMA4A in HNSCC patients. BCL6 and Sema4a expression was compared in HPV+ and HPV− HNSCC patients to HD tonsil. Pink arrow is pathological characterization of macrophage. h Confocal imaging of TLS in HPV+ and HPV− tumors compared to GC in HD tonsil. CD20, SEMA4A, and BCL6 were co-localized to visualize co-expression of SEMA4A and BCL6 which mark GC in HD tonsil. Scale bar is 50 µm for all images. Source data are provided as a Source Data file.
Fig. 5
Fig. 5. Cyclical pseudotime modeling of germinal center B cell reactions reveals waves of gene expression.
a FItSNE showing 6 clusters of germinal center B cells (i.e. cells from clusters 17 and 18 from Fig. 1A/D). b Three-dimensional diffusion map embedding of germinal center B cells, with cells colored by their cluster identities from a. Black dots represent the centroid of each cluster, and the lines connecting the black dots represent the circular path through germinal center reactions. c DCs 1 and 3 captured most of the information required to reconstruct the circular trajectory of germinal center B cells (left panel). Pseudotemporal ordering was inferred by fitting the equivalent of a non-parametric principal component from the center of the trajectory using the assumption that the data is on a closed curve (right panel). d Loess regression was used to fit curves for the top 20 differentially expressed genes across GC B cell clusters as a function of pseudotime inferred in c. Genes were found to cluster into three distinct groups by fit with pseudotime. Clusters were defined as dark zone, light zone, and transitional. Analysis in ad is derived from six healthy blood donors, five tonsils, and 27 HNSCC patients. e Marker genes derived from d, with scaled gene expression plotted as a function of time. Blue genes correspond to light zone (LZ) GC B cells, green genes correspond to B cells moving between LZ and dark zone (DZ) GC B cells, and red genes correspond to DZ GC B cells. f Representative flow plot showing gating strategy for LZ, DZ, and TZ populations. CD38+ IgD BCL6+ (GC B cells) were then gated on CXCR4 and CD86. Dark zone (DZ) CXCR4+ CD86, “Transitional” (TZ) (CXCR4+CD86+) and Light zone (LZ) (CXCR4CD86+) were identified. g Representative plots comparing expression of the three distinct GC TIL-B populations, DZ (blue-filled histogram), TZ (black-filled histogram) LZ (pink-filled histogram) h Scatter plots quantifying differences in geometric mean fluorescence intensity of indicated key markers on the three distinct GC B cell populations in tonsils and HPV+ HNSCC. Statistical analysis by ordinary one-way ANOVA followed by Tukey’s multiple comparisons test. *P = 0.02, **P = 0.002, ***P = 0.0002, ****P = < 0.0001. Source data are provided as a Source Data file.
Fig. 6
Fig. 6. Increased TLS with GC within HPV+ HNSCC patients correlate with increased patient survival.
a Annotated tumor section stained for CD20 via single-plex IHC from a HNSCC patient (×20 magnification). Annotations for tumor (intratumoral and peritumoral) and non-tumor areas are indicated. Blue circle =TLS without GC, Pink circle = TLS with GC, Purple square = TIL-B infiltrate within tumor bed. b Representative Vectra staining for TLS with GC within HPV+ and HPV− HNSCC tumors. BOT = base of tongue. c TLS with GC are increased intratumorally (intra) and peritumorally (peri) in HPV+ HNSCC patients. Differences in intra vs. peri TLS with GC trended toward an increase in HPV+ HNSCC patients. Data are presented as mean values ± SEM. d TLS with GC in the tumors of HPV+ and HPV− HNSCC patients correlate with increased patient survival. Cox proportional hazard was used to evaluate overall survival based on high versus low frequencies of TLS with GC and HPV status (p = 0.003, log rank test). The hazard ratio for high versus low TLS with GC was 0.32, and the hazard ratio for HPV+ versus HPV− was 0.27. e Total number of tumor TLS are increased in HPV+ patients that do not progress to secondary disease. Total tumor TLS (via CD20+ staining) were compared by primary disease (1°) vs. primary and secondary disease (1°+2°). n = 50, 25 HPV+, 25 HPV−.*P = 0.0336 and 0.0281, Student’s 2 sided t test. Data are presented as mean values ± SEM. f Total number of tumor TLS are increased in former and current smokers that are also HPV+. Total tumor TLS (via CD20+ staining) were compared in HPV+ patients that were never smokers vs. former or current smokers. Data are presented as mean values ± SEM. g Cell–cell neighborhoods in TLS with GC are distinct compared to TLS without GC (“Methods”). Top panels show a TLS with GC (left) and a TLS without GC (right). Bottom panels show the odds ratio of proximity to other cell types (Methods), with red representing a high probability of interaction with a given cell type and blue a low probability of interaction. Source data are provided as a Source Data file.

References

    1. Ferris RL, et al. Nivolumab for recurrent squamous-cell carcinoma of the head and neck. N. Engl. J. Med. 2016;375:1856–1867. doi: 10.1056/NEJMoa1602252. - DOI - PMC - PubMed
    1. Economopoulou P, Kotsantis I, Psyrri A. The promise of immunotherapy in head and neck squamous cell carcinoma: combinatorial immunotherapy approaches. ESMO Open. 2016;1:e000122. doi: 10.1136/esmoopen-2016-000122. - DOI - PMC - PubMed
    1. Wu X, et al. Application of PD-1 blockade in cancer immunotherapy. Comput. Struct. Biotechnol. J. 2019;17:661–674. doi: 10.1016/j.csbj.2019.03.006. - DOI - PMC - PubMed
    1. Garaud, S. et al. Tumor infiltrating B-cells signal functional humoral immune responses in breast cancer. JCI Insight5, e129641 (2019). - PMC - PubMed
    1. Wood O, et al. Gene expression analysis of TIL rich HPV-driven head and neck tumors reveals a distinct B-cell signature when compared to HPV independent tumors. Oncotarget. 2016;7:56781–56797. doi: 10.18632/oncotarget.10788. - DOI - PMC - PubMed

Publication types

MeSH terms