. 2021 Jun 7;12(1):3364.
doi: 10.1038/s41467-021-23474-5.

Ubiquitylation of MLKL at lysine 219 positively regulates necroptosis-induced tissue injury and pathogen clearance

Affiliations

Ubiquitylation of MLKL at lysine 219 positively regulates necroptosis-induced tissue injury and pathogen clearance

Laura Ramos Garcia et al. Nat Commun. .

Abstract

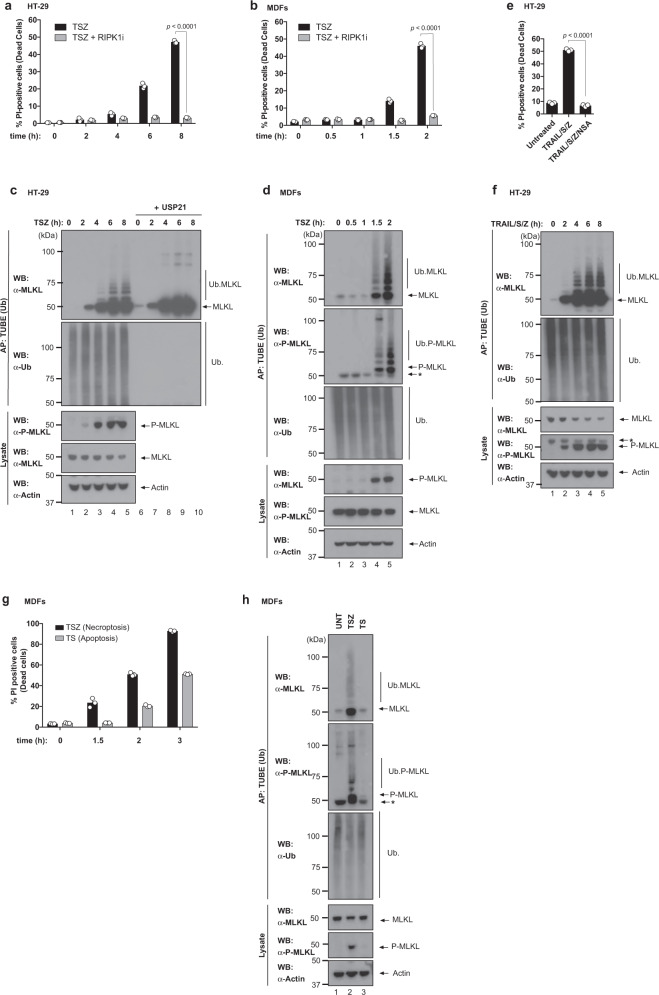
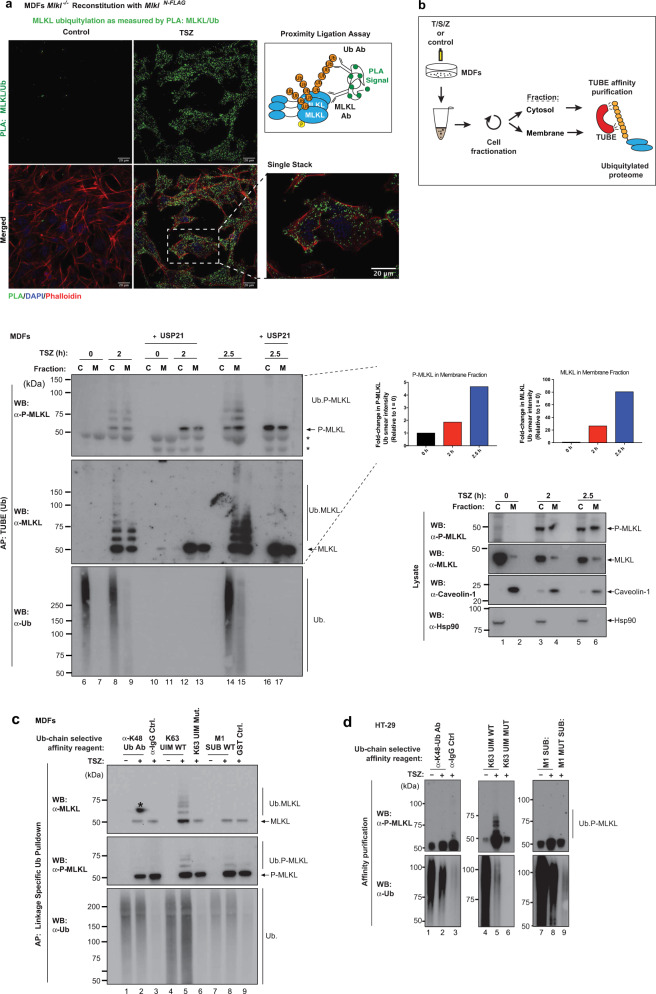
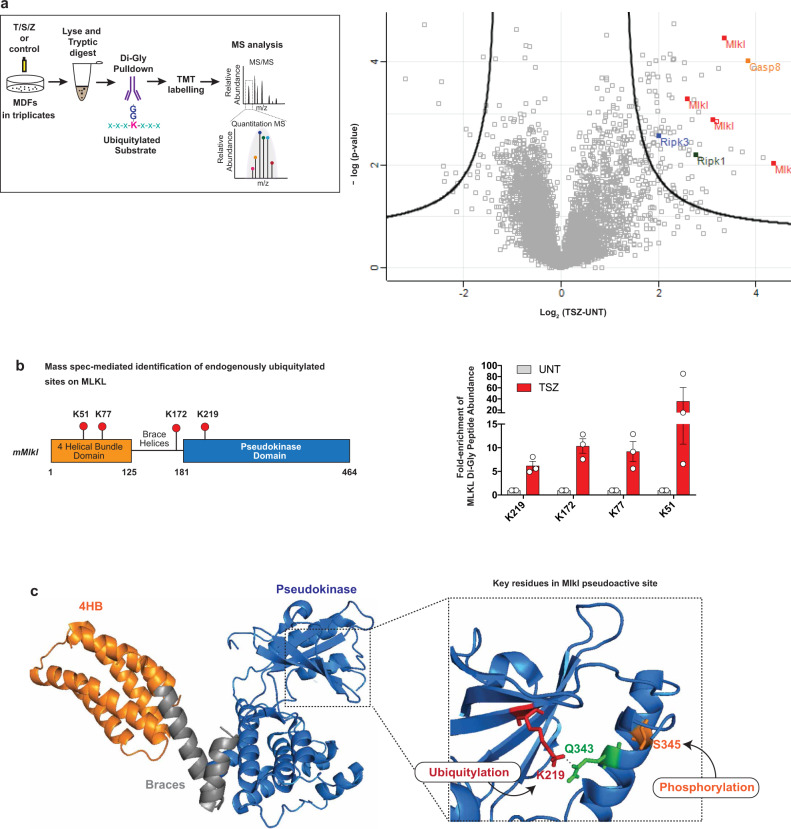
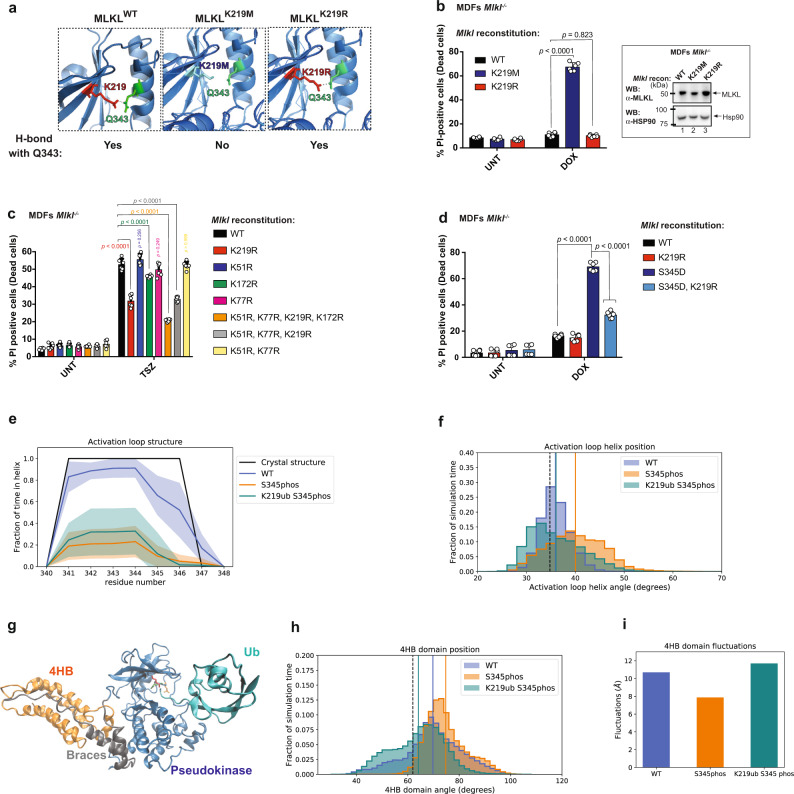
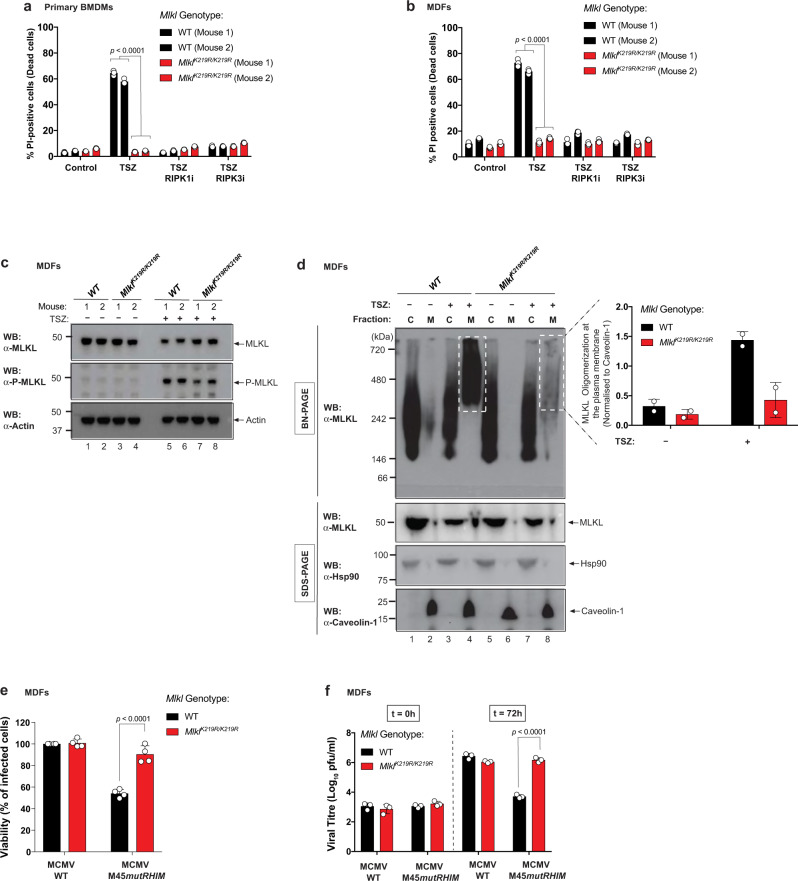
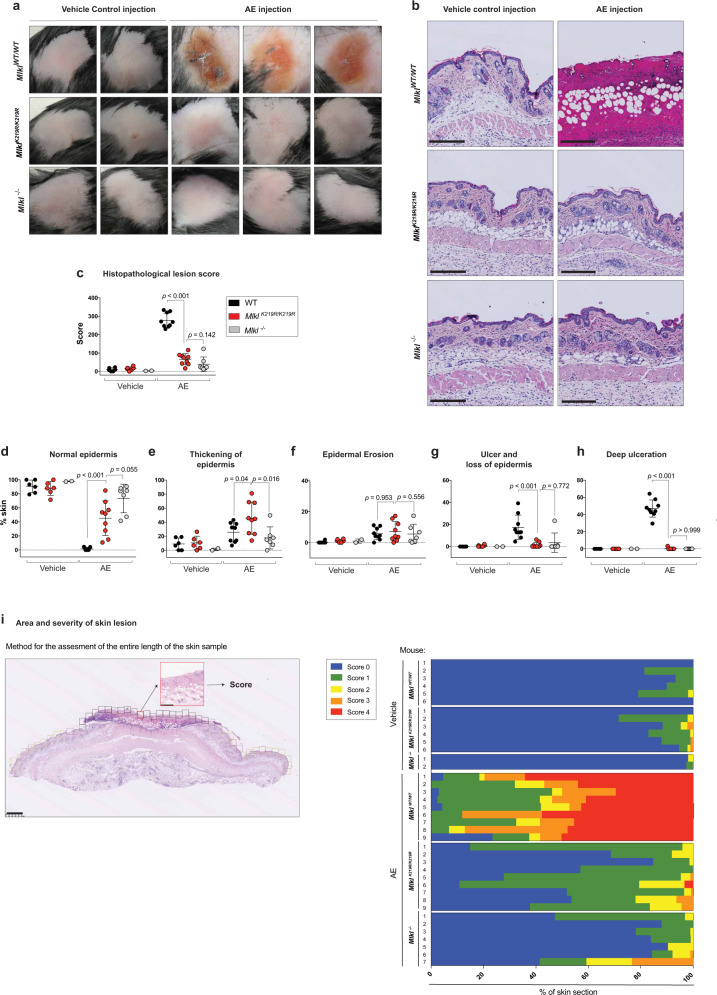
Necroptosis is a lytic, inflammatory form of cell death that not only contributes to pathogen clearance but can also lead to disease pathogenesis. Necroptosis is triggered by RIPK3-mediated phosphorylation of MLKL, which is thought to initiate MLKL oligomerisation, membrane translocation and membrane rupture, although the precise mechanism is incompletely understood. Here, we show that K63-linked ubiquitin chains are attached to MLKL during necroptosis and that ubiquitylation of MLKL at K219 significantly contributes to the cytotoxic potential of phosphorylated MLKL. The K219R MLKL mutation protects animals from necroptosis-induced skin damage and renders cells resistant to pathogen-induced necroptosis. Mechanistically, we show that ubiquitylation of MLKL at K219 is required for higher-order assembly of MLKL at membranes, facilitating its rupture and necroptosis. We demonstrate that K219 ubiquitylation licenses MLKL activity to induce lytic cell death, suggesting that necroptotic clearance of pathogens as well as MLKL-dependent pathologies are influenced by the ubiquitin-signalling system.


Conflict of interest statement

The authors declare no competing interests.

Figures

Fig. 1
Fig. 1. Endogenous MLKL is ubiquitylated during necroptosis.
a Quantification of propidium iodide positive (PI+) HT-29 cells upon treatment with TNF (10 ng/ml), SM-164 (100 nM) and z-VAD-FMK (20 μM; TSZ) in the presence or absence of RIPK1 inhibitor (RIPK1i GSK′963, 100 nM) for the indicated times. b Quantification of PI+ mouse dermal fibroblasts (MDF) treated as in a. c Tandem ubiquitin-binding entities (TUBE) affinity purification (AP) of ubiquitylated proteins from HT-29 cells treated with the indicated agents for the indicated timepoints. Prior to elution from the beads, samples were split in two and incubated with or without 2 μM of USP21. The presence of MLKL ubiquitylation was determined by immunoblot analysis of the eluate using α-MLKL antibody. d TUBE AP of ubiquitylated proteins from MDFs treated with the indicated agents for the indicated timepoints. * refers to non-specific bands. e Quantification of PI+ HT-29 cells upon treatment with TRAIL (50 ng/ml), SM-164 (100 nM) and z-VAD-FMK (20 μM; TRAIL/S/Z) for 8 h in the presence or absence of MLKL inhibitor necrosulfanamide (NSA). f TUBE AP of ubiquitylated proteins from HT-29 cells treated with TRAIL/S/Z. * refers to non-specific bands. g Quantification of PI+ MDF cells treated with TNF and SM-164 in presence or absence of z-VAD-FMK to induce necroptosis (TSZ) or apoptosis (TS), respectively for the indicated times. h TUBE AP of ubiquitylated proteins from MDFs treated to induce necroptosis (TSZ, 2 h) or apoptosis (TS, 3 h). * refers to non-specific bands. In a, b, e and g, n = 3 wells/group. The results are representative of those from two independent experiments with three technical replicates each. Data are presented as mean with error bars indicating standard deviation (SD). Statistical analysis shown was calculated by two-way ANOVA with Sidak’s multiple comparison test in a, b and one-way ANOVA with Sidak’s multiple comparison test in e. Source data are provided as a Source data file. cf, h are representative of ≥1 biological replicates.
Fig. 2
Fig. 2. Ubiquitylation of MLKL requires RIPK3-mediated phosphorylation.
a Schematic depicting the key steps in necroptosis signalling. TNF can drive RIPK1-mediated activation of RIPK3. Active RIPK3 subsequently phosphorylates MLKL to induce MLKL activation. Phosphorylated MLKL trimerises and translocates to membranes where it forms higher-order polymers inducing lytic cell death. b Tandem ubiquitin-binding entities (TUBE) affinity purification (AP) of ubiquitylated proteins from mouse dermal fibroblasts (MDF) treated with TNF (10 ng/ml), SM-164 (100 nM) and z-VAD-FMK (20 μM; TSZ) for 2 h in presence or absence of RIPK1 inhibitor (RIPK1i GSK′963, 100 nM) or RIPK3 inhibitor (RIPK3i GSK′843 2 μM). c TUBE AP of ubiquitylated proteins from WT and Ripk3−/− MDFs treated for 2 h with TSZ. d TUBE AP of ubiquitylated proteins from Mlkl−/− MDFs reconstituted with MlklWT or MlklS345A, and stimulated with TSZ for 2 h. e TUBE AP of ubiquitylated proteins from MDFs treated with TSZ. Prior to elution from the beads, the samples were split in two and either eluted with a sample buffer containing β-mercaptoethanol (reducing condition) or without it (non-reducing condition) to enable visualisation of MLKL trimers. f TUBE AP of ubiquitylated proteins from MDFs treated with TSZ. Before elution, samples were split in two and treated with USP21 or left untreated. Lysates were eluted in non-reducing conditions to visualise MLKL oligomerization. All data are representative of ≥1 biological replicates. In b, c, e and f, * refers to non-specific bands. Source data are provided as a Source data file.
Fig. 3
Fig. 3. MLKL is ubiquitylated prior to plasma membrane localisation.
a Proximity ligation assay (PLA) of Mlkl−/− mouse dermal fibroblasts (MDF) reconstituted with MlklN-FLAG. Cells were treated with TNF (10 ng/ml), SM-164 (100 nM) and z-VAD-FMK (20 μM; TSZ) for 2 h. Right panel, schematic depicting the principle of PLA. Antibodies that detect MLKL and ubiquitin (Ub) were utilised. b MDFs were stimulated with TSZ for the indicated timepoints and subjected to cellular fractionation as described in the ‘Methods’ section. The corresponding cytoplasmic (C) and membrane (M) fractions were subjected to a tandem ubiquitin-binding entities (TUBE) affinity purification (AP). The experimental scheme is depicted. Prior to elution from the beads, the samples were split in two and subsequently left untreated or incubated with USP21. * refers to non-specific bands. Quantification of P-MLKL and total MLKL in the membrane fraction is shown. c Linkage-specific ubiquitin (Ub) AP in MDF stimulated with TSZ for 2 h. The indicated affinity reagents were used to purify the respective Ub chain types. * refers to a developing artefact. d Linkage-specific ubiquitin AP in HT-29 cells treated with TSZ for 6 h. The indicated affinity reagents were used to purify the respective Ub chain types. All results (ad) are representative of those from two independent experiments. Source data are provided as a Source data file.
Fig. 4
Fig. 4. Endogenous MLKL is ubiquitylated on K51, K77, K172 and K219.
a Mass spectrometry (MS)-based identification of ubiquitylated peptides. Left panel: schematic representation of the experimental design. Mouse dermal fibroblasts (MDF) were treated with TNF (10 ng/ml), SM-164 (100 nM) and z-VAD-FMK (20 μM; TSZ) for 2 h or left untreated. Extracted proteins were digested with trypsin and Ub remnants were enriched using an anti-K-ε-GG antibody. Six samples, corresponding to three biological replicates, were labelled with one of the tandem mass tags (TMT) 10-plex. Subsequently, samples were mixed, subjected to identification by LC–MS/MS and quantified using peak area under curve. Right panel: volcano plot of global peptide abundance showing −log p values versus log2 ratio changes between TSZ and untreated control. The three biological replicates were taken into consideration. Peptides corresponding to MLKL, RIPK1, RIPK3 and caspase-8 are indicated. b Schematic diagram depicting the domain architecture of murine MLKL and the identified Ub acceptor lysine (K), left panel. The graph depicts fold enrichment of the respective di-Gly peptide abundance. The result is representative of one independent experiment with three replicates for each treatment group. Data are presented as mean ± the standard error of the mean (SEM). c Crystal structure of murine MLKL (PBD:4BTF) comprising the 4-helix bundle (4HB) domain (orange), the pseudokinase domain (blue) and the brace helices (grey). Magnification of the pseudoactive site of MLKL showing the hydrogen bond interaction between K219 and Q343. Residue S345 that is phosphorylated by RIPK3 is shown in orange.
Fig. 5
Fig. 5. Ubiquitylation at K219 contributes to the cytotoxic potential of MLKL.
a Pymol model depicting the formation of a hydrogen bond in MLKL mutants. b Quantification of propidium iodide positive (PI+) Mlkl−/− mouse dermal fibroblasts (MDFs) reconstituted with the indicated MLKL mutants and treated for 5 h with doxycycline (DOX, 0.1 μg/ml). The corresponding western blot showing MLKL expression is shown on the right panel. c Mlkl−/− MDF were reconstituted with the indicated MLKL ubiquitin mutants. Cells were pre-treated with DOX (0.1 μg/ml for 3 h) and subsequently treated with TNF (10 ng/ml), SM-164 (100 nM) and z-VAD-FMK (20 μM; TSZ) for 2 h or left untreated. d Quantification of PI+ Mlkl−/− MDFs reconstituted with the indicated MLKL mutants and treated for with DOX (0.1 μg/ml for 5 h). In bd n = 6 wells/group. The results are representative of those from two independent experiments with three technical replicates each. Data are presented as mean ± SD. Statistical analysis shown was calculated by two-way ANOVA with Sidak’s multiple comparison test. Source data are provided as a Source data file. e Structure of activation loop residues from molecular dynamics (MD) simulations. Shaded area represents standard deviation calculated from independent simulations and the line represents the mean. f Histogram of angle between the activation loop helix and the adjacent helix in simulations. The black vertical dashed line represents the angle in the crystal structure. Solid vertical lines represent the average angle from the MD simulations for each construct (the lines for the WT and K219ub P-S345phos simulations are overlapping). g Ubiquitylated and phosphorylated MLKL from MD simulations. Shown is the pseudokinase domain (blue), the brace helices (grey), the 4HB domain (orange), the Ub moiety (teal) and residues K219 (red), Q343 (green) and S345 (orange). h Histogram of angle between the 4HB domain and the pseudokinase domain in MD simulations. The black vertical dashed line represents the angle in the crystal structure. Solid vertical lines represent the average angle from the MD simulations for each construct. i Overall fluctuations of the 4HB domain relative to the pseudokinase domain.
Fig. 6
Fig. 6. MlklK219R/K219R knock-in cells are protected from TNF and MCMV-driven necroptosis.
a Quantification of propidium iodide positive (PI+) primary bone marrow-derived macrophages (BMDMs) derived from two MlklWT/WT and MlklK219R/K219R mice. Cell death was measured following treatment with TNF (10 ng/ml), SM-164 (100 nM) and z-VAD-FMK (20 μM; TSZ) for 4 h in presence or absence of RIPK1 inhibitor (RIPK1i GSK′963, 100 nM) or RIPK3 inhibitor (RIPK3i GSK′843 2 μM). b Quantification of PI+ mouse dermal fibroblasts (MDFs) derived from two MlklWT/WT and MlklK219R/K219R mice following treatment as in a. In a, b, n = 3 wells/group. The results are representative of those from two independent experiments with three technical replicates each. Data are presented as mean ± SD. Statistical analysis shown was calculated by two-way ANOVA with Sidak’s multiple comparison test. Data from mice with same genotype was pooled together for the statistical analysis in a and b. c Western blot analysis of MLKL expression in MDFs from two pairs of MlklWT/WT and MlklK219R/K219R mice, following treatment with TSZ for 2.5 h or left untreated. d MLKL oligomerisation analysis. Blue native polyacrylamide gel electrophoresis (BN-PAGE) of the cytoplasmic (C) and membrane (M) fractions of MDFs from MlklWT/WT and MlklK219R/K219R mice, following treatment with TSZ for 2.5 h or left untreated. Shown on the right is the quantification of MLKL oligomers at the plasma membrane from two independent experiments. e Cell viability assay of MlklWT/WT and MlklK219R/K219R MDFs infected with wild-type (WT) and M45 mutant RHIM (M45mutRHIM) murine cytomegalovirus (MCMVWT and MCMVM45mutRHIM). f Measurement of viral growth. MlklWT/WT and MlklK219R/K219R MDFs were infected with the respective virus and the viral titre was determined by plaque assay 72 h post infection. In e and f, n = 4 and 3 wells/group, respectively. The results are representative of those from three independent experiments with three to four technical replicates each. Data are presented as mean ± SD. Statistical analysis shown was calculated by two-way ANOVA with Sidak’s multiple comparison test. Source data are provided as a Source data file.
Fig. 7
Fig. 7. MlklK219R/K219R knock-in mice are protected from necroptosis-driven tissue injury.
a Representative macro images of skin lesions from MlklWT/WT, MlklK219R/K219R and Mlkl−/− mice 72 h after injection with ASTX660/Emricasan (AE) or vehicle control. b Representative images of skin sections treated as in a and stained with H&E. Scale bars, 250 μM. c A final histopathological multivariate lesion score (HLS) of mice treated as described in a. The calculation considered the proportional score (%) of given skin lesions within each sample. This was then multiplied by a power score reflecting lesion severity. Final HLS ‘0’ equals normal/regular epidermis and a HLS of 400 equals 100% deep ulceration. MlklWT/WT vehicle-treated (n = 6), MlklK219R/K219R vehicle-treated (n = 6) and Mlkl−/− vehicle-treated (n = 2). MlklWT/WT AE-treated (n = 9), MlklK219R/K219R AE-treated (n = 9) and Mlkl−/− AE-treated (n = 7). d Percentage contribution of regular epidermis with no changes to stratum corneum, stratum lucidum, stratum granulosum, stratum spinosum, and stratum basale. e Percentage contribution of epidermis thickening with (mild to marked) degree of changes to any of the strata: stratum corneum, stratum lucidum, stratum granulosum, stratum spinosum, stratum basale. f Percentage contribution of epidermal erosion or partial loss of the epidermis, with the stratum basale left intact. g Percentage contribution of ulcer and loss of epidermis, including the stratum basale. h Percentage contribution of ulceration with dermal and hypodermal fibrosis and evidence of cell death. Formation of dense collagenous fibrotic tissue. Extensive necrotic area and the presence of keratotic debris. In graphs ch, the score for each mouse is represented by a single dot. The amount of affected skin was scored from 0 to 100% in graphs dh. Data were collected in two independent experiments. Mean ± SD is shown. Statistical significance by two-sided non-parametric Mann–Whitney test. i Percentage of individual skin characteristics of mice treated as in a. Left panel depicts an example of how each skin section was assessed using the grid. Scale bar, 500 μM. Assessment was performed on the entire length of the skin sample. Two skin sections from each mouse were assessed. Source data are provided as a Source data file.

References

    1. Nailwal H, Chan FK. Necroptosis in anti-viral inflammation. Cell Death Differ. 2019;26:4–13. doi: 10.1038/s41418-018-0172-x. - DOI - PMC - PubMed
    1. Yatim N, Cullen S, Albert ML. Dying cells actively regulate adaptive immune responses. Nat. Rev. Immunol. 2017;17:262–275. doi: 10.1038/nri.2017.9. - DOI - PubMed
    1. Pasparakis M, Vandenabeele P. Necroptosis and its role in inflammation. Nature. 2015;517:311–320. - PubMed
    1. Matthay MA, Ware LB, Zimmerman GA. The acute respiratory distress syndrome. J. Clin. Investig. 2012;122:2731–2740. doi: 10.1172/JCI60331. - DOI - PMC - PubMed
    1. Yuan J, Amin P, Ofengeim D. Necroptosis and RIPK1-mediated neuroinflammation in CNS diseases. Nat. Rev. Neurosci. 2019;20:19–33. doi: 10.1038/s41583-018-0093-1. - DOI - PMC - PubMed

Publication types

MeSH terms