. 2021 Jun 7;12(1):3406.
doi: 10.1038/s41467-021-23494-1.

SARS-CoV-2 RNAemia and proteomic trajectories inform prognostication in COVID-19 patients admitted to intensive care

Affiliations

SARS-CoV-2 RNAemia and proteomic trajectories inform prognostication in COVID-19 patients admitted to intensive care

Clemens Gutmann et al. Nat Commun. .

Abstract

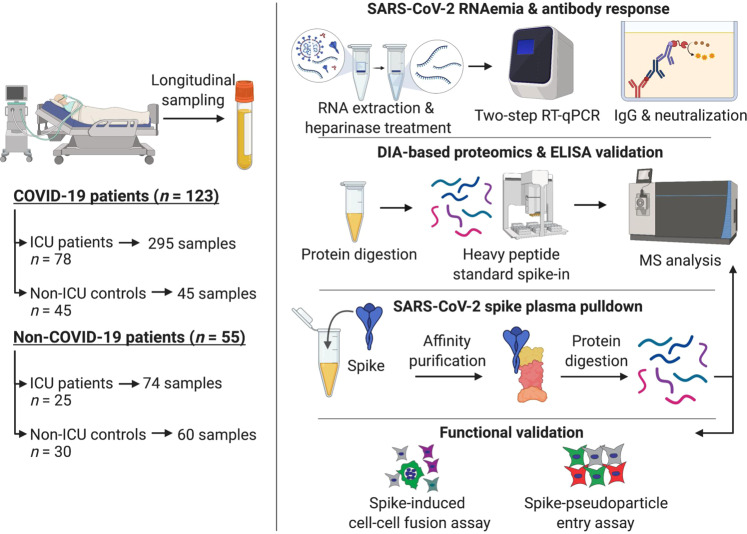
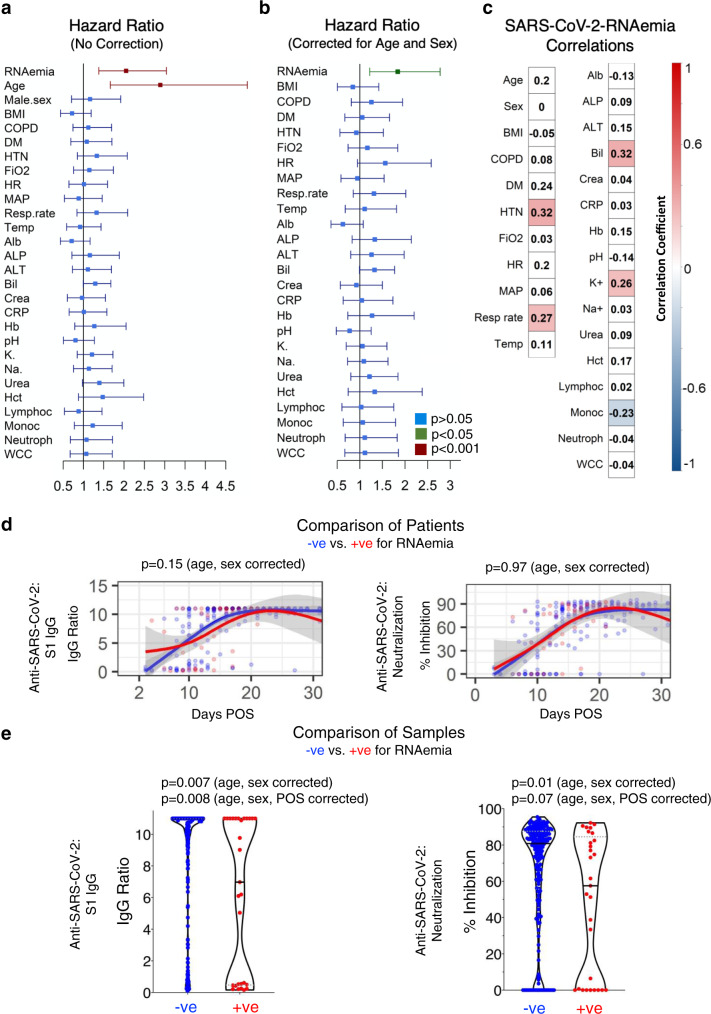
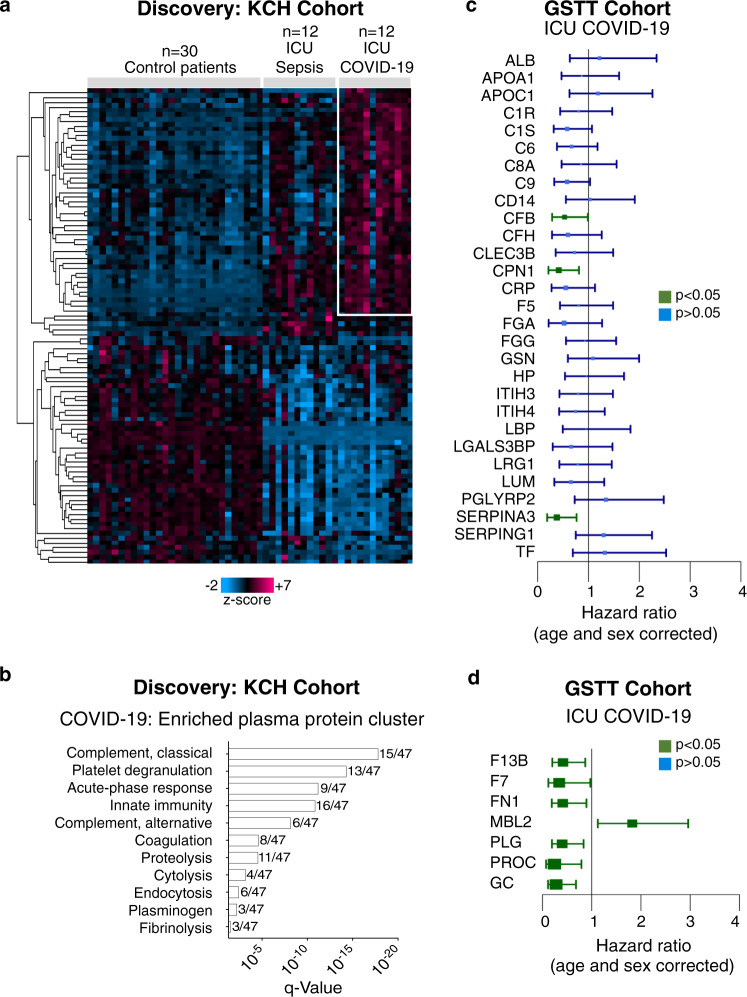
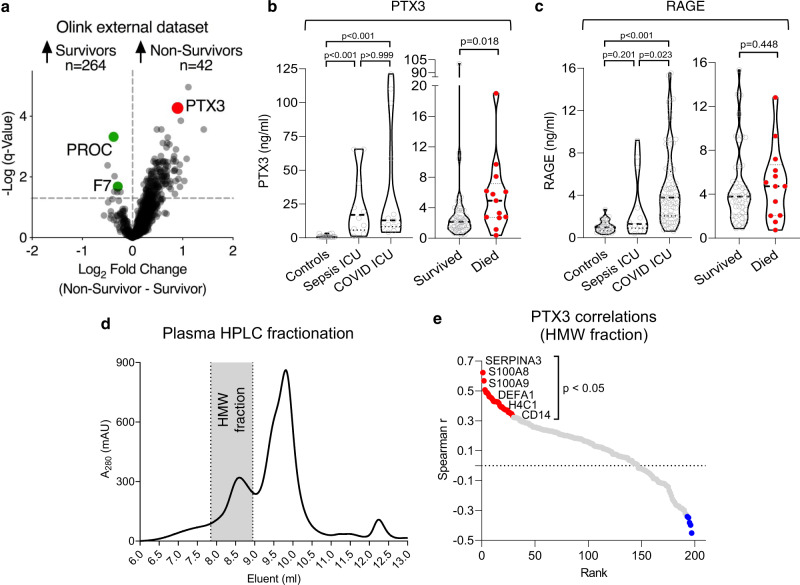
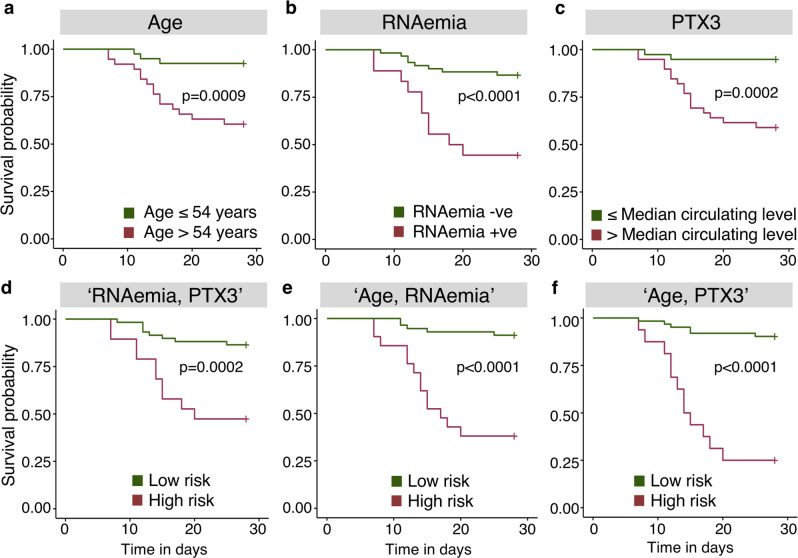
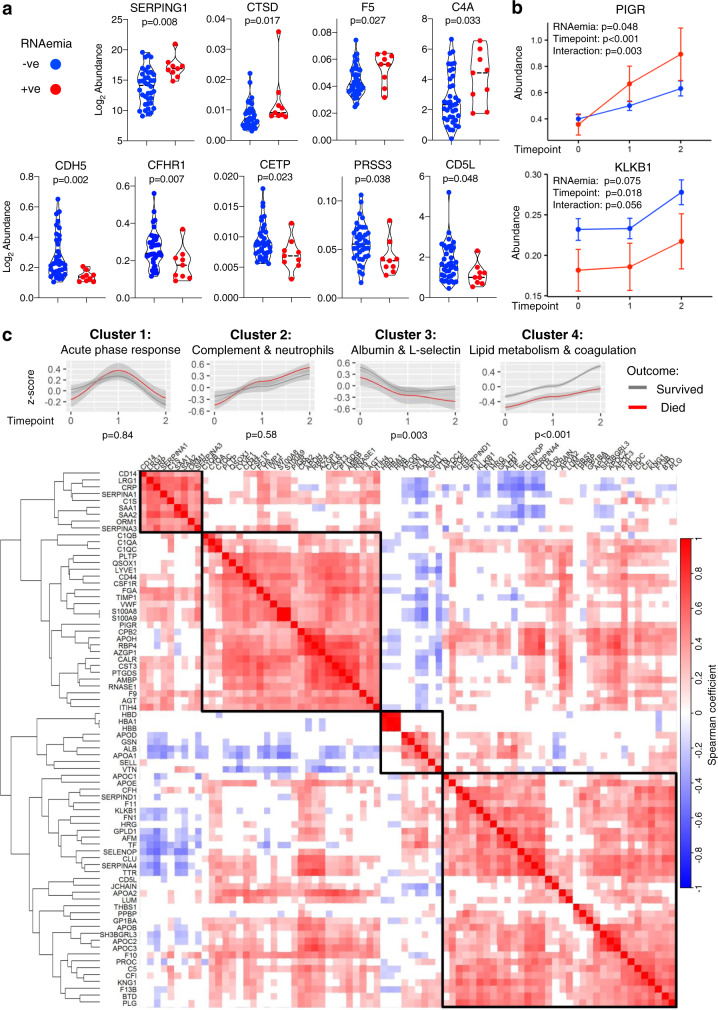
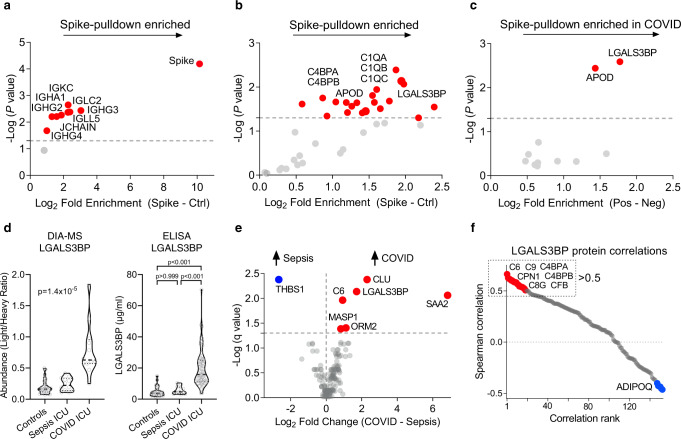
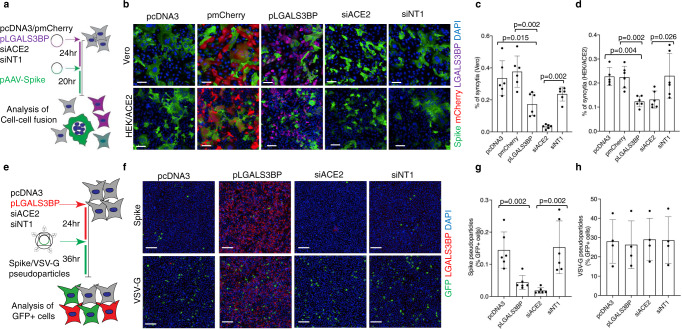
Prognostic characteristics inform risk stratification in intensive care unit (ICU) patients with coronavirus disease 2019 (COVID-19). We obtained blood samples (n = 474) from hospitalized COVID-19 patients (n = 123), non-COVID-19 ICU sepsis patients (n = 25) and healthy controls (n = 30). Severe acute respiratory syndrome coronavirus 2 (SARS-CoV-2) RNA was detected in plasma or serum (RNAemia) of COVID-19 ICU patients when neutralizing antibody response was low. RNAemia is associated with higher 28-day ICU mortality (hazard ratio [HR], 1.84 [95% CI, 1.22-2.77] adjusted for age and sex). RNAemia is comparable in performance to the best protein predictors. Mannose binding lectin 2 and pentraxin-3 (PTX3), two activators of the complement pathway of the innate immune system, are positively associated with mortality. Machine learning identified 'Age, RNAemia' and 'Age, PTX3' as the best binary signatures associated with 28-day ICU mortality. In longitudinal comparisons, COVID-19 ICU patients have a distinct proteomic trajectory associated with mortality, with recovery of many liver-derived proteins indicating survival. Finally, proteins of the complement system and galectin-3-binding protein (LGALS3BP) are identified as interaction partners of SARS-CoV-2 spike glycoprotein. LGALS3BP overexpression inhibits spike-pseudoparticle uptake and spike-induced cell-cell fusion in vitro.


Conflict of interest statement

King’s College London has filed and licensed a patent application with regard to using PTX3 as a biomarker in sepsis. King’s College London has filed a patent application on the methods used to detect SARS-CoV-2 Spike protein-induced syncytia as described in this paper. A.C.H. is a board member and equity holder in ImmunoQure, A.G., and Gamma Delta Therapeutics, and is an equity holder in Adaptate Biotherapeutics.

Figures

Fig. 1
Fig. 1. Schematic of study design.
Plasma and serum samples were obtained from multiple patient cohorts across two UK-based university hospitals, including 123 COVID-19 patients: 78 SARS-CoV-2 positive patients in ICU were sampled at multiple time points over a 2-week period and compared to hospitalized non-ICU SARS-CoV-2 positive patients (n = 45). We used non-COVID-19 ICU patients (n = 25) and patients before undergoing elective cardiac surgery (n = 30) as controls. Patient samples were assessed for SARS-CoV-2 RNAemia, antibody responses, and protein changes in the circulation by data-independent acquisition (DIA) mass spectrometry (MS) analysis. Plasma protein interactions with SARS-CoV-2 spike glycoprotein were determined using a pulldown assay followed by data-dependent acquisition (DDA) MS analysis. Functional effects of  LGALS3BP were assessed in two assays: SARS-CoV-2 spike-mediated cell-cell fusion (syncytia formation) and cell entry through SARS-CoV-2 spike pseudoparticle assays.
Fig. 2
Fig. 2. SARS-CoV-2 RNAemia and the humoral immune response.
a Unadjusted hazard ratios with 95% confidence interval (CI) based on two ICU patient cohorts (n = 60 survivors and n = 18 non-survivors, KCH and GSTT). Green indicates P value < 0.05, maroon indicates P value < 0.001 and blue indicates P value > 0.05. b, Hazard ratios with 95% CI after adjustment for age and sex (n = 60 survivors and n = 18 non-survivors, KCH and GSTT). c Association of SARS-CoV-2 RNAemia with binary variables (Cohen’s Kappa correlation) and continuous variables (point-biserial correlation). Red indicates positive and blue negative correlation with P value < 0.05. Abbreviations: Alb albumin, ALP alkaline phosphatase, ALT alanine aminotransferase, Bil bilirubin, COPD chronic obstructive pulmonary disease, Crea creatinine, CRP C-reactive protein, DM diabetes, Hct hematocrit, Hb hemoglobin, HR heart rate, HTN hypertension, Lymphoc lymphocytes, MAP mean arterial pressure, Monoc monocytes, Neutroph neutrophils, K+ potassium, Resp. rate respiratory rate, Na+ sodium, Temp body temperature, WCC white cell count. d Anti-SARS-CoV-2 spike IgG and anti-SARS-CoV-2 neutralization response based on days post-onset of symptoms (POS) in patients who tested positive (red) or negative (blue) for plasma/serum SARS-CoV-2 RNA within the first 6 ICU days (261 samples from n = 55 RNAemia negative and n = 15 RNAemia positive patients). Lines show fitted generalized additive models (GAM) with gray bands indicating the 95% CI, correcting for age and sex. e Anti-SARS-CoV-2 spike IgG levels and anti-SARS-CoV-2 neutralization capacity in individual samples negative (232 samples) or positive (29 samples) for SARS-CoV-2 RNA (n = 70 patients). Lines inside violin plots show median (continuous line) and interquartile range (dotted lines). Significance was determined through a Mann–Whitney U test. P values are corrected for age, sex, and days POS. All statistical analyses are two-tailed.
Fig. 3
Fig. 3. COVID-19 circulating proteome signature and associations with 28-day mortality.
a Plasma proteome profiling was conducted using a data-independent acquisition–mass spectrometry (DIA-MS) approach with spiked standards for 500 proteins. Hierarchical cluster analysis was conducted upon significantly changing plasma proteins across control patients before elective cardiac surgery (n = 30), ICU patients with sepsis (n = 12), and ICU patients with COVID-19 (n = 12, KCH). The heatmap highlights 47 proteins enriched in COVID-19. Kruskal–Wallis, Benjamini–Hochberg correction q < 0.05. b Gene ontology enrichment analysis was conducted upon these 47 proteins and significantly enriched pathways are represented. c Twenty-nine common proteins cross-referenced against two published proteomic studies, exploring protein markers of COVID-19 severity. The ability of these 29 proteins to predict 28-day mortality was explored in an independent ICU patient cohort (n = 62 patients, GSTT) by DIA–MS, and hazard ratios with 95% CI are shown. d Proteomic analysis by DIA-MS conducted upon the serum samples of the GSTT COVID-19 ICU cohort returned additional candidates that predict 28-day mortality as shown on hazard ratio plots with 95% CI (n = 62 patients, GSTT). Significance was determined through the Mann–Whitney U test, correcting for age and sex and applying the Benjamini-Hochberg procedure. All statistical analyses are two-tailed.
Fig. 4
Fig. 4. External protein marker validation and PTX3 selection.
a PTX3 was among the proteins most strongly associated with poor outcome among 1472 unique plasma proteins (Data provided by the MGH Emergency Department COVID-19 Cohort (Filbin, Goldberg, Hacohen) with Olink Proteomics). Of the 10 proteins we found to be associated with outcome in our DIA–MS data (Fig. 3c, d), PROC and F7 were the only proteins also measured in the external validation data, confirming an inverse association with mortality. The log2FC (adjusted for categorical age) was higher for PTX3: 0.8, adjusted P value = 0.00044 compared with PROC: −0.4, adjusted P value = 0.0006 and F7: −0.3, adjusted P value = 0.03. b PTX3 measurements by ELISA (KCH and GSTT samples for COVID-19-ICU cohorts in left and right panel, respectively). c ELISA measurements for RAGE, as an established marker for ARDS. d High-performance liquid chromatography (HPLC) fractionation of plasma (n = 35-time points from 13 patients, KCH). PTX3-containing high molecular weight (HMW) fraction is shaded in gray. A280 denotes the absorbance of the eluent at 280 nm. e Proteomics analysis of the HMW fraction. Significant Spearman correlations of PTX3 with neutrophil- and macrophage-related proteins. All statistical analyses are two-tailed.
Fig. 5
Fig. 5. SARS-CoV-2 mortality prediction using machine learning.
a Kaplan–Meier plot for age (using the median age of 54 years). b Kaplan–Meier plot for SARS-CoV-2 RNAemia. As a single predictor, RNAemia provides the best stratification for survival. c Kaplan–Meier plot for PTX3 using the median levels of serum or plasma. df Kaplan–Meier plots for “RNAemia, PTX3”, “Age, RNAemia”, and “Age, PTX3” combined using support vector machine with radial basis function kernel (SVM RBF), a non-linear machine learning model. The machine learning model selected binary combinations of “Age, RNAemia” and “Age, PTX3” as the best predictors. Kaplan–Meier analysis is two-tailed. Nonsurvivors: n = 18; survivors: n = 60.
Fig. 6
Fig. 6. Circulating protein changes associated with SARS-CoV-2 RNAemia over time.
a DIA–MS analysis upon serum samples from the GSTT COVID-19 ICU cohort was used to determine proteins that associate with the presence of SARS-CoV-2 RNAemia at baseline (n = 9 positive, n = 38 negative). Proteins that were significantly associated with RNAemia at baseline are individually represented as violin plots. Significance was determined through the Limma linear model analysis using Benjamini and Hochberg’s FDR correction. b Proteins with significantly different trajectories over time (baseline, week 1—time point 1, week 2—time point 2) between RNAemia positive and negative patients (n = 9 positive patients, n = 38 negative patients with samples in each of the three-time points, totaling n = 141 samples). PIGR polymeric immunoglobulin receptor, KLKB1 kallikrein B1. The median and 95% CI of the median is shown. Unadjusted for multiple comparisons. c Serial serum samples from COVID-19 ICU patients (GSTT, baseline, week 1 and week 2, n = 10 nonsurvivors, n = 37 survivors with samples in each time point, totaling 141 samples) were analyzed by DIA–MS to determine protein changes over time in ICU. The heat map represents a hierarchical cluster analysis conducted upon a Spearman correlation network of significantly changing proteins over time in ICU, applying row-wise corrections for multiple testing using the Benjamini-Hochberg FDR correction. Comparison of the trajectories of protein clusters in COVID-19 ICU patients based on 28-day mortality is also shown. Gene ontology enrichment analysis was used to determine functional pathways associated with the distinct protein clusters identified. Listed are the protein clusters that show a significant change between 28-day survivors (gray) and nonsurvivors (red)—and having significant interaction with time points (baseline, week 1—time point 1, week 2—time point 2). Lines show nonlinear regression curves with gray bands indicating the 95% CI. P values represent the significance of the outcome term in a fitted GAM model when correcting for age and sex. All statistical analyses are two-tailed.
Fig. 7
Fig. 7. LGALS3BP interacts with SARS-CoV-2 spike glycoprotein.
a Magnetic bead-based affinity isolation of binding partners using His-tagged SARS-CoV-2 spike glycoprotein as a bait for proteins in SARS-CoV-2-positive patient plasma (n = 8). Volcano plot depicting significantly enriched constant chains of immunoglobulins. b Volcano plot depicting significantly enriched non-immunoglobulin proteins (n = 8). c Comparison of SARS-CoV-2 spike glycoprotein pulldown using plasma from COVID-19 ICU patients (n = 8) and non-COVID-19 patients (n = 3). Significance was determined by paired Student’s t tests for (a) and (b) and unpaired Student’s t tests for (c). d LGALS3BP levels across three patient cohorts as determined by DIA-MS or ELISA: control patients before undergoing elective cardiac surgery (n = 30), pre-pandemic sepsis ICU patients (n = 12) and COVID-19 ICU patients (n = 74). Kruskal–Wallis and Dunn’s multiple comparisons tests were used to determine statistical significance. e Volcano plot representing protein changes between baseline plasma samples from patients in ICU with either sepsis (n = 12) or COVID-19 (n = 12). Significance was determined through the Mann–Whitney U test with Benjamini-Hochberg’s FDR correction. f Plasma proteins correlating to LGALS3BP after age and sex corrections in COVID-19 ICU patients (n = 12) are highlighted by a Spearman correlation matrix across the proteomic dataset. Proteins with a Spearman correlation coefficient greater than 0.5 were used for gene ontology pathway enrichment analysis (Supplementary Fig. 10). All statistical analyses are two-tailed.
Fig. 8
Fig. 8. LGALS3BP overexpression impairs SARS-CoV-2 spike-mediated syncytia formation and cellular uptake of SARS-CoV-2 spike-pseudoparticles.
a Schematic representation of the SARS-CoV-2 spike-mediated cell-cell fusion assay. b–d Vero and HEK293-ACE2 cells were transfected either with pcDNA3 (plasmid backbone), pmCherry (plasmid coding mCherry), pLGALS3BP (plasmid coding LGALS3BP), siACE2 (siRNA targeting ACE2), or siNT1 (non-targeting siRNA), followed by transfection of pAAV-Spike (plasmid coding SARS-CoV-2 spike) 24 h later. After 20 h, cells were stained with anti-LGALS3BP (violet), anti-Spike (green), and DAPI for nuclei (blue). Representative images are shown in (b), and quantifications are shown in (c) for Vero cells and in (d) for HEK293-ACE2 cells. Data (mean ± standard deviation; n = 6; Mann–Whitney U test) are plotted as the percentage of fused cells (syncytia) normalized to the total number of cells. Scale bars in (b) represent 100 µm. e Schematic representation of the SARS-CoV-2 spike/VSV-G pseudoparticle transduction assay. fh HEK293-ACE2 cells were transfected either with pcDNA3, pLGALS3BP, siACE2, or siNT1, followed by the addition of spike- or VSV-G pseudoparticles carrying a GFP reporter 24 h later. After 36 h, cells were stained with anti-LGALS3BP (red), anti-GFP (green), and DAPI for nuclei (blue). Representative images are shown in (f) and quantifications are shown in (g) for spike-pseudoparticles (mean ± standard deviation; n = 6; Mann–Whitney U test) and in (h) for VSV-G pseudoparticles (mean ± standard deviation; n = 3). Data are plotted as the percentage of GFP-positive cells normalized to the total number of cells. Scale bars in (f) represent 200 µm. All statistical analyses are two-tailed.

Similar articles

  • Biodistribution and serologic response in SARS-CoV-2 induced ARDS: A cohort study.
    Schlesinger T, Weißbrich B, Wedekink F, Notz Q, Herrmann J, Krone M, Sitter M, Schmid B, Kredel M, Stumpner J, Dölken L, Wischhusen J, Kranke P, Meybohm P, Lotz C. Schlesinger T, et al. PLoS One. 2020 Nov 24;15(11):e0242917. doi: 10.1371/journal.pone.0242917. eCollection 2020. PLoS One. 2020. PMID: 33232382 Free PMC article.
  • Recognition and inhibition of SARS-CoV-2 by humoral innate immunity pattern recognition molecules.
    Stravalaci M, Pagani I, Paraboschi EM, Pedotti M, Doni A, Scavello F, Mapelli SN, Sironi M, Perucchini C, Varani L, Matkovic M, Cavalli A, Cesana D, Gallina P, Pedemonte N, Capurro V, Clementi N, Mancini N, Invernizzi P, Bayarri-Olmos R, Garred P, Rappuoli R, Duga S, Bottazzi B, Uguccioni M, Asselta R, Vicenzi E, Mantovani A, Garlanda C. Stravalaci M, et al. Nat Immunol. 2022 Feb;23(2):275-286. doi: 10.1038/s41590-021-01114-w. Epub 2022 Jan 31. Nat Immunol. 2022. PMID: 35102342
  • Viral RNA load in plasma is associated with critical illness and a dysregulated host response in COVID-19.
    Bermejo-Martin JF, González-Rivera M, Almansa R, Micheloud D, Tedim AP, Domínguez-Gil M, Resino S, Martín-Fernández M, Ryan Murua P, Pérez-García F, Tamayo L, Lopez-Izquierdo R, Bustamante E, Aldecoa C, Gómez JM, Rico-Feijoo J, Orduña A, Méndez R, Fernández Natal I, Megías G, González-Estecha M, Carriedo D, Doncel C, Jorge N, Ortega A, de la Fuente A, Del Campo F, Fernández-Ratero JA, Trapiello W, González-Jiménez P, Ruiz G, Kelvin AA, Ostadgavahi AT, Oneizat R, Ruiz LM, Miguéns I, Gargallo E, Muñoz I, Pelegrin S, Martín S, García Olivares P, Cedeño JA, Ruiz Albi T, Puertas C, Berezo JÁ, Renedo G, Herrán R, Bustamante-Munguira J, Enríquez P, Cicuendez R, Blanco J, Abadia J, Gómez Barquero J, Mamolar N, Blanca-López N, Valdivia LJ, Fernández Caso B, Mantecón MÁ, Motos A, Fernandez-Barat L, Ferrer R, Barbé F, Torres A, Menéndez R, Eiros JM, Kelvin DJ. Bermejo-Martin JF, et al. Crit Care. 2020 Dec 14;24(1):691. doi: 10.1186/s13054-020-03398-0. Crit Care. 2020. PMID: 33317616 Free PMC article.
  • Quantitative assessment of SARS-CoV-2 RNAemia and outcome in patients with coronavirus disease 2019.
    Tang K, Wu L, Luo Y, Gong B. Tang K, et al. J Med Virol. 2021 May;93(5):3165-3175. doi: 10.1002/jmv.26876. Epub 2021 Mar 1. J Med Virol. 2021. PMID: 33590923 Free PMC article.
  • Structural Evaluation of the Spike Glycoprotein Variants on SARS-CoV-2 Transmission and Immune Evasion.
    Salleh MZ, Derrick JP, Deris ZZ. Salleh MZ, et al. Int J Mol Sci. 2021 Jul 10;22(14):7425. doi: 10.3390/ijms22147425. Int J Mol Sci. 2021. PMID: 34299045 Free PMC article. Review.

Cited by

References

    1. Knaus WA, Draper EA, Wagner DP, Zimmerman JE. APACHE II: a severity of disease classification system. Crit. Care Med. 1985;13:818–829. doi: 10.1097/00003246-198510000-00009. - DOI - PubMed
    1. Vincent JL, et al. The S. O. F. A. (Sepsis-related Organ Failure Assessment) score to describe organ dysfunction/failure. On behalf of the Working Group on Sepsis-Related Problems of the European Society of Intensive Care Medicine. Intensive Care Med. 1996;22:707–710. doi: 10.1007/BF01709751. - DOI - PubMed
    1. Sinha, P. et al. Prevalence of phenotypes of acute respiratory distress syndrome in critically ill patients with COVID-19: a prospective observational study. Lancet Respir. Med. 8, 1209–1218 (2020). - PMC - PubMed
    1. Zou X, et al. Acute physiology and chronic health evaluation II score as a predictor of hospital mortality in patients of coronavirus disease 2019. Crit. Care Med. 2020;48:e657–e665. doi: 10.1097/CCM.0000000000004411. - DOI - PMC - PubMed
    1. Intensive Care National Audit And Research Centre. ICNARC Report on COVID-19 in Critical Care 31 July 2020. (2020).

Publication types

MeSH terms