. 2021 Jun 7;12(1):3328.
doi: 10.1038/s41467-021-23218-5.

The steroid-hormone ecdysone coordinates parallel pupariation neuromotor and morphogenetic subprograms via epidermis-to-neuron Dilp8-Lgr3 signal induction

Affiliations

The steroid-hormone ecdysone coordinates parallel pupariation neuromotor and morphogenetic subprograms via epidermis-to-neuron Dilp8-Lgr3 signal induction

Fabiana Heredia et al. Nat Commun. .

Abstract

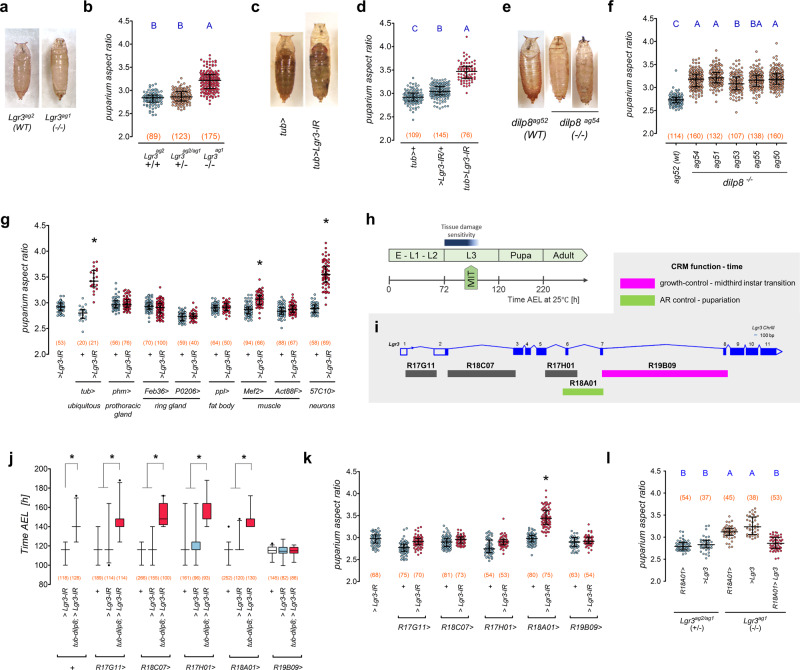
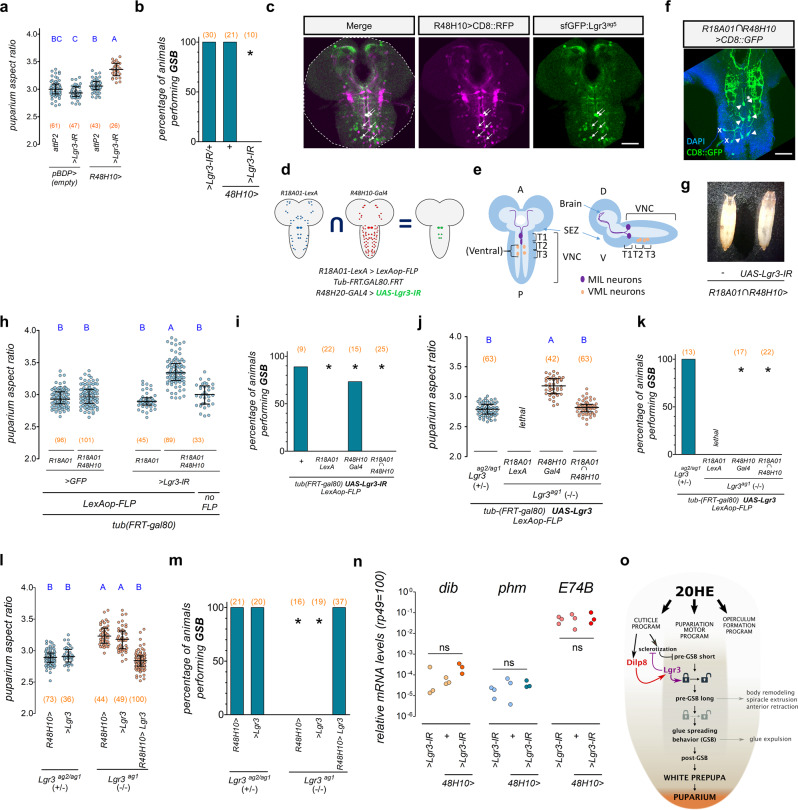
Innate behaviors consist of a succession of genetically-hardwired motor and physiological subprograms that can be coupled to drastic morphogenetic changes. How these integrative responses are orchestrated is not completely understood. Here, we provide insight into these mechanisms by studying pupariation, a multi-step innate behavior of Drosophila larvae that is critical for survival during metamorphosis. We find that the steroid-hormone ecdysone triggers parallel pupariation neuromotor and morphogenetic subprograms, which include the induction of the relaxin-peptide hormone, Dilp8, in the epidermis. Dilp8 acts on six Lgr3-positive thoracic interneurons to couple both subprograms in time and to instruct neuromotor subprogram switching during behavior. Our work reveals that interorgan feedback gates progression between subunits of an innate behavior and points to an ancestral neuromodulatory function of relaxin signaling.


Conflict of interest statement

The authors declare no competing interests.

Figures

Fig. 1
Fig. 1. Puparium morphogenesis requires Dilp8-Lgr3 signaling in neurons.
a Representative photos of puparia from the depicted genotypes. b Lgr3 mutation increases puparium aspect ratio (AR). Shown are dot plots of puparium AR. c Representative photos of puparia from the depicted genotypes. d Ubiquitous Lgr3 knockdown with tubulin-GAL4 (tub > ) (tub > Lgr3-IR) increases puparium AR. Shown are dot plots of puparium AR. e Representative photos of puparia from the depicted genotypes. f dilp8 mutation increases puparium AR. Shown are dot plots of puparium AR. g Pan-neuronal Lgr3 knockdown (57C10 > ) increases puparium AR similarly to ubiquitous knockdown (tub > ). Shown are dot plots of puparium AR. h Sensitivity to tissue-damage-induced Dilp8 occurs before the midthird instar transition (MIT). Time after egg laying (AEL). i Lgr3 locus scheme with its cis-regulatory modules (CRM) and known activities. j tub-dilp8-induced developmental delay rescue by R19B09 > Lgr3-IR. Box plots showing pupariation time. k Knockdown of Lgr3 in R18A01, but not in R19B09 neurons, increases the puparium AR. Shown are dot plots of puparium AR. l Rescue of the puparium AR defect of Lgr3ag1 mutants by R18A01 > Lgr3. Shown are dot plots of puparium AR. Statistics (full details in Supplementary Table 2): b, d, f, g, k, l Dots: one animal. Horizontal bar, median. Error bars: 25-75% percentiles. j Box, 25–75%; horizontal bar, median; whiskers, 5-95%. Dots, outliers. b, d, f, l Same blue letter, P > 0.05. b, d, f, l Dunn’s test. g, j, k Dunn’s test, compared to both >Lgr3-IR and respective GAL4 > + control. (N) Number of animals (orange). *P < 0.05.
Fig. 2
Fig. 2. Ecdysone induces a conserved dilp8 expression peak in the cuticle epidermis during pupariation.
a dilp8 transcription peaks at pupariation. Shown are dot plots of qRT-PCR estimations of dilp8 mRNA levels. b dilp8 transcripts are enriched in the white-prepupa (WPP) carcass (integument and body wall muscles). Shown are dot plots of qRT-PCR estimations of dilp8 mRNA levels. c dilp8 and d pale mRNA levels in carcasses treated with 20HE or etOH in vitro. Shown are dot plots of qRT-PCR estimations of mRNA levels of each gene. e Representative photos of puparia from the depicted genotypes. f Knockdown of EcR in epidermal cells with A58 > and Eip71CD > , but not in fat body with ppl > , increases puparium aspect ratio (AR). Shown are dot plots of puparium AR. g Knockdown of EcR in epidermal cells with A58 > and Eip71CD > , but not in fat body with ppl > , reduces dilp8 mRNA expression at the WPP T0 stage. Shown are dot plots of qRT-PCR estimations of dilp8 mRNA levels. h Knockdown of EcR in epidermal cells with A58 > , but not in fat body with ppl > , supresses 20HE-dependent dilp8 transcription in isolated carcasses. Shown are dot plots of qRT-PCR estimations of dilp8 mRNA levels. i C. capitata ilp8 (cilp8) is transiently strongly expressed at WPP T0. Shown are dot plots of qRT-PCR estimations of cilp8 mRNA levels. j In situ hybridization with cilp8 antisense probes stains epidermal cells on C. capitata WPP T0 carcasses. Representative image of at least 3 animals per condition. Statistics (full details in Supplementary Table 2): a, b, c, d, g–i Dots: biological repeats f Dots: one animal. Horizontal bar, median. Error bars: 25-75% percentiles. a, b, f, h, i Same blue letter, P > 0.05. a, b, h, i Student-Newman-Keuls test. f Dunn’s test. g Holm-Sidak test. c, d Student’s t-test. *P < 0.05. (N) Number of animals (orange). Scale bar, 50 µm.
Fig. 3
Fig. 3. dilp8 is required in the cuticle epidermis during pupariation for puparium morphogenesis and viability.
a dilp8 temporal rescue scheme. b dilp8 expression after the midthird instar transition (tub > dilp8WT at 30 °C) does not delay pupariation time. Shown are dot plots of time to pupariation. c dilp8 expression after the midthird instar transition rescues the puparium aspect ratio (AR) of dilp8 mutants. Dot plots showing puparium AR. d Representative photos of puparia from the depicted genotypes. e Knockdown of dilp8 using combined epidermal drivers increases the aspect ratio of puparia. The same batch of A58 > / + and Eip71CD > /+  control animals were used for Fig. 2f. Dot plots showing puparium AR. f Percentage of viable pupae (green) with and without anterior retraction (AntRet) defects. Failure in AntRet decreases pupal viability. Statistics (full details in Supplementary Table 2): b, c, e Dots: one animal. Horizontal bar, median. Error bars: 25-75% percentiles. b, c Dunn’s test. e Conover’s test. b, c, e Same blue letter, P > 0.05. (N) Number of animals (orange).
Fig. 4
Fig. 4. Dilp8 is critical for progression of the pupariation motor program.
a Muscle calcium (mhc»GCaMP) fluctuations of a single WT (dilp8 +/−) larva (whole-body measurement, blue). Pupariation motor program (PMP). b Speed (black), and distance traveled by (red) the same larva depicted in a. c PMP in (a) and its specific stages. Shown are mhc»GCaMP (blue) and aspect ratio (AR-GCaMP, green) fluctuations. d Scheme describing the parameters measured for the pre-GSB contractions. e Dot plots showing the number of pre-GSB contractions of WT (dilp8+/−) and dilp8 mutant (dilp8−/−) animals. f–h Dot plots showing the average f duration, g amplitude, and h period of pre-GSB contractions in WT and dilp8 mutants. i Time-lapse of GCaMP oscillations during a WT pre-GSB contraction. Anteriormost segments are initially extruded (arrowhead) by the strong whole-body contraction and subsequently internalized by the activation of ventral longitudinal muscles (arrows). Representative profile from 3 recorded animals. j An example of muscle calcium (mhc»GCaMP) fluctuation (blue) and aspect ratio (AR-GCaMP, green) fluctuations of a dilp8 mutant animal that showed pre-GSB-like contractions and one that k did not show any detectable pre-GSB contractions. l dilp8 mutants fail to increase the duration of the pre-GSB contractions with time. Shown are dot plots of the duration of the first and last two pre-GSB contractions of WT and dilp8 mutants. Statistics (full details in Supplementary Table 2): e–h, l Dot: average per larva. Horizontal bar, median. Error bars: 25-75%. e, g, h Mann–Whitney Rank sum test. f Student’s t-test. l Dunn’s test. Same blue letters, P > 0.05. *P < 0.05. P = 0.76 in e (excluding animals with no contractions). (N) Number of animals (orange). Scale bar, 1 mm.
Fig. 5
Fig. 5. Dilp8-Lgr3 pathway is required for glue expulsion and spreading behavior.
a dilp8 and Lgr3 mutants do not perform GSB. Shown is the percentage of animals of the depicted genotypes that perform GSB. b Photo time-series of GSB and its two phases (ventral tetanus and visible GSB) in a larva expressing the salivary gland glue protein Sgs3::GFP (green) as a marker for glue (arrow, and descending white arrowhead marking progression of glue spreading towards the larval posterior, bottom). Representative images of 3 animals (see also Supplementary Videos 3, 5-7). c Dot blots showing the duration of GSB and d post-GSB in control animals of the depicted genotypes. e dilp8 and Lgr3 mutants do not perform post-GSB. Shown is the percentage of animals of the depicted genotypes that perform post-GSB. f Knockdown of Lgr3 in R18A01 > neurons or R18A01 > alone, but not in R19B09 > , impedes GSB. Shown is the percentage of animals of the depicted genotypes that perform GSB. g Expression of UAS-Lgr3 (>Lgr3) in R18A01 > neurons partially rescues the GSB defect of Lgr3 mutants. Shown is the percentage of animals of the depicted genotypes that perform GSB. h GSB is rescued in dilp8 mutants by expression of Dilp8 after the midthird instar transition. Shown is the percentage of animals of the depicted genotypes that perform GSB. i RNAi knockdown of dilp8 using combined epidermal drivers (A58 > + Eip71CD > ), but not each one alone, disrupts GSB in a fraction of animals. Shown is the percentage of animals of the depicted genotypes that perform GSB. j dilp8 and Lgr3 mutants fail to expulse glue (Sgs3::GFP, green). k Quantification of j. Shown is the percentage of animals of the depicted genotypes that perform glue expulsion. Statistics (full details in Supplementary Table 2): a, e-i, k Binomial tests with Bonferroni correction. f Fisher’s Exact Test (magenta line). c, d Dots, one larvae. Horizontal bar, median. Error bars, 25-75%. *P < 0.05. ns, non-significant (P > 0.05). (N) Number of animals (orange). Scale bar, 1 mm.
Fig. 6
Fig. 6. Pupariation progression by coupling morphogenetic and neuromotor subprograms.
a dilp8-mutant puparium aspect ratio (AR) fluctuations are briefer than muscle calcium (mhc»GCaMP) fluctuations during pupariation. Shown are dot plots of PMP duration in dilp8 mutants (−/−) and controls (+/−) according to variation in puparium AR (AR-var) or mhc»GCaMP (GCaMP-var). dilp8(−/) is dilp8ag52/ag54. dilp8(+/) is dilp8ag52/ag54. b Post-midthird instar transition-expression of tub > dilp8 delays tanning. Shown are dot plots of the time from GSB to tanning. Red dots, animals performing two GSBs. c Cuticle sclerotization and tanning pathway. mDopa, ɑ-methyldopa. d Photos of puparia. Effects of ɑ-methyldopa. e Quantification of d for dilp8 and f Lgr3 mutants and controls. Shown are dot plots of puparium AR. g ɑ-methyldopa treatment does not rescue GSB of dilp8 or Lgr3 mutants. Shown is the percentage of animals of the depicted genotypes that perform GSB. h ɑ-methyldopa treatment does not rescue the average duration of pre-GSB contractions of dilp8 mutants. Shown are dot plots of the average pre-GSB contraction duration. i Model for the Dilp8-Lgr3-dependent modulation of pre-GSB. j dilp8 mRNA levels increase 5 min after GSB. Shown are qRT-PCR estimations of dilp8 mRNA levels in WT animals. Statistics (full details in Supplementary Table 2): a, b, e, f, j Dots: one animal. h Dots: average per animal. a, e, f, h Horizontal bar, median. Error bars, 25-75%. a, e, h Student–Neuwan–Keuls test. f Dunn’s test. b, j Mann–Whitney Rank sum test. g Binomial tests with Bonferroni correction. a, e, f-h Same blue letters, P > 0.05. *P < 0.05. (N) Number of animals (orange).
Fig. 7
Fig. 7. Lgr3 is required in six thoracic interneurons for PMP progression.
a Lgr3 knockdown in R48H10 > neurons increases puparium aspect ratio (AR). Shown are dot plots of puparium AR. b Lgr3 knockdown in R48H10 > neurons impedes GSB. Shown is the percentage of animals of the depicted genotypes that perform GSB. > Lgr3-IR/ + data, same as Fig. 5f. c Six thoracic (6VNC) interneurons (white arrows) co-express R48H10 > CD8::RFP (magenta) and sfGFP::Lgr3ag5 (anti-GFP, green). d R18A01 ∩ R48H10 intersectional genetics system. e Cartoon of the 6VNC R18A01 ∩ R48H10 neurons. SEZ, subesophageal zone. T1-3, thoracic segments. f 6VNC neurons (arrowheads) express R18A01 ∩ R48H10 > CD8::GFP (green). DAPI, blue. Asterisk, non-visible MIL neuron. X, non-reproducible cells. g Photos of control and R18A01 ∩ R48H10 > Lgr3-IR puparia. h R18A01 ∩ R48H10 > Lgr3-IR increases puparium AR. Shown are dot plots of puparium AR. Quantification of (g). i R18A01 ∩ R48H10 > Lgr3-IR abrogates GSB. R18A01-LexA (R18A01») alone abrogates GSB. Shown is the percentage of animals of the depicted genotypes that perform GSB. j Lgr3 expression (UAS-Lgr3) in R18A01 ∩ R48H10 neurons rescues puparium AR in Lgr3 mutants. Shown are dot plots of puparium AR. k Lgr3 expression in R18A01 ∩ R48H10 neurons does not rescue GSB. Shown is the percentage of animals of the depicted genotypes that perform GSB. l Lgr3 expression in R48H10 neurons rescues puparium AR in Lgr3 mutants. Shown are dot plots of puparium AR. m Lgr3 expression in R48H10 neurons rescues GSB in Lgr3 mutants. Shown is the percentage of animals of the depicted genotypes that perform GSB. n R48H10 > Lgr3-IR does not alter phm, dib, or E74B mRNA levels in WPP T0 animals. Dot plots showing qRT-PCR estimations of the depicted genes. o Model: Dilp8-Lgr3 pathway promotes pupariation program progression. Statistics (full details in Supplementary Table 2): a, h, j, l Dots: one animal. Horizontal bar, median. Error bars, 25-75%. n Dots: biological repeats. a, h, j, l, n ANOVA, followed by a Holm-Sidak’s test. h, j, l Dunn’s test. n ns not-significant. b, I, k, m Binomial tests with Bonferroni correction. Same blue letters, corrected P > 0.05. (N) Number of animals (orange). Scale bars, 50 µm.

Similar articles

Cited by

References

    1. Carew TJ. Behavioral Neurobiology: The Cellular Organization of Natural Behavior. Oxford: Oxford University Press; 2000.
    1. Kim SM, Su CY, Wang JW. Neuromodulation of innate behaviors in Drosophila. Annu. Rev. Neurosci. 2017;40:327–348. doi: 10.1146/annurev-neuro-072116-031558. - DOI - PubMed
    1. Cooke S. J., Crossin G. T., Hinch S. G. Pacific salmon migration: completing the cycle. In: Farrell A. P., (ed.), Encyclopedia of Fish Physiology: From Genome to Environment. 3, 1945–1952 (Academic Press, San Diego, Jun 2011).
    1. Becker I, Woodley SJ, Stringer MD. The adult human pubic symphysis: a systematic review. J. Anat. 2010;217:475–487. doi: 10.1111/j.1469-7580.2010.01300.x. - DOI - PMC - PubMed
    1. Turner SE, et al. Birth in free-ranging Macaca fuscata. Int. J. Primatol. 2010;31:15–37. doi: 10.1007/s10764-009-9376-8. - DOI

Publication types

MeSH terms

LinkOut - more resources