Selection on heritable social network positions is context-dependent in Drosophila melanogaster
- PMID: 34099680
- PMCID: PMC8185000
- DOI: 10.1038/s41467-021-23672-1
Selection on heritable social network positions is context-dependent in Drosophila melanogaster
Abstract
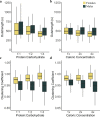
Social group structure is highly variable and can be important for nearly every aspect of behavior and its fitness consequences. Group structure can be modeled using social network analysis, but we know little about the evolutionary factors shaping and maintaining variation in how individuals are embedded within their networks (i.e., network position). While network position is a pervasive target of selection, it remains unclear whether network position is heritable and can respond to selection. Furthermore, it is unclear how environmental factors interact with genotypic effects on network positions, or how environmental factors shape selection on heritable network structure. Here we show multiple measures of social network position are heritable, using replicate genotypes and replicate social groups of Drosophila melanogaster flies. Our results indicate genotypic differences in network position are largely robust to changes in the environment flies experience, though some measures of network position do vary across environments. We also show selection on multiple network position metrics depends on the environmental context they are expressed in, laying the groundwork for better understanding how spatio-temporal variation in selection contributes to the evolution of variable social group structure.
Conflict of interest statement
The authors declare no competing interests.
Figures


Similar articles
-
Indirect genetic effects for social network structure in Drosophila melanogaster.Philos Trans R Soc Lond B Biol Sci. 2023 Apr 10;378(1874):20220075. doi: 10.1098/rstb.2022.0075. Epub 2023 Feb 20. Philos Trans R Soc Lond B Biol Sci. 2023. PMID: 36802774 Free PMC article.
-
Natural genetic variation in social environment choice: context-dependent gene-environment correlation in Drosophila melanogaster.Evolution. 2011 Aug;65(8):2325-34. doi: 10.1111/j.1558-5646.2011.01295.x. Epub 2011 Apr 7. Evolution. 2011. PMID: 21790578
-
Quantitative genetics of natural variation of behavior in Drosophila melanogaster: the possible role of the social environment on creating persistent patterns of group activity.Evolution. 2005 Jul;59(7):1529-39. Evolution. 2005. PMID: 16153038
-
Environmental stress and the expression of genetic variation.EXS. 1997;83:79-96. doi: 10.1007/978-3-0348-8882-0_5. EXS. 1997. PMID: 9342844 Review.
-
Uncovering cryptic genetic variation.Nat Rev Genet. 2004 Sep;5(9):681-90. doi: 10.1038/nrg1426. Nat Rev Genet. 2004. PMID: 15372091 Review.
Cited by
-
Using a Combination of Novel Research Tools to Understand Social Interaction in the Drosophila melanogaster Model for Fragile X Syndrome.Biology (Basel). 2024 Jun 12;13(6):432. doi: 10.3390/biology13060432. Biology (Basel). 2024. PMID: 38927312 Free PMC article.
-
The gene "degrees of kevin bacon" (dokb) regulates a social network behaviour in Drosophila melanogaster.Nat Commun. 2024 Apr 30;15(1):3339. doi: 10.1038/s41467-024-47499-8. Nat Commun. 2024. PMID: 38688961 Free PMC article.
-
Directional selection failed to produce changes in olfactory Y-maze learning and memory but induced changes in climbing phenotypes.bioRxiv [Preprint]. 2025 May 23:2025.05.18.654242. doi: 10.1101/2025.05.18.654242. bioRxiv. 2025. PMID: 40475513 Free PMC article. Preprint.
-
Indirect genetic effects for social network structure in Drosophila melanogaster.Philos Trans R Soc Lond B Biol Sci. 2023 Apr 10;378(1874):20220075. doi: 10.1098/rstb.2022.0075. Epub 2023 Feb 20. Philos Trans R Soc Lond B Biol Sci. 2023. PMID: 36802774 Free PMC article.
-
Identifying the social context of single- and mixed-species group formation in large African herbivores.Philos Trans R Soc Lond B Biol Sci. 2023 Jun 5;378(1878):20220105. doi: 10.1098/rstb.2022.0105. Epub 2023 Apr 17. Philos Trans R Soc Lond B Biol Sci. 2023. PMID: 37066657 Free PMC article.
References
-
- Croft, D. P., James, R. & Krause, J. Exploring animal social networks. In Exploring Animal Social Networks (Princeton University Press, 2008). 10.5860/choice.46-3243.
-
- Wey T, Blumstein DT, Shen W, Jordán F. Social network analysis of animal behaviour: a promising tool for the study of sociality. Anim. Behav. 2008;75:333–344. doi: 10.1016/j.anbehav.2007.06.020. - DOI
-
- Webber QMR, Vander Wal E. Trends and perspectives on the use of animal social network analysis in behavioural ecology: a bibliometric approach. Anim. Behav. 2019;149:77–87. doi: 10.1016/j.anbehav.2019.01.010. - DOI
Publication types
MeSH terms
LinkOut - more resources
Full Text Sources
Molecular Biology Databases

