. 2021 Jun 7;12(1):3411.
doi: 10.1038/s41467-021-23627-6.

The influence of decision-making in tree ring-based climate reconstructions

Affiliations

The influence of decision-making in tree ring-based climate reconstructions

Ulf Büntgen et al. Nat Commun. .

Abstract

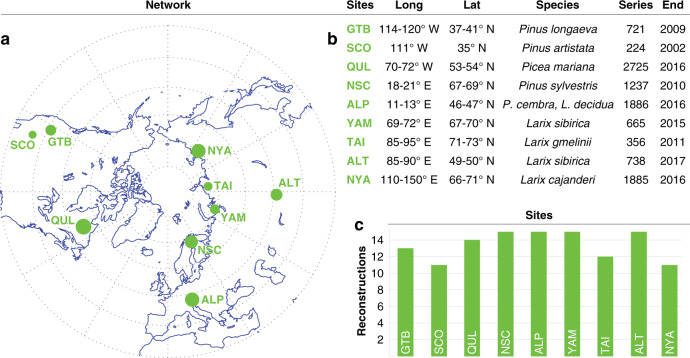
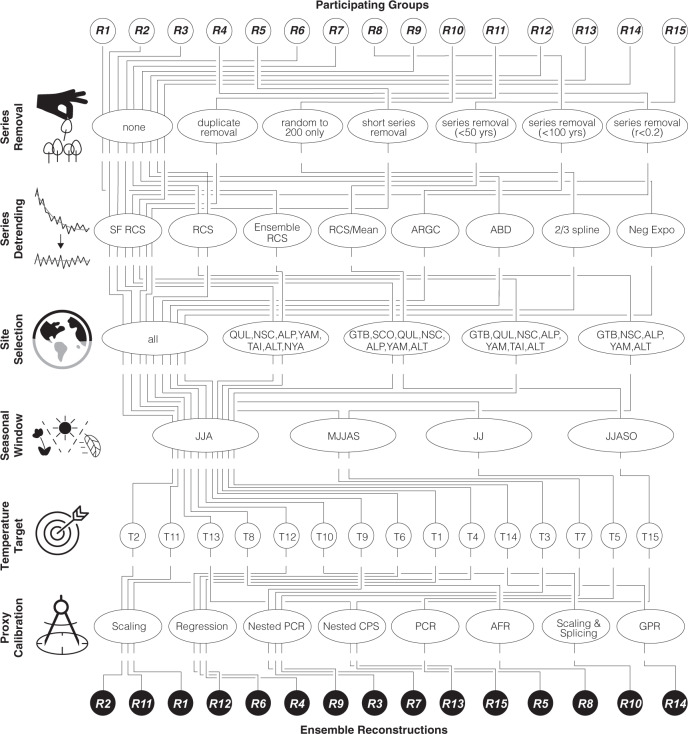
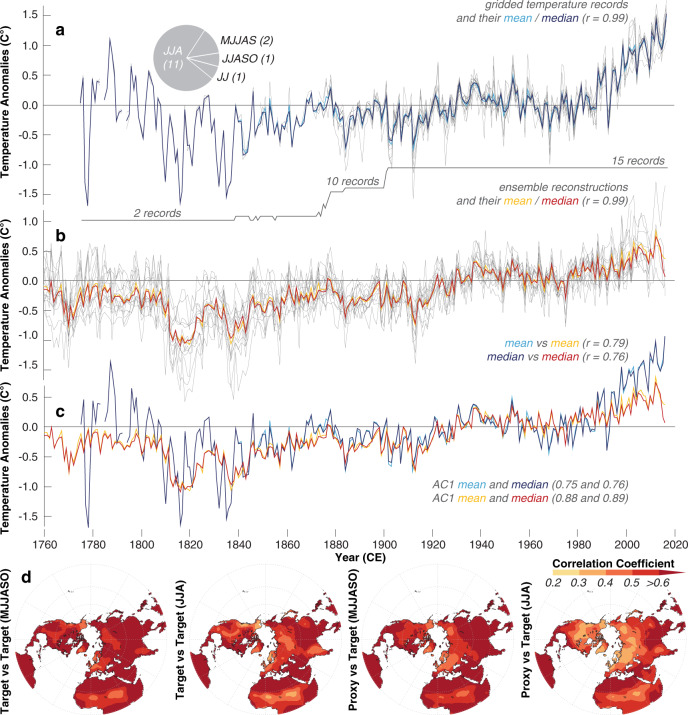
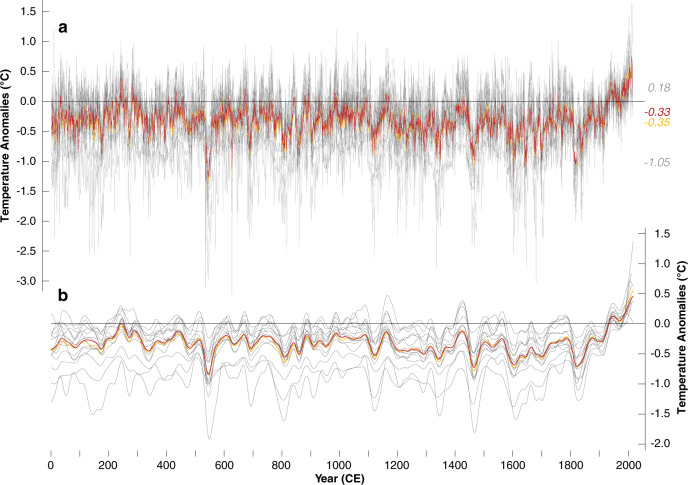
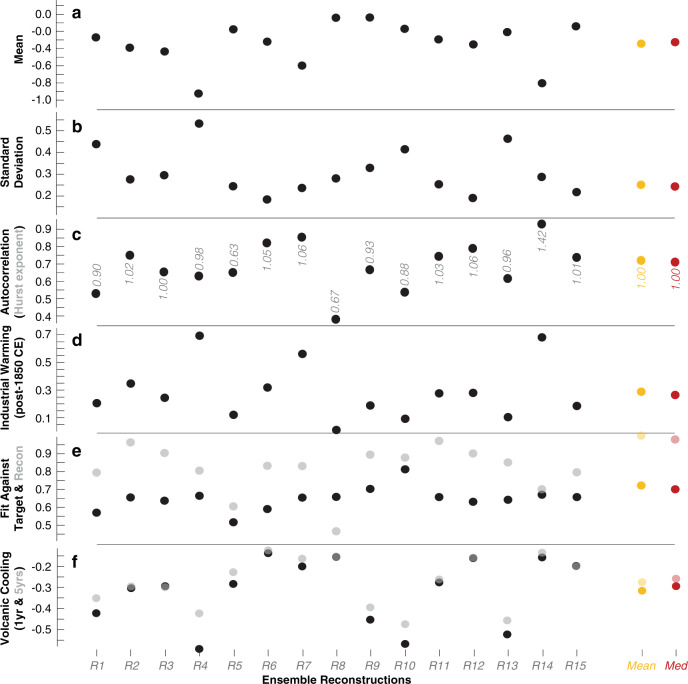
Tree-ring chronologies underpin the majority of annually-resolved reconstructions of Common Era climate. However, they are derived using different datasets and techniques, the ramifications of which have hitherto been little explored. Here, we report the results of a double-blind experiment that yielded 15 Northern Hemisphere summer temperature reconstructions from a common network of regional tree-ring width datasets. Taken together as an ensemble, the Common Era reconstruction mean correlates with instrumental temperatures from 1794-2016 CE at 0.79 (p < 0.001), reveals summer cooling in the years following large volcanic eruptions, and exhibits strong warming since the 1980s. Differing in their mean, variance, amplitude, sensitivity, and persistence, the ensemble members demonstrate the influence of subjectivity in the reconstruction process. We therefore recommend the routine use of ensemble reconstruction approaches to provide a more consensual picture of past climate variability.


Conflict of interest statement

The authors declare no competing interests.

Figures

Fig. 1
Fig. 1. Dendro network .
a Spatial distribution of the 15 tree-ring width (TRW) sites with three of them in North America (GTB, SCO and QUL), two in Europe (NSC and ALP), three in northern Siberia (YAM, TAI and NYA), and one in inner Eurasia (ALT). Dot size represents TRW sample replication, ranging from 224 series in SCO to 2725 series in QUL. b Longitude and latitude, species, the total number of series, and last ring of the nine regional TRW datasets. c Consideration of the nine TRW datasets in the 15 ensemble reconstructions, ranging from 11 times (SCO and NYA) to 15 times (NSC, ALP, YAM, ALT).
Fig. 2
Fig. 2. Ensemble approach.
Flow chart of the 15 large-scale Northern Hemisphere (NH) summer temperature reconstructions for the Common Era. SF RCS signal-free regional curve standardisation, ARGC adaptive regional growth curve, ABD age band decomposition for detrending, PCR principal component regressions, CPS composite plus scaling, AFR analogue frequency regression, and GPR gaussian process regression (see the “Methods” section and Supplementary Table 1 for details and further abbreviations).
Fig. 3
Fig. 3. Measured and reconstructed temperatures.
a Gridded temperature measurements (grey lines), together with their mean and median time-series (see the “Methods” section for details). The pie chart shows the seasonal averages used, and the lower grey solid line refers to the number of records. b Ensemble reconstructions (grey lines), together with their mean and median (orange and red). The mean and median of both, the proxy and target data are statistically similar (r = 0.99). c Measured and reconstructed temperature means and medians. d Spatial field correlations between the mean of all 15 temperature targets and gridded Berkeley data (Target versus Target), and the ensemble reconstruction mean and gridded Berkeley data (Proxy versus Target), calculated over 1794–2016 CE.
Fig. 4
Fig. 4. Temperature reconstructions.
a Ensemble of 15 reconstructions (grey lines), together with their mean and median (orange and red). Numbers on the right refer to the long-term mean of the maximum, and minimum, as well as mean and median values between 1 and 2016 CE. The mean and median correlate significantly at 0.98 (p < 0.0001) and exhibit similar first-order autocorrelation coefficients of 0.71 and 0.70, respectively. b The 15 ensemble reconstructions and their mean and median after applying 50-year cubic smoothing spline functions.
Fig. 5
Fig. 5. Reconstruction characteristics.
a–d Mean, standard deviation, first-order autocorrelation (and highest Hurst exponent H), and the difference between industrial and pre-industrial temperature means (after and before 1850 CE) of the 15 ensemble reconstructions (R1R15), as well as their mean and median (orange and red). e Correlation coefficients of the 15 ensemble reconstructions against the gridded instrumental target mean (Target Fit; black) and against the reconstruction mean (Recon Fit; opaque). f One (black) and 5-year (opaque) post-volcanic cooling relative to the 10 pre-eruption years (see Supplementary Fig. 3 for the 24 eruption years used). All statistics refer to 72–2000 (or 1794–2000 CE when considering the mean of the instrumental temperature records).

References

    1. Esper J, et al. Ranking of tree-ring based temperature reconstructions of the past millennium. Quat. Sci. Rev. 2016;145:134–151. doi: 10.1016/j.quascirev.2016.05.009. - DOI
    1. PAGES2k Consortium. A global multiproxy database for temperature reconstructions of the Common Era. Sci. Data. 2017;4:170088. doi: 10.1038/sdata.2017.88. - DOI - PMC - PubMed
    1. Büntgen U, et al. Prominent role of volcanism in Common Era climate variability and human history. Dendrochronologia. 2020;64:125757. doi: 10.1016/j.dendro.2020.125757. - DOI
    1. Ljungqvist FC, et al. Ranking of tree-ring based hydroclimate reconstructions of the past millennium. Quat. Sci. Rev. 2020;230:106074. doi: 10.1016/j.quascirev.2019.106074. - DOI
    1. St. George S. An overview of tree-ring width records across the Northern Hemisphere. Quat. Sci. Rev. 2014;95:132–150. doi: 10.1016/j.quascirev.2014.04.029. - DOI

Publication types