. 2021 Jun 7;12(1):3337.
doi: 10.1038/s41467-021-23630-x.

High throughput screening identifies SOX2 as a super pioneer factor that inhibits DNA methylation maintenance at its binding sites

Affiliations

High throughput screening identifies SOX2 as a super pioneer factor that inhibits DNA methylation maintenance at its binding sites

Ludovica Vanzan et al. Nat Commun. .

Abstract

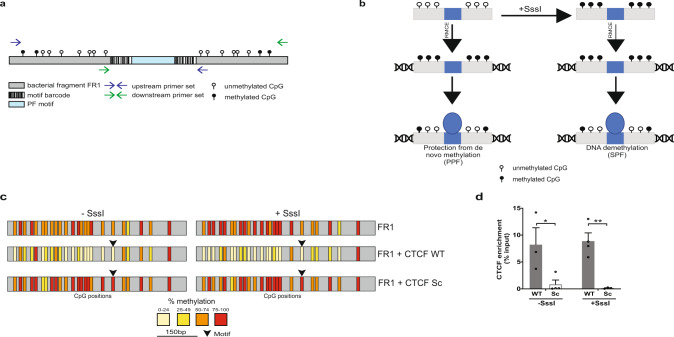
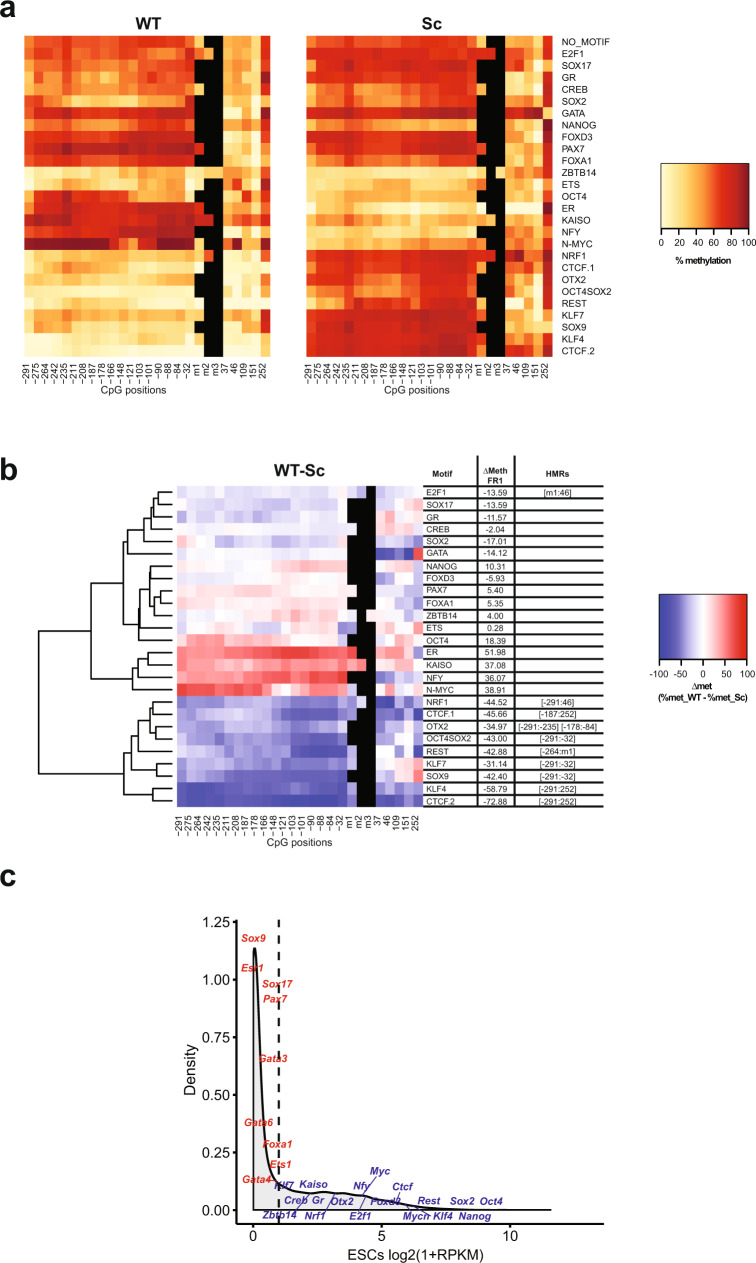
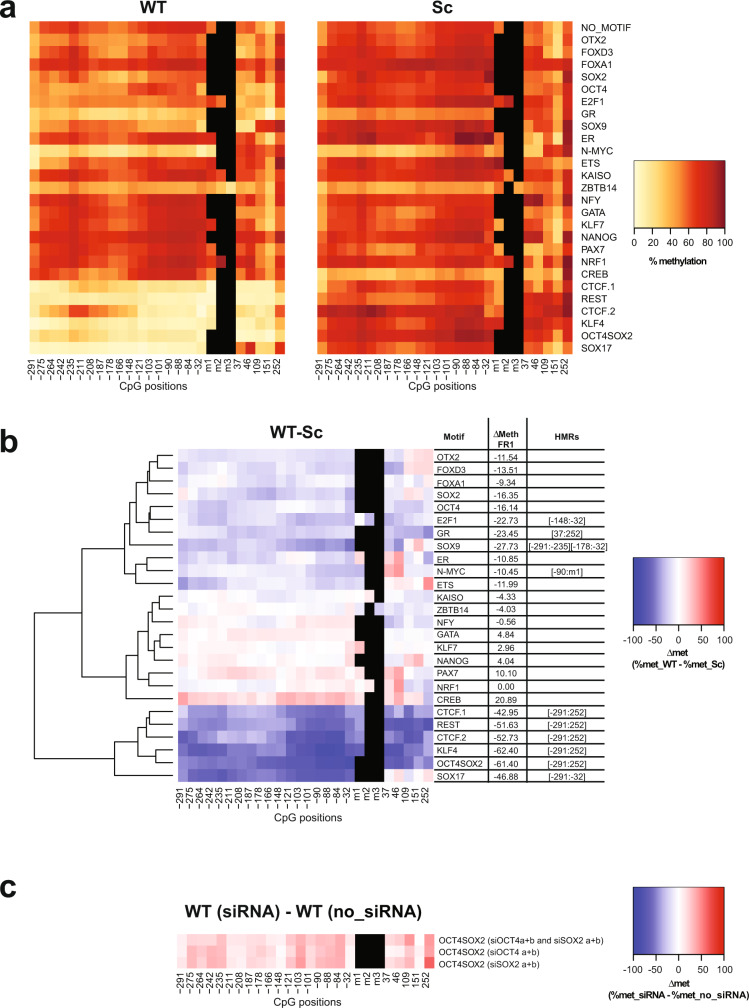
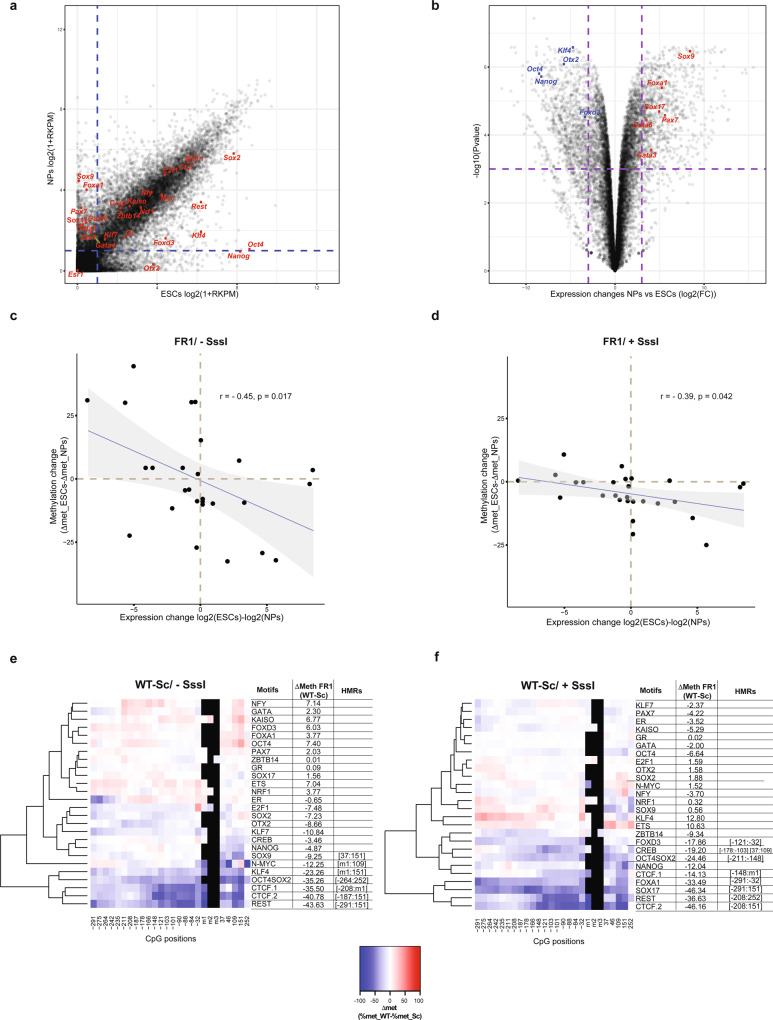
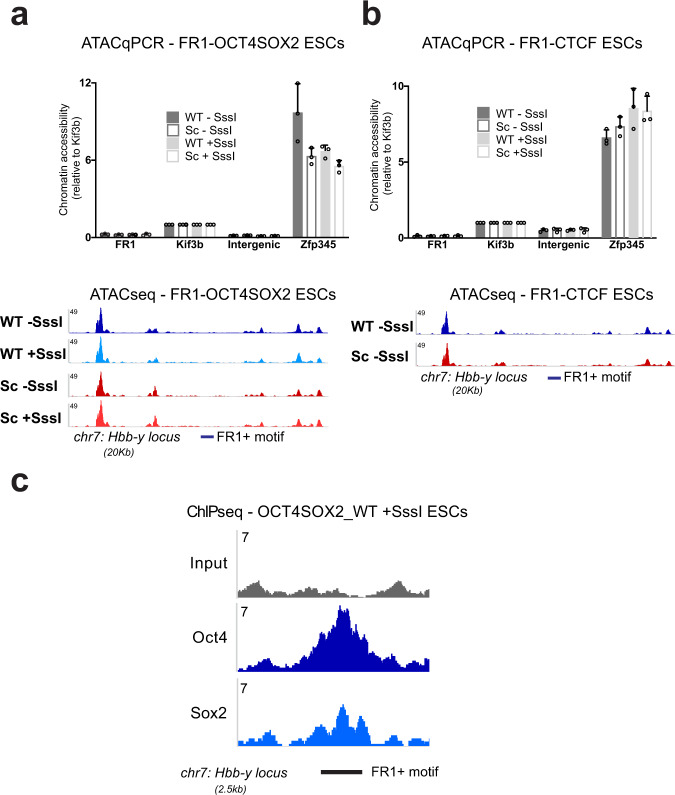
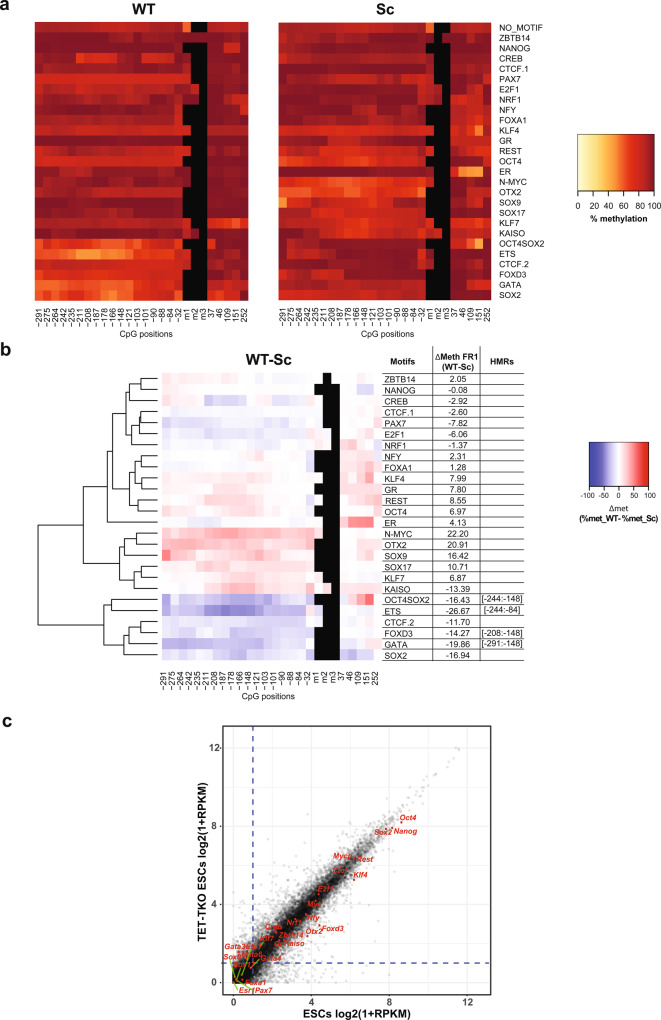
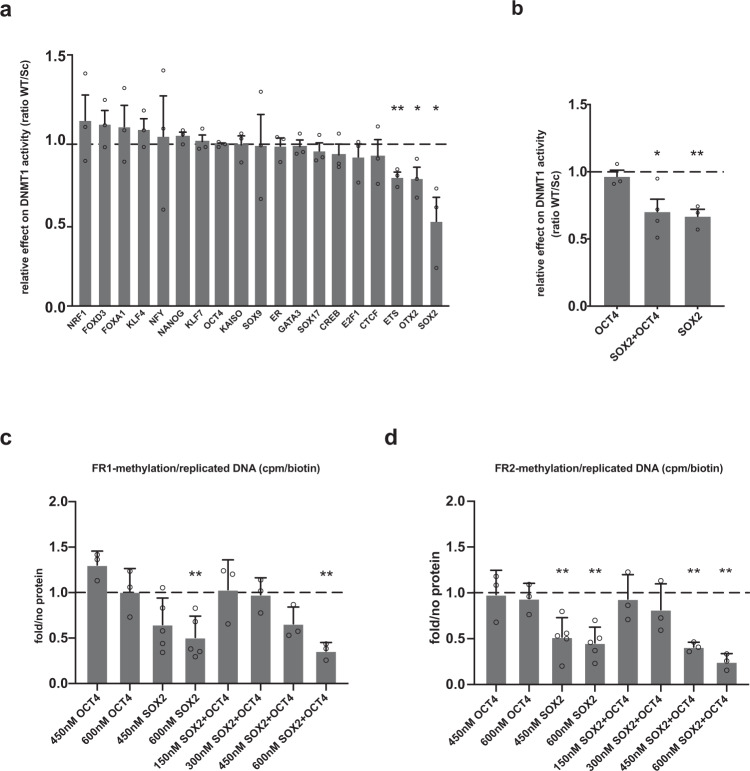
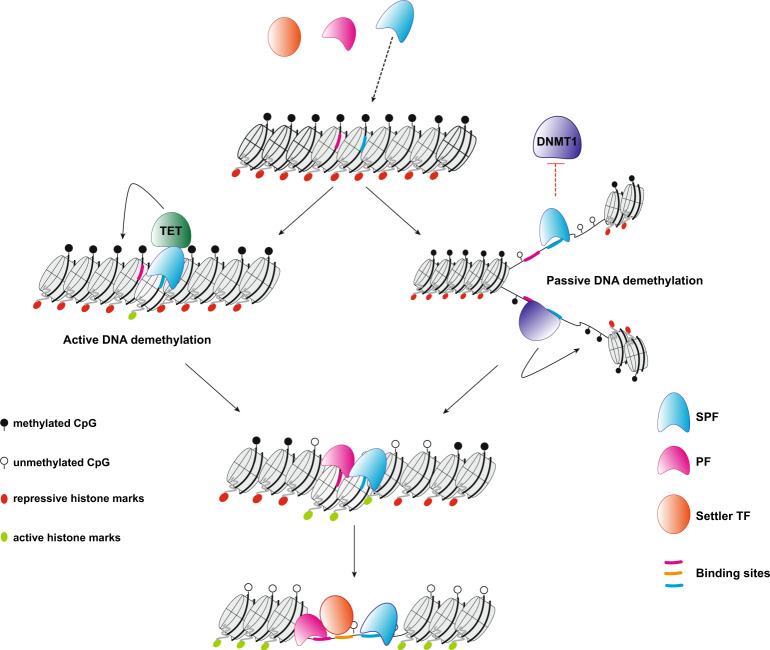
Binding of mammalian transcription factors (TFs) to regulatory regions is hindered by chromatin compaction and DNA methylation of their binding sites. Nevertheless, pioneer transcription factors (PFs), a distinct class of TFs, have the ability to access nucleosomal DNA, leading to nucleosome remodelling and enhanced chromatin accessibility. Whether PFs can bind to methylated sites and induce DNA demethylation is largely unknown. Using a highly parallelized approach to investigate PF ability to bind methylated DNA and induce DNA demethylation, we show that the interdependence between DNA methylation and TF binding is more complex than previously thought, even within a select group of TFs displaying pioneering activity; while some PFs do not affect the methylation status of their binding sites, we identified PFs that can protect DNA from methylation and others that can induce DNA demethylation at methylated binding sites. We call the latter super pioneer transcription factors (SPFs), as they are seemingly able to overcome several types of repressive epigenetic marks. Finally, while most SPFs induce TET-dependent active DNA demethylation, SOX2 binding leads to passive demethylation, an activity enhanced by the co-binding of OCT4. This finding suggests that SPFs could interfere with epigenetic memory during DNA replication.


Conflict of interest statement

The authors declare no competing interests.

Figures

Fig. 1
Fig. 1. Validation of the experimental approach (Hi-TransMet) to test for TF effect on DNA methylation.
a PF motifs flanked by unique barcode sequences were individually cloned at the centre of an intermediate CpG content bacterial DNA fragment (FR1) within an RMCE donor plasmid that was used to insert FR1 in the target site of mESCs (b).  Methylation levels in cells that underwent successful recombination were analysed using universal bisulfite PCR primers designed around the inserted motifs (blue and green arrows). b Schematic representation of Hi-TransMet screening principle. Motif-containing plasmid libraries were transfected into mESCs following in vitro methylation via M.SssI enzyme (+SssI) or without further treatment (−SssI). Upon insertion into the genome, untreated sequences gain methylation, while SssI-treated ones keep their methylation levels. Results allow to identify two types of PFs: (I) PFs that are able to bind unmethylated DNA and protect it from methylation (protective pioneer transcription factors (PPFs)); (II) PFs that are able to bind methylated DNA and induce DNA demethylation (super pioneer transcription factors (SPFs)). c Validation of the experimental approach by bisulfite Sanger sequencing in cell lines containing FR1 with CTCF-only motifs. Upon insertion, in the −SssI condition, FR1 undergoes de novo methylation. Lower methylation is observed in the presence of the CTCF WT but not Sc motif. In the +SssI condition, high levels of DNA methylation were retained by FR1 in the absence of the motif and in the presence of the CTCF Sc motif. In the presence of the CTCF WT motif, a reduction of DNA methylation levels is observed. Vertical bars correspond to CpG positions, and the colour code corresponds to the percentage of methylation calculated for each CpG with a minimum coverage of ten bisulfite reads. d CTCF binding to FR1 was verified by ChIP-qPCR. Results are presented as mean values + SEM of n = 3 (WT/−SssI, Sc/+SssI) or n = 4 (Sc/−SssI, WT/+SssI) biologically independent replicates. Binding of CTCF to its motif in the FR1 fragment is indicated as percentage of input, that is, the enrichment of IP signal (normalized over input signal) at the selected locus. Enrichment at CTCF WT motif is significantly higher than at the Sc motif. p values (two-tailed unpaired t test): WT/−SssI vs Sc/−SssI:0.043494; WT/+SssI vs Sc/+ SssI: 0.004249 (*p < 0.05, **p < 0.01). Source data are provided as a Source data file.
Fig. 2
Fig. 2. Identification of protective pioneer transcription factors (PPFs).
a Heatmaps indicating methylation percentages of individual CpGs in FR1 containing WT (left panel) and Sc (right panel) motifs in the −SssI condition. Each line represents FR1 containing the indicated motif. Each square within the line corresponds to one CpG. The methylation percentage of individual CpGs is represented by a colour code. CpGs’ distance from the 5’ end of the motifs is indicated below the heatmaps. CpGs within the motif, when present, are indicated as m1, m2 and m3. b Differential methylation between WT and Sc motifs in the FR1/−SssI condition. Differential methylation was calculated for each CpG as Δmet = % met_WT − % met_Sc and represented by a colour code. Results were hierarchically clustered using the complete linkage method with Euclidian distance. CpGs’ distance from the 5’ end of the motifs is indicated below the heatmaps. The coordinates of statistically significant hypomethylated regions (HMRs) in WT condition are indicated on the side. c Density plot of gene expression levels in mESCs as measured by RNA-Seq. Expression levels of the tested PFs are labeled. A cut-off of Log2(1 + RPKM) < 1 (dashed line) was used to separate PF expression levels into low (red) and high (blue).
Fig. 3
Fig. 3. Identification of super pioneer transcription factors (SPFs).
a Heatmaps indicating methylation percentages of individual CpGs in the FR1 containing WT (left panel) and Sc (right panel) motifs in the +SssI condition. Each line represents FR1 containing the indicated motif. Each square within the line corresponds to one CpG. The methylation percentage of individual CpGs is represented by a colour code. CpGs’ distance from the 5’ end of the motifs is indicated below the heatmaps. CpGs within the motif, when present, are indicated as m1, m2 and m3. b Differential methylation between WT and Sc motifs in the FR1/+SssI condition. Differential methylation was calculated for each CpG as Δmet = % met_WT − % met_Sc and represented by a colour code. Results were hierarchically clustered using the complete linkage method with Euclidian distance. CpGs’ distance from the 5’ end of the motifs is indicated below the heatmaps. The coordinates of statistically significant hypomethylated regions (HMRs) in WT condition are indicated on the side. c Differential methylation around OCT4SOX2 WT motif in the FR1/+SssI condition between cells that underwent SOX2 and/or OCT4 knockdown (siRNA) and untransfected cells (no_siRNA). Differential methylation was calculated for each CpG as Δmet = % met_WT (siRNA) − % met_WT (no_siRNA) and represented by a colour code. CpGs’ distance from the 5’ end of the motifs is indicated below the heatmaps.
Fig. 4
Fig. 4. PPFs and SPFs are cell-type specific.
a Scatter plot showing differential gene expression between ESCs (x axis) and NPs (y axis) based on RNA-Seq data. Tested PFs are labelled in red. A cut-off of Log2(1 + RPKM) < 1 (dashed lines) was used to separate PF expression levels into low and high. b Volcano plot highlighting genes with a significantly different expression levels between ESCs and NPs. Cut-off is indicated by the dashed lines. c, d Scatter plots comparing differential expression of each tested PF in ESCs and NPs against the change in Δmet between ESCs and NPs (ΔΔmet = Δmet_ESCs − Δmet_NPs) of the FR1 containing the corresponding PF motif in −SssI (c) and +SssI (d) conditions. Each dot represents ΔΔmet for FR1 fragment with one motif. Data were analysed by two-sided Pearson’s correlation test, with the error bands corresponding to the confidence interval. r = Pearson correlation coefficient; p = p value. e, f Differential methylation (Δmet) between WT and Sc motifs in the FR1/−SssI (e) and in the FR1/+SssI (f) conditions in NPs. Differential methylation was calculated for each CpG as Δmet = %met_WT − %met_Sc and represented by a colour code. Results were hierarchically clustered using the complete linkage method with Euclidian distance. CpGs’ distance from the 5’ end of the motifs is indicated below the heatmaps. The coordinates of statistically significant hypomethylated regions (HMRs) in WT condition are indicated on the side.
Fig. 5
Fig. 5. SPF activity is not sufficient, in isolation, to generate chromatin accessibility.
a, b Upper panels. Results of ATAC-qPCR experiments in FR1_OCT4SOX2 ESCs (a) and FR1_CTCF ESCs (b) containing WT and Sc motifs in −SssI and +SssI conditions. We measured very low levels of chromatin accessibility at the FR1 locus in all four conditions when compared to known accessible (Zfp345 large ATAC-peak; Kif3b medium ATAC-peak) and inaccessible (Intergenic small ATAC peak) regions of the chromatin in mESCs. Results are shown as mean+SD of n = 3 biologically independent replicates. Source data are provided as a Source data file. Lower panels. Representative genome browser tracks of the chromatin accessibility landscape around the FR1 locus. ATAC-Seq experiments were performed in FR1-OCT4SOX2 ESCs containing WT/±SssI and Sc/±SssI motifs (a) and in FR1-CTCF ESCs containing WT/−SssI and Sc/−SssI motifs (b). The ATAC-Seq signal is low over the FR1 locus compared to neighbouring accessibility peaks, highlighting the low levels of chromatin accessibility, which remain unchanged despite SPF binding in the WT conditions. c OCT4 and SOX2 ChIP-Seq in FR1 OCT4SOX2 ESCs reveals binding of both TFs at the FR1 locus. Displayed are representative genome browser tracks of the ChIP-Seq data across the FR1 locus.
Fig. 6
Fig. 6. Most SPFs induce TET-dependent active DNA demethylation.
a Heatmaps indicating methylation percentages of individual CpGs in the FR1 containing WT (left panel) and Sc (right panel) motifs in the +SssI condition in TET TKO ESCs, as in Figs. 2a and 3a. b Differential methylation between WT and Sc motifs in the FR1/+SssI condition in TET TKO ESCs, as in previous figures. c Scatter plot showing differential gene expression between WT (x axis) and TET TKO (y axis) ESCs based on RNA-Seq data. Tested PFs are labelled in red. A cut-off of Log2(1 + RPKM) > 1 (dashed lines) was used to separate PF expression levels into low and high.
Fig. 7
Fig. 7. SOX2 inhibits DNMT1-dependent maintenance of DNA methylation during replication.
a In vitro methylation assay to measure DNMT1 methyltransferase activity using hemi-methylated probes containing WT or Sc PF motifs in the presence or absence of the corresponding PF. Relative DNMT1 activity is represented as scintillation counts in WT probes, corrected for the amount of recovered DNA probes and compared relative to the Sc probe. Results are shown as mean + SEM of n = 3 biologically independent replicates. SOX2, ETS1 and OTX2 significantly reduce DNMT1 activity. p values: ETS1 p = 0.0018, OTX2 p = 0.0238, SOX2 p = 0.026 (two-tailed unpaired t test; *p < 0.05, **p < 0.01). b In vitro methylation assay using the probe containing the OCT4SOX2 motif in the presence of OCT4, SOX2 or SOX2 + OCT4 proteins. Results are shown as mean + SEM of n = 3 biologically independent replicates. p values: SOX2 + OCT4 p = 0.018, SOX2 p = 0.003, (two-tailed unpaired t test, *p < 0.05, **p < 0.01). c, d In vitro replication assay to assess the effect of SOX2 and OCT4 binding on the maintenance of DNA methylation during replication. Two probes containing the OCT4SOX2 motif were used: FR1 (c) and FR2 (d). The indicated concentrations represent those of active hOCT4 and hSOX2 recombinant proteins that were used. Methylation levels following replication are measured based on the integration of radioactively labelled methyl group during replication and compared to “no_protein” control. Results are presented as mean + SD of n = 5 (hSOX2 samples) or n = 3 biologically independent replicates (hOCT4 and hOCT4 + hSOX2 samples) and analysed as radioactive signal in the presence of the protein relative to the signal in the absence of protein. p values: FR1_600nM_SOX2 p = 0.0092, FR1_600nM_OCT4 + SOX2 p = 0.0068, FR2_450nM_SOX2 p = 0.0071, FR2_600nM_SOX2 p = 0.0021, FR2_450nM_OCT4 + SOX2 p = 0.0026, FR2_600nM_OCT4 + SOX2 p = 0.0047 (two-tailed unpaired t test, **p < 0.01). For all panels, source data are provided as a Source data file.
Fig. 8
Fig. 8. Hierarchy of transcription factor binding.
SPFs engage their target sequences in closed chromatin and in the presence of DNA methylation. Upon binding, most SPFs drive DNA demethylation through active processes, mainly mediated by the TET enzymes, while SOX2 leads to passive DNA demethylation. Loss of DNA methylation allows the binding of methylation-sensitive PFs. Nucleosome remodelling and deposition of histone modifications associated with open chromatin regions, mediated by both SPFs and PFs, create a favourable environment for the binding of settler TFs.

Similar articles

Cited by

References

    1. Thurman RE, et al. The accessible chromatin landscape of the human genome. Nature. 2012;489:75–82. doi: 10.1038/nature11232. - DOI - PMC - PubMed
    1. Clapier CR, Iwasa J, Cairns BR, Peterson CL. Mechanisms of action and regulation of ATP-dependent chromatin-remodelling complexes. Nat. Rev. Mol. Cell Biol. 2017;18:407–422. doi: 10.1038/nrm.2017.26. - DOI - PMC - PubMed
    1. Cirillo LA, Zaret KS. An early developmental transcription factor complex that is more stable on nucleosome core particles than on free DNA. Mol. Cell. 1999;4:961–969. doi: 10.1016/S1097-2765(00)80225-7. - DOI - PubMed
    1. Cirillo LA, et al. Opening of compacted chromatin by early developmental transcription factors HNF3 (FoxA) and GATA-4. Mol. Cell. 2002;9:279–289. doi: 10.1016/S1097-2765(02)00459-8. - DOI - PubMed
    1. Mayran A, Drouin J. Pioneer transcription factors shape the epigenetic landscape. J. Biol. Chem. 2018;293:13795–13804. doi: 10.1074/jbc.R117.001232. - DOI - PMC - PubMed

Publication types