. 2021 Jun 7;12(1):3341.
doi: 10.1038/s41467-021-23667-y.

Quantitative single-cell proteomics as a tool to characterize cellular hierarchies

Affiliations

Quantitative single-cell proteomics as a tool to characterize cellular hierarchies

Erwin M Schoof et al. Nat Commun. .

Abstract

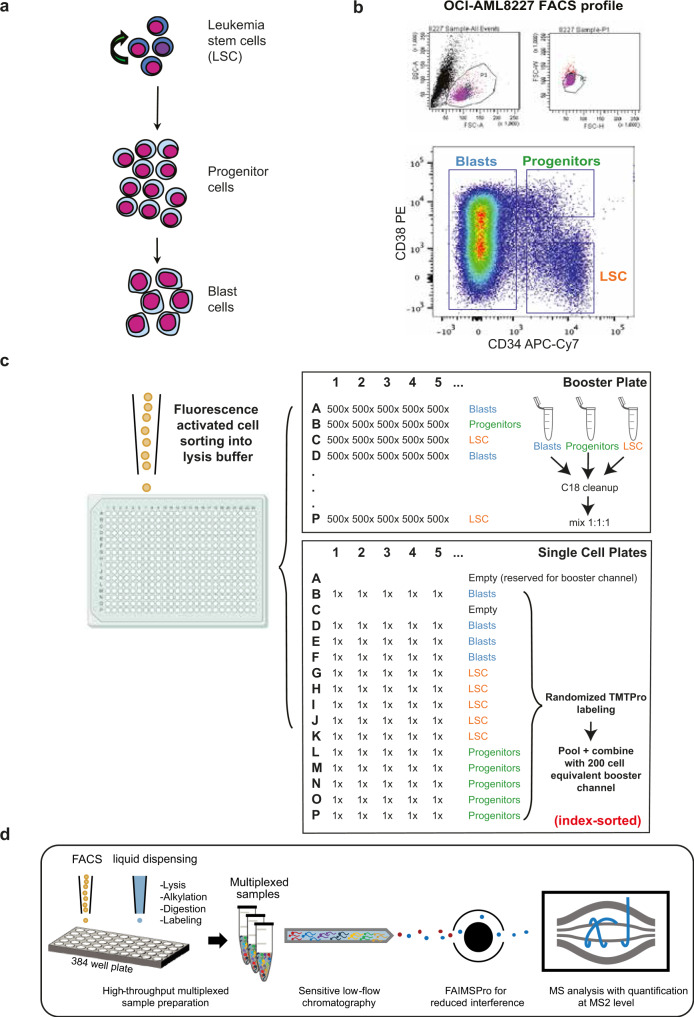
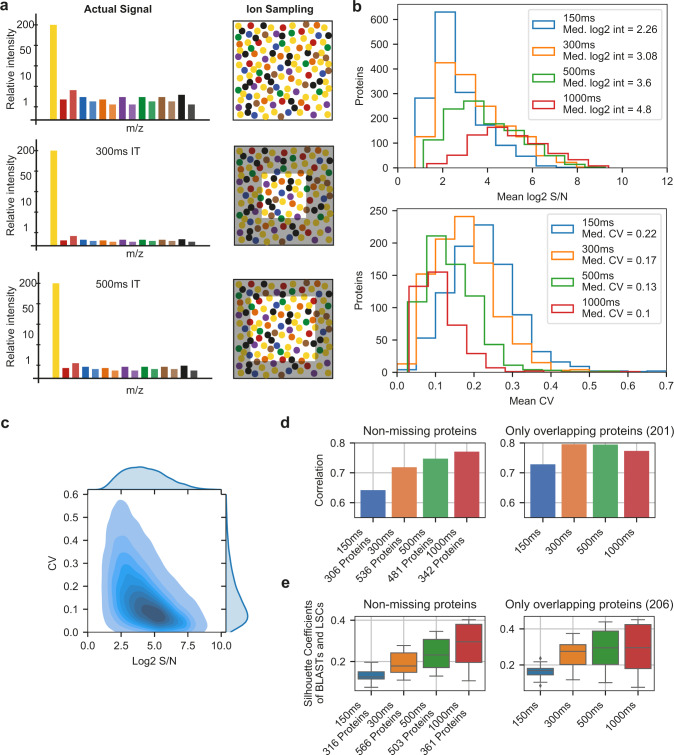
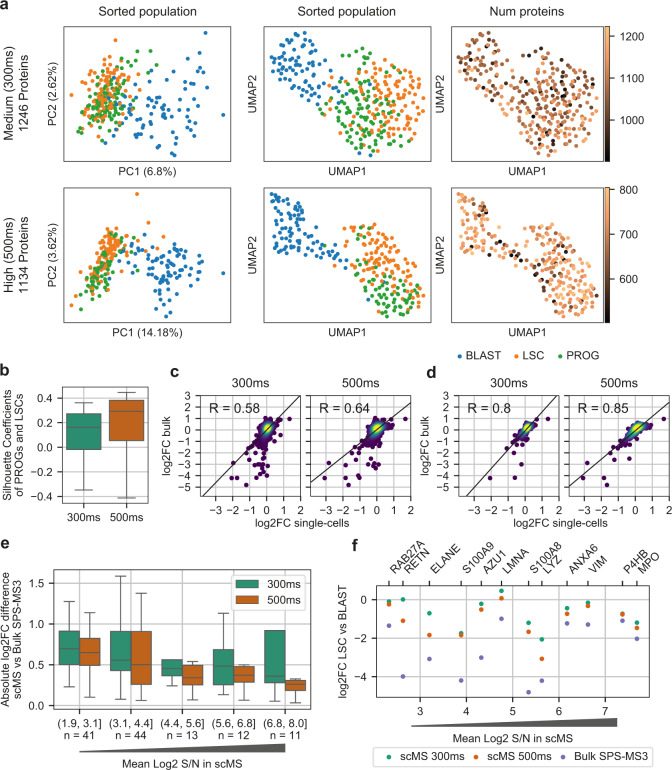
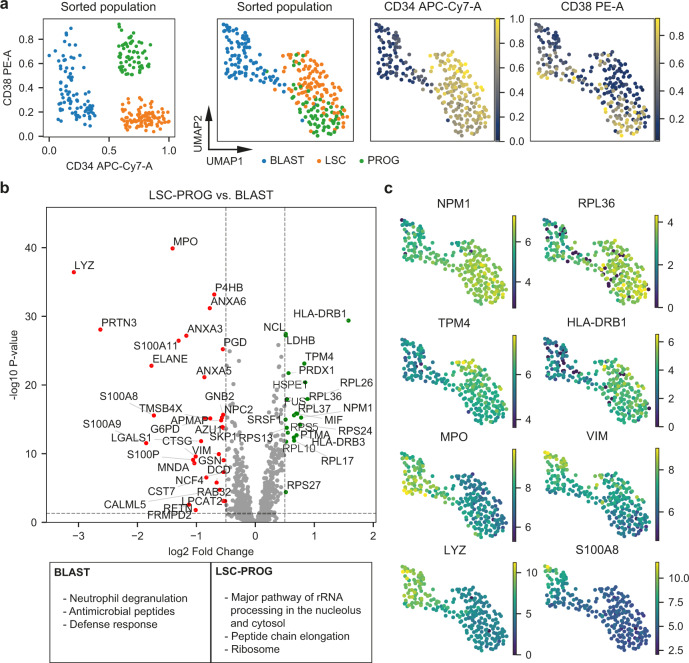
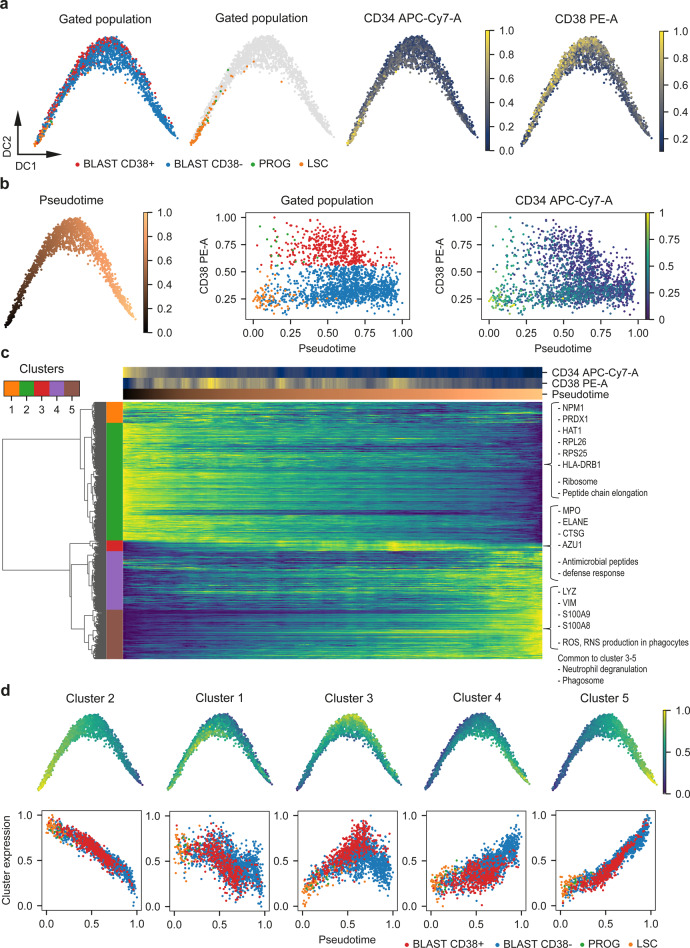
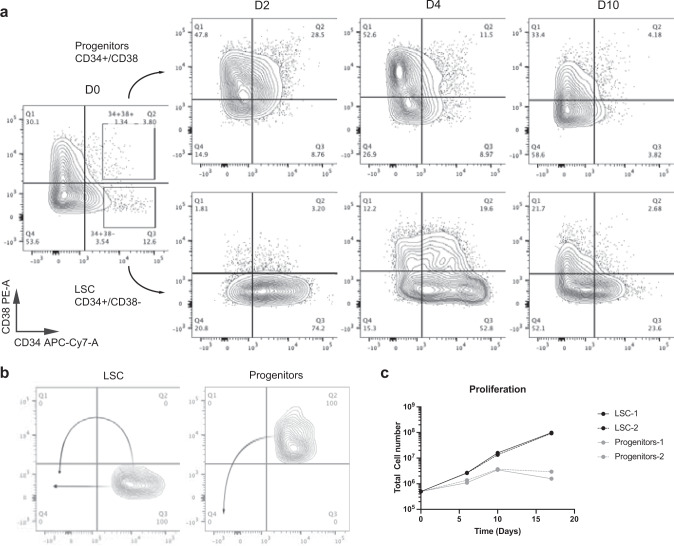
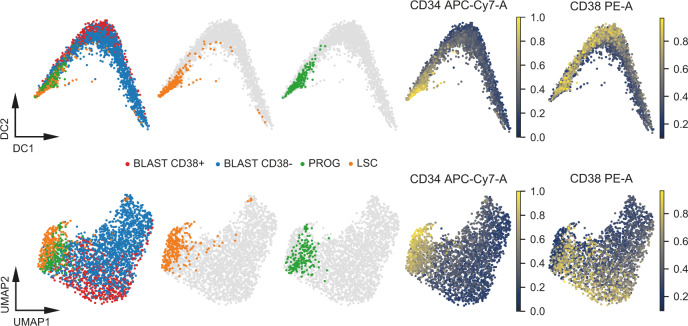
Large-scale single-cell analyses are of fundamental importance in order to capture biological heterogeneity within complex cell systems, but have largely been limited to RNA-based technologies. Here we present a comprehensive benchmarked experimental and computational workflow, which establishes global single-cell mass spectrometry-based proteomics as a tool for large-scale single-cell analyses. By exploiting a primary leukemia model system, we demonstrate both through pre-enrichment of cell populations and through a non-enriched unbiased approach that our workflow enables the exploration of cellular heterogeneity within this aberrant developmental hierarchy. Our approach is capable of consistently quantifying ~1000 proteins per cell across thousands of individual cells using limited instrument time. Furthermore, we develop a computational workflow (SCeptre) that effectively normalizes the data, integrates available FACS data and facilitates downstream analysis. The approach presented here lays a foundation for implementing global single-cell proteomics studies across the world.


Conflict of interest statement

The authors declare no competing interests.

Figures

Fig. 1
Fig. 1. Experimental overview of our scMS workflow.
a Overview of the hierarchical nature of an Acute Myeloid Leukemia hierarchy, with leukemic stem cells (LSC) at the apex, differentiating into progenitors, and subsequently, blasts. b FACS plot of the OCI-AML8227 hierarchy according to their CD34/CD38 surface marker expression levels. P1 are cells deemed live, P2 excludes doublets and Blasts, Progenitors and LSC are annotated according to CD34/CD38 expression. c scMS sample creation overview of booster channel samples and single cells; single-cell TMTpro samples were created with four Blast, five LSC and five Progenitor cells in each pool, labeled randomly using fourteen available TMTpro channels before pooling with a 200-cell equivalent of the 126-labeled booster sample. d Conceptual overview of our scMS experimental pipeline; single cells are sorted into 384-well plates containing 1ul of lysis buffer, then digested, TMT labeled and multiplexed. Resulting samples are analyzed with LC–MS via FAIMSPro gas-phase fractionation and Orbitrap detection.
Fig. 2
Fig. 2. Evaluating the quantitative accuracy of a booster-based scMS workflow.
a Cartoon depicting the influence of ion sampling (injection time, IT) on single-cell signal. b Evaluation of the effect of increased ion sampling. Top: Histograms of the mean log2 signal-to-noise (s/n) values of all single-cell channel measurements per protein for all four methods. Bottom: Histograms of the mean Coefficient of Variation (CV) per protein for all four methods. Up to 14 CVs per protein were calculated by normalizing the three replicates of each method by equalizing the median s/n of the single-cell channels for each protein across replicates and dividing the standard deviation of the normalized s/n of each protein in each single-cell channel across replicates by the mean of the raw s/n for each protein in each single-cell channel across replicates. The mean CV of up to 14 CVs per protein was reported, as CV calculation was only performed for n = 3. c Density plot of protein log2 s/n values and their CV from all four methods (i.e. up to 14 CVs per protein per method). d Pearson correlation coefficient of fold changes between LSC and blast in single-cell samples and MS3-level bulk data (n=number of proteins). Left: For each method, only proteins without missing values were considered (i.e. proteins quantified in all 14 channels in each replicate). Right: Only proteins overlapping between all methods in left were considered. Fold changes in single-cell samples were calculated from the means of all LSCs (n = 15) and blast (n = 12). e Silhouette coefficients of LSC (n = 15) and blast (n = 12) for each method, calculated in PCA space using the same protein selection as in panel d. Boxplot shows median, 0.25 and 0.75 quantile, and whiskers extend to points within 1.5 interquartile range of lower and upper quartile. Source data are provided as a Source Data file.
Fig. 3
Fig. 3. Detection of cellular heterogeneity with the ‘medium’ and ‘high’ method.
a Comparison of the PCA and UMAP embeddings resulting from the imputed protein matrix. Number of proteins refers to the non-imputed proteins measured per cell. ‘Medium’=302 cells, ‘high’=255 cells. BLAST = blasts, LSC = leukemia stem cells, PROG = progenitors. b Separation of populations measured by the silhouette coefficients of progenitors and LSCs calculated in UMAP space for 300 ms (n = 219) and 500 ms (n = 166). Boxplot shows median, 0.25 and 0.75 quantile, and whiskers extend to points within 1.5 interquartile range of lower and upper quartile. c Pearson correlation of the protein fold changes (log2FC) between blasts and LSCs measured in the scMS workflow and MS3 bulk-sorted data. Non-imputed values were used and only proteins with ≥3 values in blasts and LSCs respectively were considered. Number of proteins in 300 ms and 500 ms is n = 1725 and n = 1342, respectively. d Same analysis as in panel c, but with the top 400 high-coverage proteins selected for each dataset. e Absolute log2FC difference of proteins of LSC vs. blast between scMS and MS3 bulk-sorted data across intensity bins. Only proteins that were significantly changed between LSC and blast in the MS3 bulk-sorted data were selected for comparison (FDR < 0.05, absolute log2FC > 0.5). Proteins were binned across their mean log2 signal-to-noise (S/N) in the 300 ms and 500 ms dataset. n= number of proteins with absolute fold change difference plotted. Boxplot shows median, 0.25 and 0.75 quantile, and whiskers extend to points within 1.5 interquartile range of lower and upper quartile. Outliers not shown. f log2FC of selected proteins in 300 ms, 500 ms, and MS3 bulk-sorted data. Proteins were binned into 12 bins across their mean log2 S/N in the 300 ms and 500 ms dataset. From each bin the protein with the highest absolute fold-change between LSC and blast in the MS3 bulk-sorted data was selected for comparison with scMS ratios. Source data are provided as a Source Data file.
Fig. 4
Fig. 4. Extracting biological information from scMS data.
a FACS and scMS data from the ‘high’ dataset (255 cells). Left scatter plot shows the FACS derived expression of CD34 and CD38 of each cell, colored by differentiation stage annotation (BLAST = blast, LSC = leukemia stem cells, PROG = progenitors). Plots to the right show the UMAP embedding of cells using scMS data (255 cells, 1134 proteins), overlaid with differentiation stage annotation and FACS derived expression of CD34 and CD38. b Volcano plot of differential protein expression between cells labeled as LSC & progenitor and blast. Dashed horizontal line marks the significance threshold of 0.05 and dashed vertical lines mark the effect size threshold of an absolute log2 fold change of 0.5. Dots represent identified proteins, with up-regulated proteins marked as green and down-regulated proteins marked as red. The box at the bottom shows significantly enriched gene terms from the differentially expressed proteins in blasts and LSC & progenitor. c UMAP embedding of cells using scMS data, overlaid with scMS-derived protein expression of selected proteins. Source data are provided as a Source Data file.
Fig. 5
Fig. 5. scMS recapitulates differentiation trajectories.
a Diffusion map based on imputed scMS data (2,025 cells, 2,723 proteins) overlaid with FACS derived cell gating and CD34 and CD38 expression. BLAST = blasts, PROG = progenitors, LSC = leukemia stem cells. b Left: Diffusion map overlaid with pseudotime, calculated using the scMS data. Middle: Scatterplot of cells with their calculated pseudotime and FACS derived CD38 expression, annotated with their gating (middle) or CD34 expression (left). c Heatmap of cells in the columns ordered in pseudotime and 479 selected proteins (Methods) in the rows. Proteins were clustered hierarchically into five clusters. Imputed protein expression values, CD34, CD38 and pseudotime for the ordered cells were smoothed by applying a moving average across 50 cells. Protein expression is normalized between 0 and 1. d Expression values of all proteins in each cluster were aggregated to a signature by taking the mean and normalizing between 0 and 1. Top: Signatures are plotted on top of the diffusion map. Bottom: Scatterplot of cells with their pseudotime and the signature of each cluster, annotated with their gating. Source data are provided as a Source Data file.
Fig. 6
Fig. 6. FACS differentiation assay of OCI-AML8227 culture system.
a Leukemia stem cells (LSCs) and progenitors were sorted and their differentiation was assessed over a 10-day period using FACS analysis. b Proposed differentiation of LSCs and progenitors. c Cell proliferation of cultures initiated by LSCs or progenitors as biological duplicates. Source data are provided as a Source Data file.
Fig. 7
Fig. 7. Integration of unbalanced scMS datasets.
Diffusion map and UMAP embedding of integrated dataset (2514 cells, 917 proteins), overlaid with the FACS derived gated populations, CD34 and CD38 expression. BLAST = blasts, PROG = progenitors, LSC = leukemia stem cells. Source data are provided as a Source Data file.

Comment in

Similar articles

Cited by

References

    1. Treutlein B, et al. Reconstructing lineage hierarchies of the distal lung epithelium using single-cell RNA-seq. Nature. 2014;509:371–375. doi: 10.1038/nature13173. - DOI - PMC - PubMed
    1. Popescu DM, et al. Decoding human fetal liver haematopoiesis. Nature. 2019;574:365–371. doi: 10.1038/s41586-019-1652-y. - DOI - PMC - PubMed
    1. van Galen P, et al. Single-cell RNA-Seq reveals AML hierarchies relevant to disease progression and immunity. Cell. 2019;176:1265–1281.e24. doi: 10.1016/j.cell.2019.01.031. - DOI - PMC - PubMed
    1. Trapnell C. Defining cell types and states with single-cell genomics. Genome Res. 2015;25:1491–1498. doi: 10.1101/gr.190595.115. - DOI - PMC - PubMed
    1. Paul F, et al. Transcriptional heterogeneity and lineage commitment in myeloid progenitors. Cell. 2015;163:1663–1677. doi: 10.1016/j.cell.2015.11.013. - DOI - PubMed

Publication types

Grants and funding