. 2021 Jun 7;12(1):3334.
doi: 10.1038/s41467-021-23675-y.

The regulatory landscape of Arabidopsis thaliana roots at single-cell resolution

Affiliations

The regulatory landscape of Arabidopsis thaliana roots at single-cell resolution

Michael W Dorrity et al. Nat Commun. .

Abstract

The scarcity of accessible sites that are dynamic or cell type-specific in plants may be due in part to tissue heterogeneity in bulk studies. To assess the effects of tissue heterogeneity, we apply single-cell ATAC-seq to Arabidopsis thaliana roots and identify thousands of differentially accessible sites, sufficient to resolve all major cell types of the root. We find that the entirety of a cell's regulatory landscape and its transcriptome independently capture cell type identity. We leverage this shared information on cell identity to integrate accessibility and transcriptome data to characterize developmental progression, endoreduplication and cell division. We further use the combined data to characterize cell type-specific motif enrichments of transcription factor families and link the expression of family members to changing accessibility at specific loci, resolving direct and indirect effects that shape expression. Our approach provides an analytical framework to infer the gene regulatory networks that execute plant development.


Conflict of interest statement

The authors declare no competing interests.

Figures
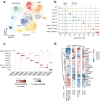
Fig. 1
Fig. 1. scATAC-seq identifies known root cell types.
a UMAP dimensionality reduction plot of root cells using peak-level scATAC data. Cells are colored according to Louvain clusters, and broad tissue types are indicated with transparent shading. b Pseudo-bulked peak tracks generated by combining ATAC data from all cells within a cluster. Each column represents a single locus in the genome that shows cell type-specific accessibility; each row represents a cell type, and each column shows an example marker peak for each type. Colors match those in previous panel. A cluster residing between the epidermis and endodermis clusters, with expression of markers from both cell types (Supplementary Fig. 2B, C) was given the label “c/e pre” (precursor of cortex/endodermis, second row), and epidermis was shortened to “epi”. c Dotplot showing marker genes for each cell type cluster. Each column represents a single gene’s activity score, the summed accessibility of its gene body and promoter sequence (−400 bp from transcription start site). The color of each dot indicates the magnitude of accessibility and the size of each dot represents the fraction of cells in each cell type showing accessibility at that gene. d Heatmap showing the predicted effect, across all peaks, of motifs from each Arabidopsis transcription factor family on cell type-specific accessibility. Darker shades of red indicate that presence of the motif is correlated with increased accessibility in that cell type, whereas shades of blue indicate that the motif is anti-correlated with accessibility. The mean effect all transcription factors within a given family are shown as rows, and each column represents a cell type. Source data for UMAP projection and cell annotations (a) are provided as a Source Data file.
Fig. 2
Fig. 2. scATAC-seq data can be integrated with scRNA-seq data to identify cell types.
a UMAP co-embedding of root scATAC cells alongside root scRNA cells. Cells are colored by broad tissue type, with scATAC cells colored in lighter shades and scRNA cells in darker shades. b UMAP from a, but showing only cells from the scATAC-seq experiment; c shows only cells from the scRNA-seq experiment.
Fig. 3
Fig. 3. scATAC-seq identifies distinct sub-types of endodermal cells.
a Violin plots showing specific patterns of accessible genes that mark each endodermal sub-type. Two examples are given for each endodermal sub-type, with gene-level accessibility scores indicated for all other cell types. b UMAP of all cells colored by accessibility of the BLUEJAY gene, which marks endodermal type 3; corresponding violin plot for this gene in lower left panel in a. c Boxplot showing an increase in median developmental progression of each endodermal sub-type, as determined by average transcriptional complexity in the nearest 25 scRNA neighbors of each scATAC cell in the co-embedded representation from Fig. 2a; right inset shows UMAP of endodermal cells with each cell colored by the average developmental progression of its scRNA neighbors, mirroring the gradual increase seen in left panel. Boxplots are generated using values from individual endodermis cells (early n = 489 cells, mid n = 141 cells, late n = 225 cells); whiskers represent 1.5 times the interquartile range of the data, the box represents the interquartile range, and the horizontal line in the box represents the median. d Boxplot showing an increase in median levels of endoreduplication across endodermal sub-types, ascertained as in c, but instead using a gene expression signature of endoreduplication; right inset shows UMAP of endodermal cells with each cell colored by the average endoreduplication score of its scRNA neighbors, with highest levels seen in endodermal sub-types 2 and 3 (number of cells, n, identical to previous panel).
Fig. 4
Fig. 4. Prediction of candidate regulatory transcription factors from integrated scATAC and scRNA data.
a Dotplot heatmap showing predicted expression of all WRKY family transcription factors across all cells. The color of each dot indicates the magnitude of predicted expression of each gene and the size of each dot represents the fraction of cells in each cell type showing expression at that gene; genes (rows) are ordered by the specificity of their epidermis expression. b UMAP plot of cells derived from scATAC experiment, but colored by predicted expression of an epidermis-specific WRKY transcription factor, TTG2. c Pseudo-bulked accessibility tracks of epidermis peaks whose accessibility showed a significant association with predicted TTG2 expression. Cells with higher TTG2 expression are shown in lighter shades. All panels show examples of significant (q < 0.05) positive associations of TTG2 expression with peak accessibility, with exception of the lower right panel. The presence or absence of a WRKY binding motif is indicated below each peak. d Barplot showing fraction of WRKY binding motifs in peaks of the epidermis, cortex, and pre-cursor type that showed significant association with TTG2 expression. Peaks whose accessibility showed positive associations with expression are labeled as “opening”; those with negative associations are labeled as “closing”.

References

    1. Brady SM, et al. A high-resolution root spatiotemporal map reveals dominant expression patterns. Science. 2007;318:801–806. doi: 10.1126/science.1146265. - DOI - PubMed
    1. Jean-Baptiste, K. et al. Dynamics of gene expression in single root cells of A. thaliana. Plant Cell31, tpc.00785.2018 (2019). - PMC - PubMed
    1. Shulse CN, et al. High-throughput single-cell transcriptome profiling of plant cell types. Cell Rep. 2019;27:2241–2247.e4. doi: 10.1016/j.celrep.2019.04.054. - DOI - PMC - PubMed
    1. Zhang TQ, Xu ZG, Shang GD, Wang JW. A single-cell RNA sequencing profiles the developmental landscape of Arabidopsis root. Mol. Plant. 2019;12:648–660. doi: 10.1016/j.molp.2019.04.004. - DOI - PubMed
    1. Ryu KH, Huang L, Kang HM, Schiefelbein J. Single-cell RNA sequencing resolves molecular relationships among individual plant cells. Plant Physiol. 2019;179:1444–1456. doi: 10.1104/pp.18.01482. - DOI - PMC - PubMed

Publication types