. 2021 Jun 7;12(1):3410.
doi: 10.1038/s41467-021-23747-z.

Transforming absolute value to categorical choice in primate superior colliculus during value-based decision making

Affiliations

Transforming absolute value to categorical choice in primate superior colliculus during value-based decision making

Beizhen Zhang et al. Nat Commun. .

Abstract

Value-based decision making involves choosing from multiple options with different values. Despite extensive studies on value representation in various brain regions, the neural mechanism for how multiple value options are converted to motor actions remains unclear. To study this, we developed a multi-value foraging task with varying menu of items in non-human primates using eye movements that dissociates value and choice, and conducted electrophysiological recording in the midbrain superior colliculus (SC). SC neurons encoded "absolute" value, independent of available options, during late fixation. In addition, SC neurons also represent value threshold, modulated by available options, different from conventional motor threshold. Electrical stimulation of SC neurons biased choices in a manner predicted by the difference between the value representation and the value threshold. These results reveal a neural mechanism directly transforming absolute values to categorical choices within SC, supporting highly efficient value-based decision making critical for real-world economic behaviors.


Conflict of interest statement

The authors declare no competing interests.

Figures

Fig. 1
Fig. 1. Saccade foraging task.
a Two example trials of the saccade foraging task. The 4 × 4 array was composed of targets of three colors. Each target color was associated with a particular value determined by its water reward magnitude divided by the fixation time required to harvest this reward. When monkeys fixated a target for the pre-specified time, the color would turn into an equiluminant gray and corresponding reward was delivered, cueing the move to the subsequent target. In this example block, the rank of target values descended from green to blue to red. For illustration purposes, purple is used to represent red color in task paradigm. In successive trials, the association between color and value remained constant but the location of the colored targets within the array was randomized. The array size and orientation were tailored such that when the monkey was fixating a target (white cross), an adjacent target was positioned in the center of the pre-mapped response field (RF) of the isolated SC neuron (white dashed circle). The white arrows illustrate how the fovea and RF move in tandem as monkeys foraged targets in the array (More detail in Supplementary Movie 1). In a small number of experiments, larger response field eccentricities necessitated smaller 3 × 4 or 3 × 3 target arrays to fit on the visual display. b Examples of different menus. As monkeys tended to harvest targets in descending order of their value, the menu of items went from 3-values remaining (top), to 2-values remaining (middle), and finally 1-value remaining (bottom).
Fig. 2
Fig. 2. Monkeys were efficient foragers choosing targets in descending order of their value.
a Scan path of the 91st trial in a representative experiment. This trial is shown in Supplementary Movie 1 along with audio of a simultaneously recorded SC neuron. The white line represents the eye trace and the numbers indicate the order of successfully harvested targets. The start and end of the trial is denoted with triangle and asterisk, respectively. In some instances, such as the fixation between eye position 12 and 13, the monkey did not hold fixation long enough to successfully harvest the target. These instances were not included in subsequent analyses. The colored numbers in the legend correspond with the value of the associated target colors. This particular trial/experiment is denoted by larger data points in subsequent panels. For illustration purposes, purple is used to represent red color in task paradigm. b Calculating the rank value of target colors. Each dot represents the value based on the order in which a particular class of colored targets was selected within a given trial. The colored lines represent the sliding average of rank value over five trials. The dashed line represents the time to behavioral acquisition (see “Methods”) when a stable value ranking was established as determined. The right colored numbers indicate the value ranking of each color which is measured from the order of median rank value across the block. c Same format as panel b except an unsignaled change in the target color-value relationship occurred at the solid line. Only the trials before the rule changes were included in population analyses. d The monkey’s efficiency at harvesting water for the representative experiment shown in (b). The black line represents the sliding average of efficiency over five trials. The horizontal line represents 95% confidence interval of chance efficiency by simulating random selection for 5000 trials. e Foraging efficiencies across all blocks plotted against their corresponding chance efficiencies. Only experiments that displayed significantly efficient and stable preference (black filled dots) were included in further analyses whereas inefficient (gray filled dots) and unstable blocks (unfilled black dots) were excluded. f Choice preferences of blocks in population neuronal analyses as menu transitioned from 3-values to 2-values, and to 1-value targets remaining. Source data are provided as a Source data file. For the boxplots, on each box, the central mark is the median, the edges of the box are the 25th and 75th percentiles, and the whiskers extend to the most extreme data points that the algorithm considers not to be outliers. Outliers are data points that are larger than Q3 + 1.5 × (Q3 − Q1) or smaller than Q1 – 1.5 × (Q3 − Q1), where Q1 and Q3 are the 25th and 75th percentiles, respectively (N.B.: The association between target color and value ranking was randomized between each experiment. However, for display purposes, purple, green, and blue will indicate the number 1, 2, and 3 value rankings, respectively, throughout the remainder of the paper.).
Fig. 3
Fig. 3. Population neuronal activity reflected target value in the response field and predicted upcoming saccade choice.
Note that plots represent a the value of the target in the RF (line color—R1 (purple) denotes highest rank value; R2 (green) denotes middle rank value; R3 (blue) denotes lowest rank value; harvested (gray) denotes previously harvested target with no value), or b choices directed into (Choice-in) or out (Choice-out) of the response field rather than properties of the currently fixated target. The left side of each panel is aligned on the beginning of fixation (fix), the middle is aligned on reward delivery (rew), and the right is aligned on saccade onset (sac). The total duration of the spike density waveforms could not be shown because the fixation time varied across targets and experiments. The shaded regions surrounding each line represent SEM.
Fig. 4
Fig. 4. The evolution of value and choice signals in SC activity across 3 menus.
a Normalized neuronal activity was segregated based on the rank value of the target in the response field and whether a saccade was ultimately directed to the response field target (solid lines) or a target outside the response field (dashed lines). Otherwise, the same format as Fig. 3. b The evolution of the population regression coefficients for value ranking (black) and choice direction (gray). There is no value plot in the rightmost 1-value remaining panel because all remaining targets had the same, lowest value. The time points with statistically significant regression coefficients by value ranking (black dots) and choice direction (gray dots) was shown at the bottom of the panel (t test, P < 0.05, with false-discovery rate correction). c The evolution of neuronal choice selectivity toward targets of different value rankings. The receiver-operating characteristic analyses were done between activities associated with choices toward the response field target versus targets outside the response field that shared the same value. All shaded regions represent SEM.
Fig. 5
Fig. 5. Menu updating of the value-threshold level and value representations.
a Normalized neuronal activity during the late fixation period (last 300 ms before reward delivery, rew). Same format as Fig. 4a. b Neuronal activity associated with choice-in conditions. For conditions from left to right n = 53, 51, 7, 53, 44, and 47 blocks. For multiple-menu comparisons (labeled with any number of *) from left to right P = 2.6 × 10−3, 5.8 ×  10−8, 7.7 × 10−5. c Relative saccade latencies toward different value ranking targets across the 3 menus. All latencies are calculated relative to the 1st value ranking targets in the 3-values remaining menu. For conditions from left to right n = 53, 50, 14, 53, 40, and 53 blocks. For multiple-menu comparisons (labeled with any number of *) from top to down P = 1.7 × 10−10, 3.4 × 10−7, 0.011. d Neuronal activity associated with choice-out conditions. For conditions from left to right n = 49, 53, 49, 53, 53, 39, 53, 53, and 53 blocks. For multiple-value comparisons (labeled with any number of *) from top to down P = 8.5 × 10−66, 3.3 × 10−42, 4.0 × 10−14, 1.1 × 10−46, 1.4 × 10−18, 4.9 × 10−14. Data are presented for each value ranking when there were three values (3 V), two values (2 V), or one value (1 V) targets remaining in the array. n in (bd) represents the number of blocks with more than 3 cases for the condition. For (bd), source data are provided as a Source data file. For the boxplots, on each box, the central mark is the median, the edges of the box are the 25th and 75th percentiles, and the whiskers extend to the most extreme data points that the algorithm considers not to be outliers. Outliers are data points that are larger than Q3 + 1.5 × (Q3 − Q1) or smaller than Q1 − 1.5 × (Q3 − Q1), where Q1 and Q3 are the 25th and 75th percentiles, respectively (n.s., nonsignificant, *P < 0.05, **P < 0.01, ***P < 0.001; n-way ANOVA tests, post hoc tests were done with Bonferroni correction).
Fig. 6
Fig. 6. Neuronal selectivity remained remarkably constant across conditions and menus.
a The evolution of neuronal choice selectivity as determined by receiver-operating characteristic analysis when comparing choice-in activities of each value ranking with the highest available choice-out activity. All shaded regions represent SEM. b The average predictive indexes during the late fixation period from (a). For conditions from left to right n = 49, 48, 5, 48, 38, and 33. n represents the number of blocks with at least five cases for the condition. Data are presented for each value ranking when there were three values, two values, or one value ranking targets remaining in the array. For each value ranking, two-sided, one-way t test, from left to right, P = 4.8 × 10−8, 0.040, 0.54, 7.2 × 10−8, 0.0053, and 3.6 × 10−5, respectively. N-way ANOVA tests, factor of value, P = 0.65, factor of menu, P = 0.36. Source data are provided as a Source data file. For the boxplots, on each box, the central mark is the median, the edges of the box are the 25th and 75th percentiles, and the whiskers extend to the most extreme data points that the algorithm considers not to be outliers. Outliers are data points that are larger than Q3 + 1.5 × (Q3 − Q1) or smaller than Q1 − 1.5 × (Q3 − Q1), where Q1 and Q3 are the 25th and 75th percentiles, respectively (n.s. nonsignificant, *P < 0.05, **P < 0.01, ***P < 0.001).
Fig. 7
Fig. 7. Sub-threshold micro-stimulation applied during the late fixation period biased choice.
a The proportion of choices directed toward the stimulation site target in stimulation condition vs. non-stimulation control condition across the 3 menus. Purple, green, and blue denote when 1st, 2nd, and 3rd value ranking targets were located at the stimulation site, respectively. The dashed line represents the line of unity. b Difference in the proportion of saccades directed toward the stimulation site under stimulation condition minus non-stimulation condition. All the 72 blocks in stimulation experiments were included. Wilcoxon signed-rank test, two-sided, from left to right, P = 3.2 × 10−10, 8.7 × 10−8, 0.90, 1.2 × 10−6, 0.28, and 1.3 × 10−4, respectively. Source data are provided as a Source data file. For the boxplots, on each box, the central mark is the median, the edges of the box are the 25th and 75th percentiles, and the whiskers extend to the most extreme data points that the algorithm considers not to be outliers. Outliers are data points that are larger than Q3 + 1.5 × (Q3 – Q1) or smaller than Q1 – 1.5 × (Q3 – Q1), where Q1 and Q3 are the 25th and 75th percentiles, respectively.
Fig. 8
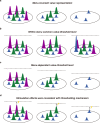
Fig. 8. Four findings in the SC support for thresholding mechanisms in value-based decision making.
The Gaussian curves represent late fixation population activities on the SC map associated with the highest (purple), middle (green), and lowest (blue) valued targets in the visual array. The dashed line represents the value-threshold level. a The value of targets was represented across the SC in an absolute manner that did not vary as the menu decreased from 3-values remaining (left) to 2-values remaining (middle) to 1-value remaining (right). b Within a given menu, neuronal activity associated with the selected option reached the same value-threshold level regardless of whether the highest (left), middle (middle), or lowest (right) valued target was chosen. c The value-threshold levels systematically decreased as the menu changed from 3-values remaining (left), 2-values remaining (middle), and 1-value remaining (right). d Stimulation effect was a function of the distance between absolute value representations and value-threshold levels.

Similar articles

Cited by

References

    1. Morgenstern, O. & Von Neumann, J. Theory of Games and Economic Behavior (Princeton University Press, 1953).
    1. Kahneman, D. & Tversky, A. in Handbook of the Fundamentals of Financial Decision Making: Part I 99–127 (World Scientific, 2013).
    1. Kreps, D. M. A Course in Microeconomic Theory (Princeton University Press, 1990).
    1. Levy DJ, Glimcher PW. The root of all value: a neural common currency for choice. Curr. Opin. Neurobiol. 2012;22:1027–1038. doi: 10.1016/j.conb.2012.06.001. - DOI - PMC - PubMed
    1. Padoa-Schioppa C, Assad JA. Neurons in the orbitofrontal cortex encode economic value. Nature. 2006;441:223–226. doi: 10.1038/nature04676. - DOI - PMC - PubMed

Publication types