. 2021 Jun 7;12(1):3373.
doi: 10.1038/s41467-021-23765-x.

Hippocampal place cell sequences differ during correct and error trials in a spatial memory task

Affiliations

Hippocampal place cell sequences differ during correct and error trials in a spatial memory task

Chenguang Zheng et al. Nat Commun. .

Abstract

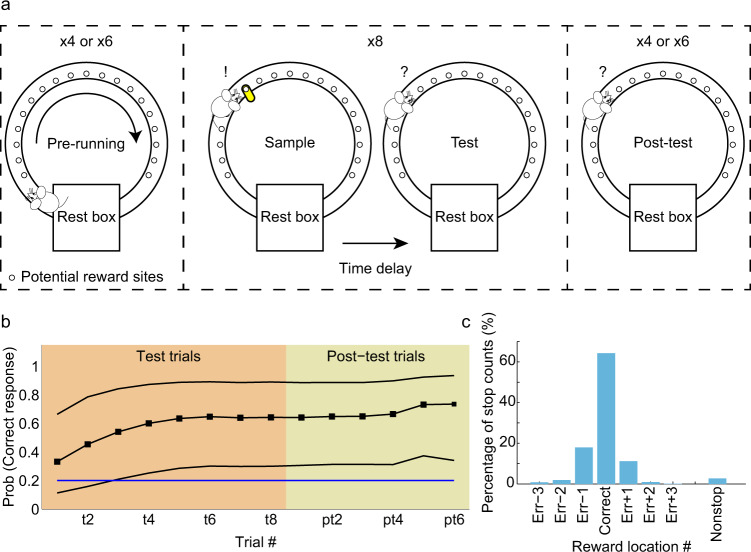
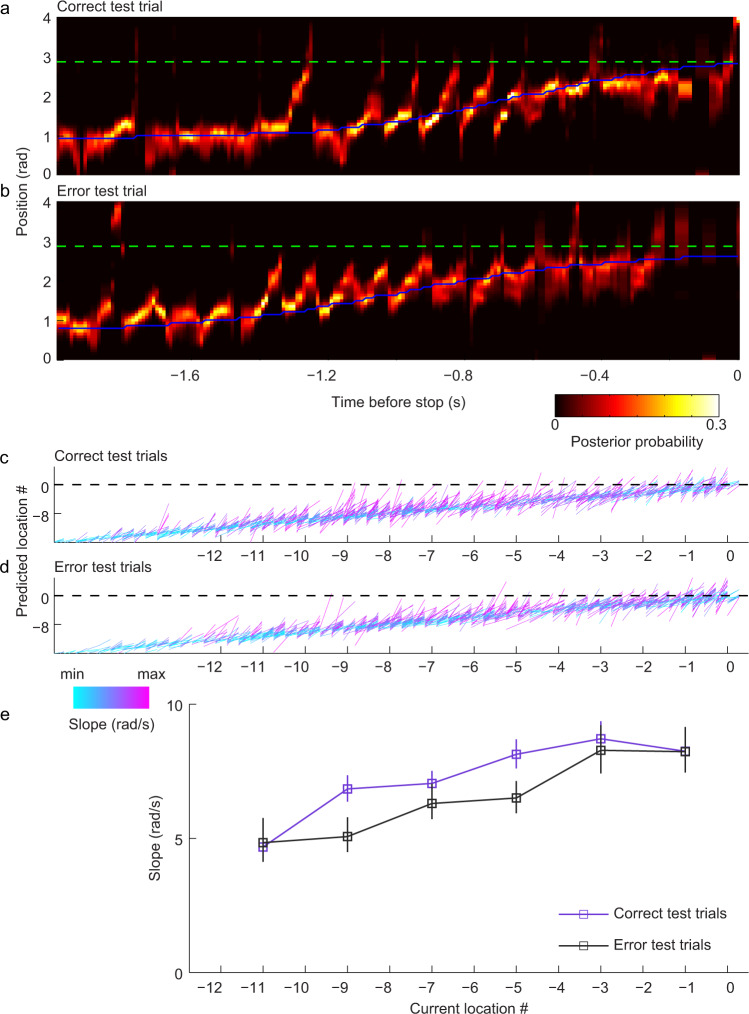
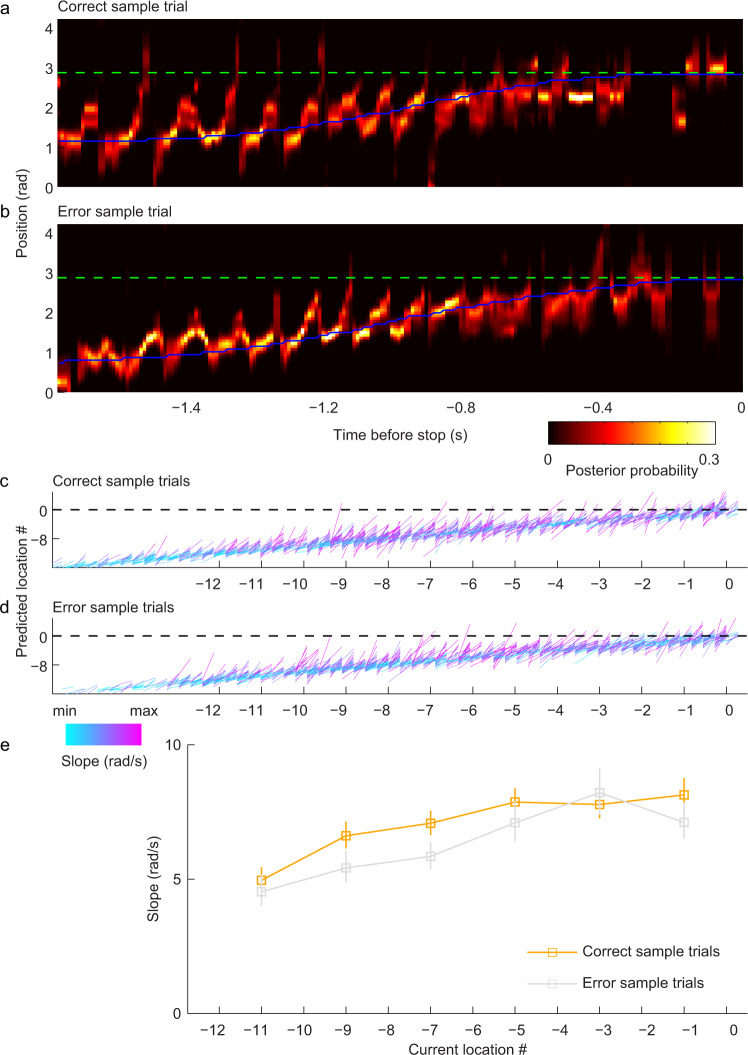
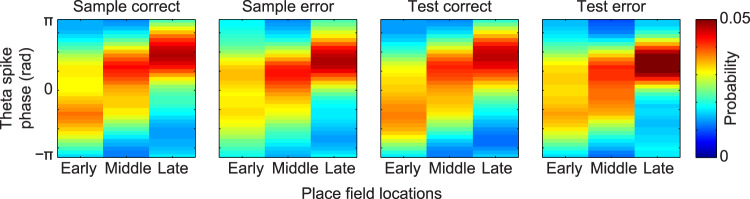
Theta rhythms temporally coordinate sequences of hippocampal place cell ensembles during active behaviors, while sharp wave-ripples coordinate place cell sequences during rest. We investigated whether such coordination of hippocampal place cell sequences is disrupted during error trials in a delayed match-to-place task. As a reward location was learned across trials, place cell sequences developed that represented temporally compressed paths to the reward location during the approach to the reward location. Less compressed paths were represented on error trials as an incorrect stop location was approached. During rest periods of correct but not error trials, place cell sequences developed a bias to replay representations of paths ending at the correct reward location. These results support the hypothesis that coordination of place cell sequences by theta rhythms and sharp wave-ripples develops as a reward location is learned and may be important for the successful performance of a spatial memory task.


Conflict of interest statement

The authors declare no competing interests.

Figures

Fig. 1
Fig. 1. Behavioral task and performance.
a Schematic of delayed match-to-sample spatial memory task. Each session consisted of pre-running trials, sample-test trials, and post-test trials. In pre-running trials, rats ran 4 or 6 laps unidirectionally on a circular track without receiving any reward. One of the potential reward sites was pseudo-randomly chosen for each session. In each session, rats performed 8 paired sample-test trials. The correct reward location was marked with a visual cue (yellow marker) during the sample phase. The marker was removed in the test phase, which began 30 sec after the sample phase. After a 5-minute delay, a post-test phase of the task began, which consisted of test trials only (i.e., no cue marked the correct reward location during this phase). Rats received a reward if they stopped at the correct goal location during the sample, test, and post-test trials. The goal/reward location remained constant within a session. b Behavioral performance across test (orange, t1-t8) and post-test (beige, pt1-pt6) trials is shown. Black solid lines represent the mean probability of making a correct choice across recording sessions, bounded by 95% confidence intervals. The blue horizontal line indicates chance performance. c Proportion of trials in which rats stopped at different locations in test and post-test trials pooled across all recording sessions. Err-n and Err+n (n = 1, 2, 3) indicate stop locations that were n locations before or after the correct reward location. Nonstop indicates that rats did not stop at any location in that trial.
Fig. 2
Fig. 2. Predictive firing in place cell ensembles developed with learning.
A Bayesian decoder (see Methods) was applied to ensemble spiking activity to estimate posterior probability distributions across sample-test trials. a–c The sum of posterior probability (P(x | n)) extending ahead of rats to the stop location (i.e., the sum of the maximum 5 posterior probabilities from 2 bins ahead of the rat’s current location to the stop location) as rats ran toward the stop location is shown for each trial (Multiple linear regression: n = 224 trials, no significant interaction effect between trial type and trial number: t(436) = −0.5, p = 0.6; no significant effect of trial type: t(436) = 0.5, p = 0.6; significant effect of trial number: t(436) = 2.1, p = 0.04). Regression lines are shown for sample and test trials separately (correlation coefficient: r = 0.26, p = 6.4 × 10−5 for sample and r = 0.19, p = 0.005 for test). Each dot indicates the sum for a lap of the indicated trial type. The sum is shown for all trials (a), correct trials (b), and error trials (c). df The maximum posterior probability (P(x | n)) estimates behind rats’ current positions (i.e., the maximum 5 posterior probabilities from the beginning of the track to a rat’s current position) was summed for each lap. In contrast to the results reported in (ac), the sum of posterior probability behind a rat’s current position did not increase across trials for all trials (d; multiple linear regression model, n = 224 trials, F(3,439) = 2.2, p = 0.08; no significant trial type by trial number interaction effect: t(436) = −0.2, p = 0.8; no significant effect of trial type: t(436) = −0.8, p = 0.4; no significant effect of trial number: t(436) = −0.3, p = 0.8), correct trials (e), and error trials (f). gi The sum of the posterior probability (P(x | n)) estimates from the beginning of the trajectory to the stop location is also shown for each lap for all trials (g; repeated measures ANOVA: n = 224 trials, no significant main effect of trial number: F(7,378) = 1.6, p = 0.2), correct trials (h) and errors trials (i).
Fig. 3
Fig. 3. Place cell sequences exhibited steeper slopes in correct test trials than in error test trials.
a Example color-coded posterior probability distribution across time from a correct test trial. The green dashed line marks the correct goal location. The blue solid line represents the rat’s actual position at each time point. Trajectories were aligned according to the time when the animal stopped (time = 0). b Same as (a) but for an example error test trial in the same session. The rat stopped one location (~0.2 rad) earlier than the correct goal location in this trial (see Supplementary Fig. 2d for an example trial in which the rat stopped one location too late). c, d For purposes of illustration and comparison, place cell sequences in correct test trials (c) were randomly down-sampled to match the number of place cell sequences in error test trials (d). Fitted lines of detected place cell sequences in correct (c) and error (d) test trials are shown across location numbers as rats approached their stop location (indicated as location 0; same location as correct goal location for correct trials). The x and y coordinates of each sequence’s fitted line indicate current position and predicted position (i.e., maximum posterior probability), respectively. The slope of the fitted line for each sequence is shown color-coded. The black dashed line signifies stop location. Decoded locations within a sequence that extended beyond the stop location were included as part of that sequence, and locations in the sequence that extended beyond the stop location were included in the slope calculation. e Mean slopes of the lines that were fit to detected place cell sequences are shown across current locations as rats approached their stop location (ANOVA, main effect of trial type (i.e., correct vs. error): F(1,2826) = 15.0, p = 1.1 × 10⁻⁴, n = 1879 positive sequences detected from correct test trials and n = 959 positive sequences detected from error test trials). Slope measurements are plotted for the center of each location bin (i.e., locations −12 to −10 plotted at location −11, locations −10 to −8 plotted at location −9, etc.). Data are presented as mean ± error bars. Error bars indicate 95% bootstrapped confidence intervals.
Fig. 4
Fig. 4. Place cell sequences exhibited steeper slopes in correct sample trials than in error sample trials.
ae Same as (ae) in Fig. 3 but for sample trials. Note that correct and error trials were defined by rats’ responses in subsequent test trials (main effect of trial type: F(1,2838) = 15.9, p = 6.9 × 10−5, n = 1818 positive sequences detected from correct sample trials and n = 1032 positive sequences detected from error sample trials). Data are presented as mean ± error bars (95% bootstrapped confidence intervals) in (e).
Fig. 5
Fig. 5. Place cells active at the beginning of the trajectory toward the reward fired at earlier theta phases in correct trials than in error trials.
The probability of observing a spike at different theta phases for spikes from place cells with fields located at early, middle, or late locations in the trajectory is shown for each trial type (2-way ANOVA Harrison–Kanji test for population means of circular data, effect of trial type x cell category interaction: χ2(6) = 21.8, p = 0.001, n = 19428 spikes; for comparison of theta phases of “Early” cells between correct and error trials, 2-way ANOVA Harrison-Kanji test for population means, significant main effect of trial type (i.e., correct vs. error) for cells that fired early in the sequence: χ2(2) = 7.8, p = 0.02, n = 8044 spikes). Phase estimates were only obtained from spikes within the place cell sequences detected from 10 to 5 locations before the goal.
Fig. 6
Fig. 6. Replay quality in the rest box was similar between correct and error trials.
a Example replay events are shown for correct and error trials. The color scale indicates posterior probability from a Bayesian decoder (see Methods), and each example event’s r2 value is provided above its probability distribution. Replay events were detected while rats were in the rest box between sample and test trials. The green and blue triangles mark reward and stop positions, respectively, from each trial. b Solid lines indicate distributions of r2 values for all detected SWR events in correct and error trials. Shaded error bars indicate 95% bootstrapped confidence intervals.
Fig. 7
Fig. 7. A bias for replay events to terminate at the correct goal location emerged after learning during correct trials.
a Mean posterior probabilities of replay events in correct trials. Replay events were aligned to the correct goal location on the vertical axis (i.e., location 0, white dashed line) and normalized time of replay event on the horizontal axis. b The sum of posterior probability for the last normalized time bin across replay events for each location number relative to the goal. Dashed black lines mark 95% confidence intervals of a null distribution generated by randomly shifting positions of each replay event (see Methods). A red bar marks the location number with a posterior probability sum that exceeded the corresponding 95% confidence interval (i.e., location 0, which corresponds to the correct goal location). c, d Same as (a, b) but for error trials. Note that no positions during error trials showed a posterior probability sum that was greater than the corresponding confidence interval.
Fig. 8
Fig. 8. Locations represented at the end of replay sequences plotted against animals’ actual stop locations.
The y-axis shows the location represented at the end of each replay sequence detected during rest periods of all trials (correct trials correspond to stop location 0 and error trials correspond to other stop locations). The x-axis shows rats’ actual stop locations for all trials. Actual stop locations ranging from −3 to −1 indicate that rats stopped at incorrect locations that were 3 to 1 locations before the correct location (i.e., undershoot error trials). Actual locations ranging from 1 to 3 indicate stop locations that were 1 to 3 locations after the correct reward location (i.e., overshoot error trials). Actual locations equal to 0 indicate that rats stopped at the correct reward locations (i.e., correct trials). The colorscale shows the trial counts for each x–y pairing. Results from errors in trials 1–4, trials 5–8, and post-test trials are shown in left, middle, and right panels, respectively. Matthews correlation coefficients were close to zero (equal to 0.0715, 0.0390, 0.0160, respectively, for left, middle, and right panels, with corresponding bootstrap estimates of 0.0713 ± 0.0380, 0.0431 ± 0.0271, 0.0197 ± 0.0349).

References

    1. Buzsáki G. Theta oscillations in the hippocampus. Neuron. 2002;33:325–340. doi: 10.1016/S0896-6273(02)00586-X. - DOI - PubMed
    1. Colgin LL. Mechanisms and functions of theta rhythms. Annu. Rev. Neurosci. 2013;36:295–312. doi: 10.1146/annurev-neuro-062012-170330. - DOI - PubMed
    1. Buzsáki G. Hippocampal sharp wave-ripple: a cognitive biomarker for episodic memory and planning. Hippocampus. 2015;25:1073–1188. doi: 10.1002/hipo.22488. - DOI - PMC - PubMed
    1. Colgin LL. Rhythms of the hippocampal network. Nat. Rev. Neurosci. 2016;17:239–249. doi: 10.1038/nrn.2016.21. - DOI - PMC - PubMed
    1. Buzsáki G. Theta rhythm of navigation: link between path integration and landmark navigation, episodic and semantic memory. Hippocampus. 2005;15:827–840. doi: 10.1002/hipo.20113. - DOI - PubMed

Publication types