. 2021 Jun 7;12(1):3358.
doi: 10.1038/s41467-021-23834-1.

Spatio-temporal mRNA tracking in the early zebrafish embryo

Affiliations

Spatio-temporal mRNA tracking in the early zebrafish embryo

Karoline Holler et al. Nat Commun. .

Abstract

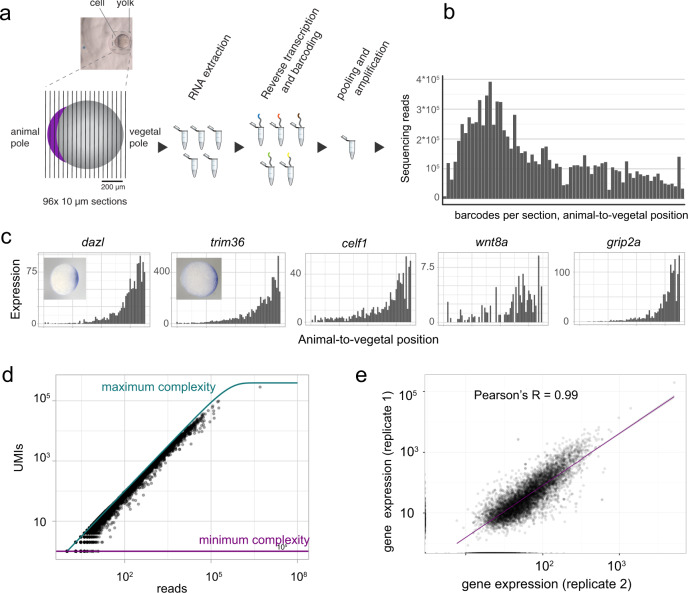
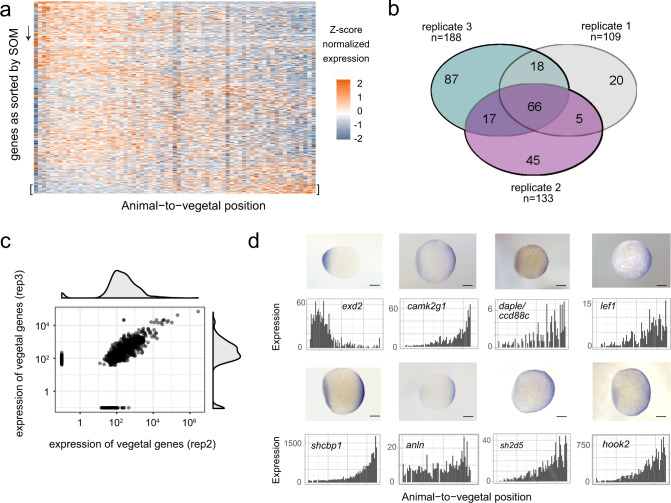
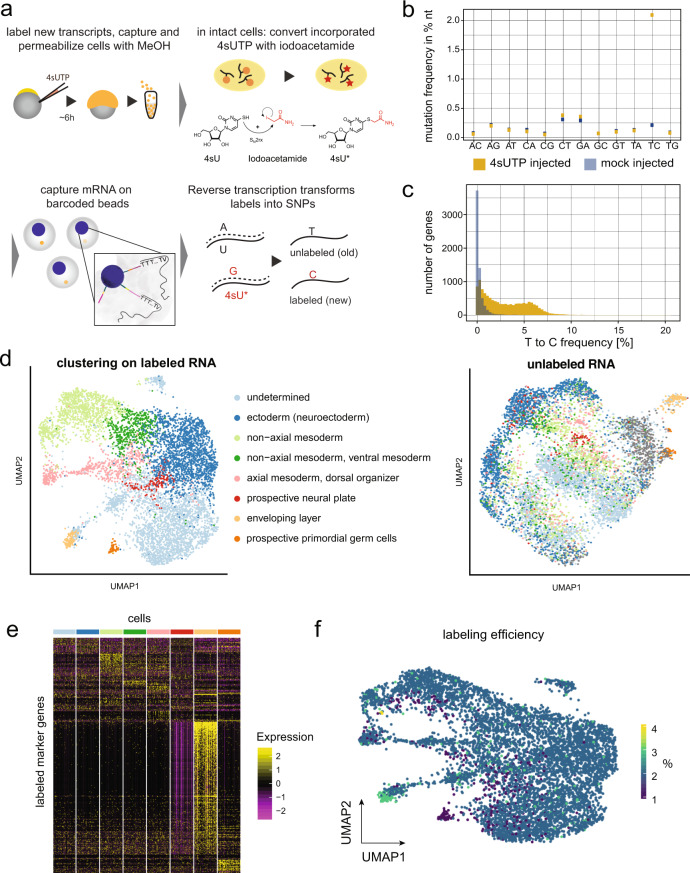
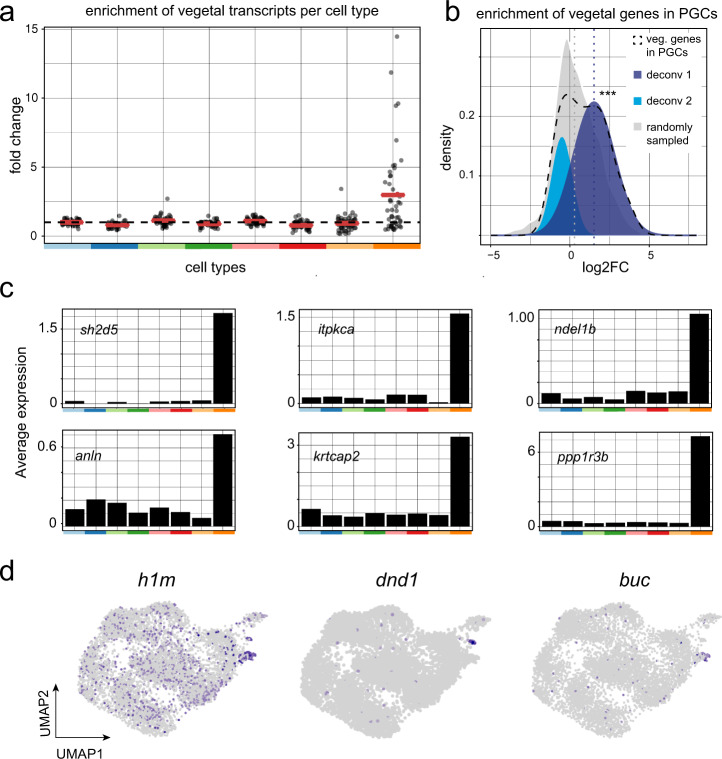
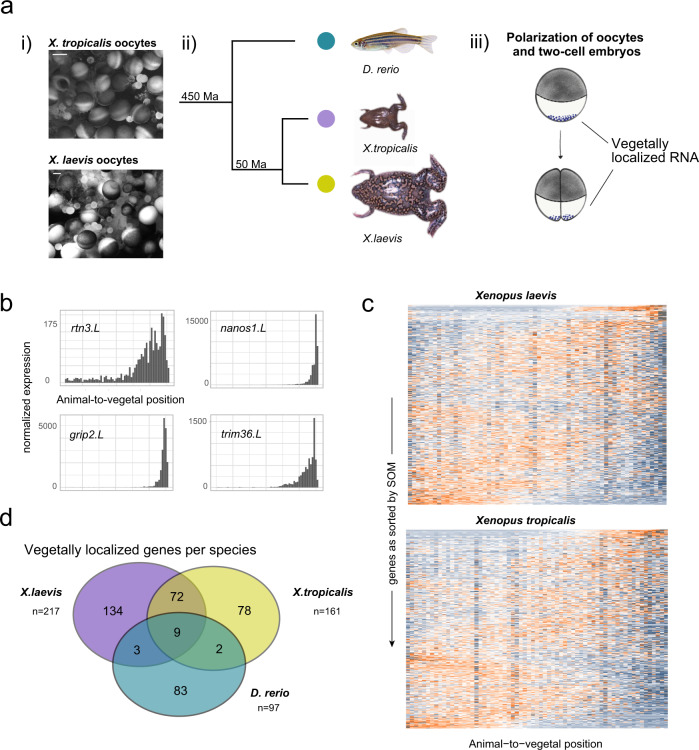
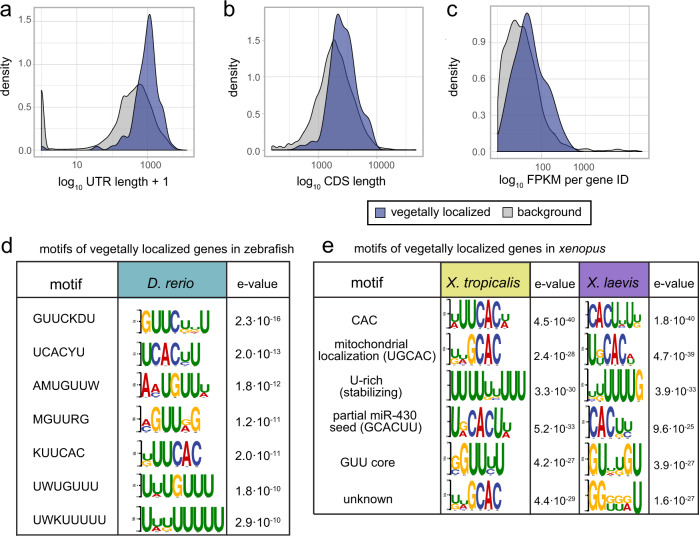
Early stages of embryogenesis depend on subcellular localization and transport of maternal mRNA. However, systematic analysis of these processes is hindered by a lack of spatio-temporal information in single-cell RNA sequencing. Here, we combine spatially-resolved transcriptomics and single-cell RNA labeling to perform a spatio-temporal analysis of the transcriptome during early zebrafish development. We measure spatial localization of mRNA molecules within the one-cell stage embryo, which allows us to identify a class of mRNAs that are specifically localized at an extraembryonic position, the vegetal pole. Furthermore, we establish a method for high-throughput single-cell RNA labeling in early zebrafish embryos, which enables us to follow the fate of individual maternal transcripts until gastrulation. This approach reveals that many localized transcripts are specifically transported to the primordial germ cells. Finally, we acquire spatial transcriptomes of two xenopus species and compare evolutionary conservation of localized genes as well as enriched sequence motifs.


Conflict of interest statement

The authors declare no competing interests.

Figures

Fig. 1
Fig. 1. Tomo-seq in one-cell stage embryos.
a Experimental outline: the embedded embryo is cryosectioned into 96 slices that are put into separate tubes. After adding spike-in control RNA, RNA is extracted. In a reverse transcription step, spatial barcodes are introduced. Samples are then pooled and amplified by in vitro transcription and a final library PCR. Scale bars are 200 µm. b Histogram shows raw transcript counts per section. c Tomo-seq tracks for the known vegetally localized genes dazl, trim36, celf1, wnt8a, and grip2a and whole-mount in situ hybridizations for dazl and trim36. d Sequencing depth, shown as UMI saturation per gene. Maximum complexity is determined as by Grün et al.. e Correlation of two tomo-seq experiments (total counts summed over all sections). Line is a linear fit to the data. The difference in scale between the two axes is caused by differences in sequencing depth between the two replicates.
Fig. 2
Fig. 2. Systematic identification of mRNA localization patterns.
a Heatmap representation of z-score normalized expression per section in a zebrafish one-cell stage embryo. Genes on the y-axis as sorted into profiles 1–50 by SOM (self-organizing map), spatial position in the embryo on the x-axis. b Vegetally localized genes per sample (profiles 48–50). c Expression correlation of vegetally localized genes between two replicates. Genes on the axes are only detected in one sample. d Comparison of tomo-seq and whole-mount in situ hybridization for selected newly described vegetally localized genes, as well as the animally localized gene exd2. Scale bars are 200 µm.
Fig. 3
Fig. 3. Single-cell RNA labeling in early zebrafish embryos.
a Schematic representation of the protocol: 4sUTP (4-thiouridine-triphosphate) injection into zebrafish one-cell stage embryos, dechorionation, dissociation into single cells at gastrulation stage, and MeOH (methanol) fixation (see “Methods” section). Incorporated 4sUTP is converted in a SN2 reaction with iodoacetamide into a cytosine analog. The single-cell solution is then loaded onto 10× Genomics Chromium, and chemical labels lead to T-to-C conversions during reverse transcription. b Nucleotide mutation frequencies of a scSLAM-seq library after injecting 4sUTP or Tris and quality filtering of the data. c Histogram of T-to-C mutations in 4sUTP- and Tris-injected embryos. d UMAP representation of cells based on labeled RNA (left side) and unlabeled RNA (right side). For the latter, we imposed cell identities as determined on the basis of labeled RNA. e Marker gene expression of labeled cells in different cell types (color code as in d). Cell number per cluster was downsampled to equal numbers. f Transcript labeling efficiency in single cells in percent, projected on the UMAP representation for labeled RNA.
Fig. 4
Fig. 4. Tracking the fate of maternal transcripts by scSLAM-seq.
a Fold change enrichment of maternal vegetally localized genes in the different cell types versus all other cells (color code as in Fig. 3d). Genes with an average expression <0.1 transcripts/cell were excluded from this analysis. Red bars represent mean values. b Deconvolution of the bimodal distribution of vegetally localized genes in PGCs (black dashed line) into two normal distributions (light and dark blue). The mean value of the dark blue distribution is significantly higher than that of a randomly sampled distribution (mgray = 0.4, mdark blue = 1.52, p value = 1.7 × 10−4, Welch’s t test, one-sided). c Average expression of most highly enriched genes in PGCs in different cell types (color code as in Fig. 3d). d Unlabeled RNA expression of established germ cell markers on a UMAP representation.
Fig. 5
Fig. 5. Evolutionary conservation of vegetal mRNA localization.
a (i) Light microscopy view of whole oocyte lobes from X. laevis and X. tropicalis before dissociation for one of the two replicates. Scale bar are 500 µm. (ii) Phylogenetic distance of Xenopus species and zebrafish as described in ref. (Ma: million years). (iii) Deposition of germ plasm and dorsal factors (as purple dots) in Xenopus oocytes and after first cell division. b Tomo-seq tracks of vegetally localized genes rtn3.L, nanos1.L, grip2.L, and trim36.L in X. laevis. c Heatmap of z-score normalized expression per section in Xenopus oocytes. Genes on the y-axis as sorted into profiles 1–50 by SOM (self-organizing map), spatial position on the x-axis. d Overlap of vegetally localized genes in zebrafish and Xenopus species, considering only genes that were expressed in all three species at the respective developmental stage.
Fig. 6
Fig. 6. 3′UTR characteristics of vegetally localized genes.
ac Comparison of sequence characteristics of expressed isoforms of vegetally localized to all genes. a Weighted 3′UTR (untranslated region) lengths: isoforms contribute according to their relative expression, mean(vegetal genes) = 1.06 kb, mean(background) = 0.6 kb, p value < 2.2 × 10−16 (two-sample Wilcoxon test). b Weighted lengths of coding sequences (CDS), mean(vegetal genes) = 2.78 kb, mean(background) = 2.42 kb, p value = 7.655 × 10−14 (two-sample Wilcoxon test). c FPKM (fragments per kilobase of transcript per million mapped reads) sum per gene ID, IDs with <10 FPKM were omitted. Mean expression of vegetal genes 64.1 FPKM, mean of background 37.4, p value < 2.2 × 10−16, (two-sample Wilcoxon test). d Results of the k-mer enrichment analysis of 3′UTRs of 216 expressed isoforms, zebrafish vegetally localized genes. Top seven motifs and logos. e Results of the k-mer enrichment analysis of the longest 3′UTR of vegetally localized genes in X. laevis and X. tropicalis, top six motifs, and their respective description based on previous publications.

References

    1. Escobar-Aguirre, M., Elkouby, Y. M. & Mullins, M. C. Localization in oogenesis of maternal regulators of embryonic development. Adv. Exp. Med. Biolo.953, 173–207 (2017). - PubMed
    1. Elkouby YM, Mullins MC. Coordination of cellular differentiation, polarity, mitosis and meiosis – new findings from early vertebrate oogenesis. Dev. Biol. 2017;430:275–287. doi: 10.1016/j.ydbio.2017.06.029. - DOI - PMC - PubMed
    1. Hashimshony T, et al. CEL-Seq2: sensitive highly-multiplexed single-cell RNA-Seq. Genome Biol. 2016;17:77. doi: 10.1186/s13059-016-0938-8. - DOI - PMC - PubMed
    1. Islam S, et al. Quantitative single-cell RNA-seq with unique molecular identifiers. Nat. Methods. 2014;11:163–166. doi: 10.1038/nmeth.2772. - DOI - PubMed
    1. Klein AM, et al. Droplet barcoding for single-cell transcriptomics applied to embryonic stem cells. Cell. 2015;161:1187–1201. doi: 10.1016/j.cell.2015.04.044. - DOI - PMC - PubMed

Publication types

MeSH terms