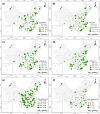
Effects of urban functional fragmentation on nitrogen dioxide (NO2) variation with anthropogenic-emission restriction in China
- PMID: 34099757
- PMCID: PMC8184851
- DOI: 10.1038/s41598-021-91236-w
Effects of urban functional fragmentation on nitrogen dioxide (NO2) variation with anthropogenic-emission restriction in China
Abstract
Urban functional fragmentation plays an important role in assessing Nitrogen Dioxide (NO2) emissions and variations. While the mediated impact of anthropogenic-emission restriction has not been comprehensively discussed, the lockdown response to the novel coronavirus disease 2019 (COVID-19) provides an unprecedented opportunity to meet this goal. This study proposes a new idea to explore the effects of urban functional fragmentation on NO2 variation with anthropogenic-emission restriction in China. First, NO2 variations are quantified by an Autoregressive Integrated Moving Average with external variables-Dynamic Time Warping (SARIMAX-DTW)-based model. Then, urban functional fragmentation indices including industrial/public Edge Density (ED) and Landscape Shape Index (LSI), urban functional Aggregation Index (AI) and Number of Patches (NP) are developed. Finally, the mediated impacts of anthropogenic-emission restriction are assessed by evaluating the fragmentation-NO2 variation association before and during the lockdown during COVID-19. The findings reveal negative effects of industrial ED, public LSI, urban functional AI and NP and positive effects of public ED and industrial LSI on NO2 variation based on the restricted anthropogenic emissions. By comparing the association analysis before and during lockdown, the mediated impact of anthropogenic-emission restriction is revealed to partially increase the effect of industrial ED, industrial LSI, public LSI, urban functional AI and NP and decrease the effect of public ED on NO2 variation. This study provides scientific findings for redesigning the urban environment in related to the urban functional configuration to mitigating the air pollution, ultimately developing sustainable societies.
Conflict of interest statement
The authors declare no competing interests.
Figures


Similar articles
-
Unexpected rise of ozone in urban and rural areas, and sulfur dioxide in rural areas during the coronavirus city lockdown in Hangzhou, China: implications for air quality.Environ Chem Lett. 2020;18(5):1713-1723. doi: 10.1007/s10311-020-01028-3. Epub 2020 Jun 12. Environ Chem Lett. 2020. PMID: 32837481 Free PMC article.
-
Distinct urban-rural gradients of air NO2 and SO2 concentrations in response to emission reductions during 2015-2022 in Beijing, China.Environ Pollut. 2023 Sep 15;333:122021. doi: 10.1016/j.envpol.2023.122021. Epub 2023 Jun 18. Environ Pollut. 2023. PMID: 37339730
-
Assessing the impact of urban form and urbanization process on tropospheric nitrogen dioxide pollution in the Yangtze River Delta, China.Environ Pollut. 2023 Nov 1;336:122436. doi: 10.1016/j.envpol.2023.122436. Epub 2023 Aug 26. Environ Pollut. 2023. PMID: 37640224
-
The impact of the congestion charging scheme on air quality in London. Part 1. Emissions modeling and analysis of air pollution measurements.Res Rep Health Eff Inst. 2011 Apr;(155):5-71. Res Rep Health Eff Inst. 2011. PMID: 21830496
-
Critical review of the human data on short-term nitrogen dioxide (NO2) exposures: evidence for NO2 no-effect levels.Crit Rev Toxicol. 2009;39(9):743-81. doi: 10.3109/10408440903294945. Crit Rev Toxicol. 2009. PMID: 19852560 Review.
References
-
- Gbanie SP, Griffin AL, Thornton A. Impacts on the urban environment: Land cover change trajectories and landscape fragmentation in post-war Western Area Sierra Leone. Remote Sens. 2018;10:129. doi: 10.3390/rs10010129. - DOI
-
- Sheng N, Tang UW, Grydehøj A. Urban morphology and urban fragmentation in Macau, China: island city development in the Pearl River Delta megacity region. Island Stud. J. 2017;12:199–212. doi: 10.24043/isj.25. - DOI
-
- Lee G-G, Lee H-W, Lee J-H. Greenhouse gas emission reduction effect in the transportation sector by urban agriculture in Seoul Korea. Landscape Urban Plan. 2015;140:1–7. doi: 10.1016/j.landurbplan.2015.03.012. - DOI
-
- Clark C, et al. Does traffic-related air pollution explain associations of aircraft and road traffic noise exposure on children's health and cognition? A secondary analysis of the United Kingdom sample from the RANCH project. Am. J. Epidemiol. 2012;176:327–337. doi: 10.1093/aje/kws012. - DOI - PMC - PubMed
Publication types
Grants and funding
LinkOut - more resources
Full Text Sources
Miscellaneous

