. 2021 Jun 7;11(1):11946.
doi: 10.1038/s41598-021-90950-9.

An initial assessment of the involvement of transglutaminase2 in eosinophilic bronchitis using a disease model developed in C57BL/6 mice

Affiliations

An initial assessment of the involvement of transglutaminase2 in eosinophilic bronchitis using a disease model developed in C57BL/6 mice

Lan Chen et al. Sci Rep. .

Abstract

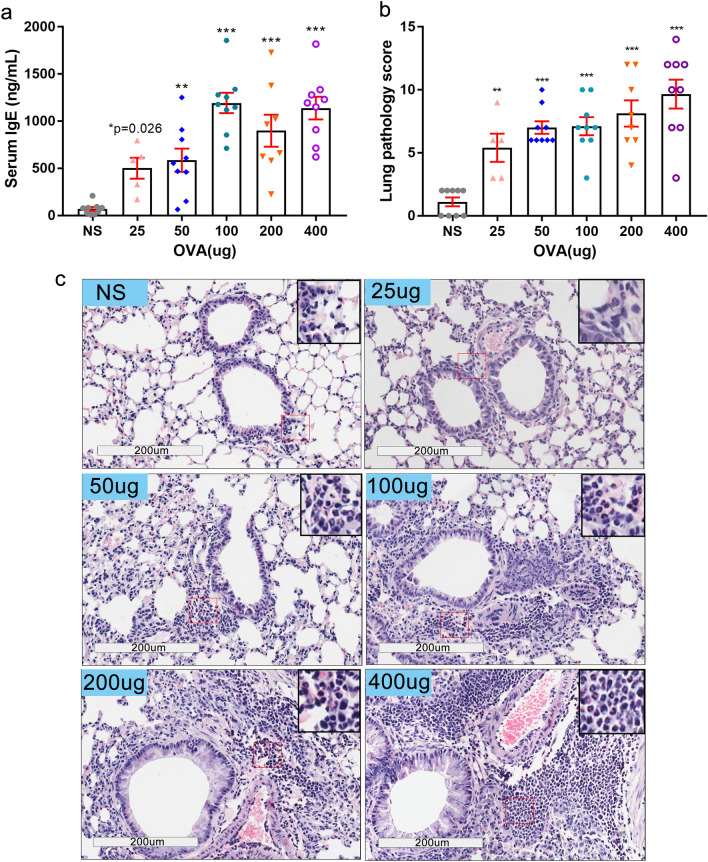
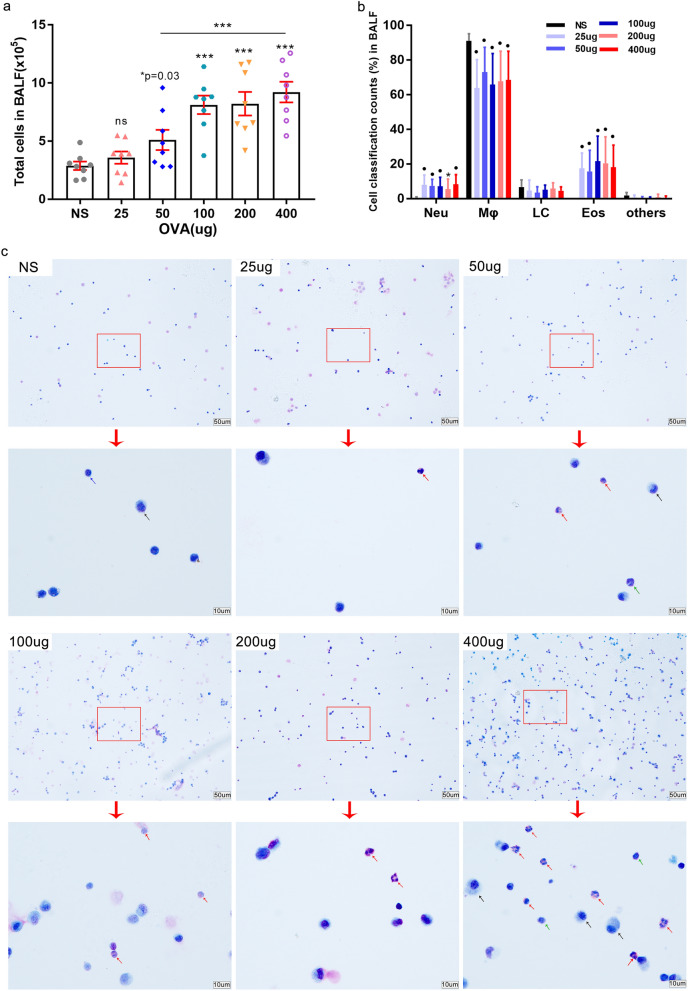
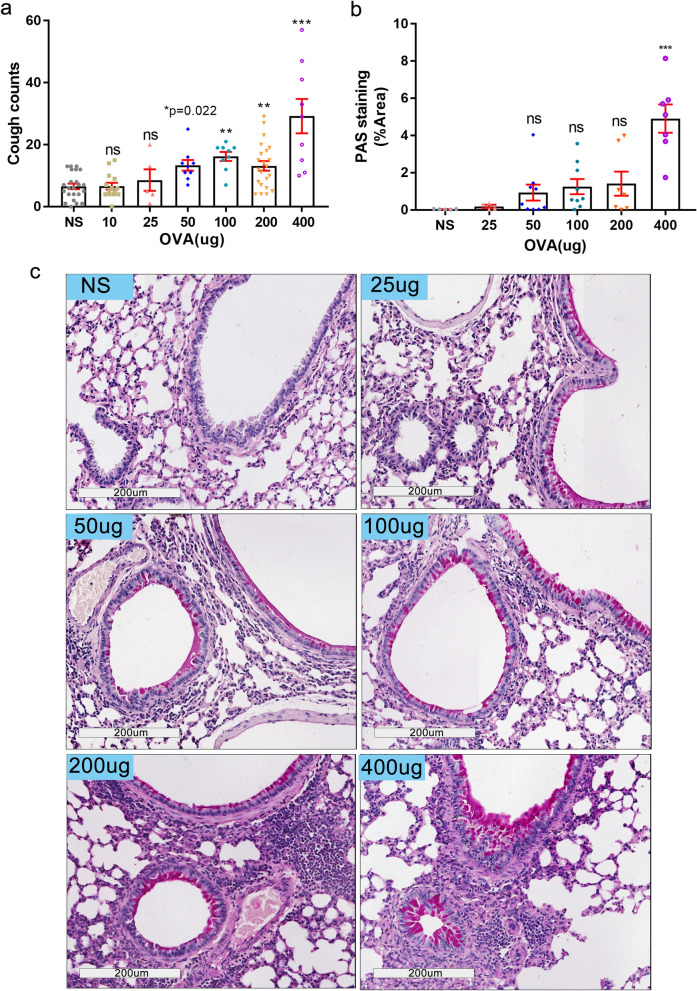
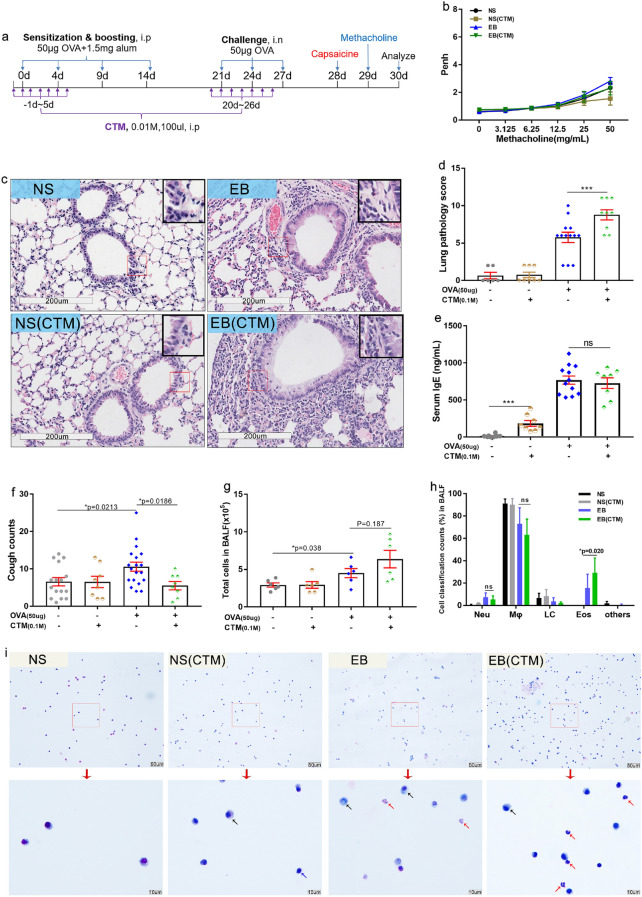
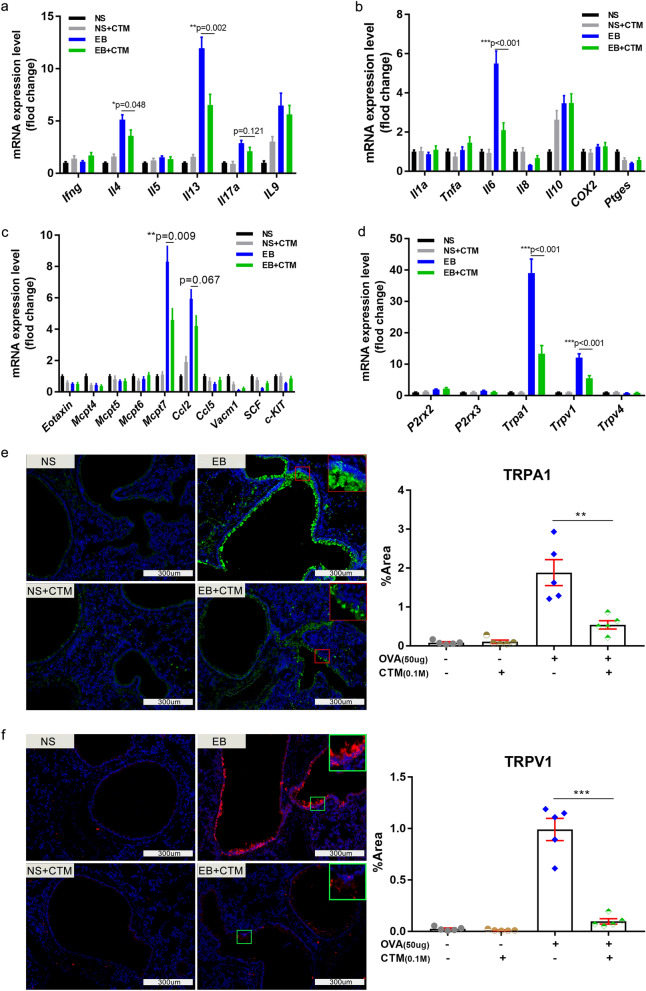
The detailed pathogenesis of eosinophilic bronchitis (EB) remains unclear. Transglutaminase 2 (TG2) has been implicated in many respiratory diseases including asthma. Herein, we aim to assess preliminarily the relationship of TG2 with EB in the context of the development of an appropriate EB model through ovalbumin (OVA) sensitization and challenge in the C57BL/6 mouse strain. Our data lead us to propose a 50 μg dose of OVA challenge as appropriate to establish an EB model in C57BL/6 mice, whereas a challenge with a 400 μg dose of OVA significantly induced asthma. Compared to controls, TG2 is up-regulated in the airway epithelium of EB mice and EB patients. When TG2 activity was inhibited by cystamine treatment, there were no effects on airway responsiveness; in contrast, the lung pathology score and eosinophil counts in bronchoalveolar lavage fluid were significantly increased whereas the cough frequency was significantly decreased. The expression levels of interleukin (IL)-4, IL-13, IL-6, mast cell protease7 and the transient receptor potential (TRP) ankyrin 1 (TRPA1), TRP vanilloid 1 (TRPV1) were significantly decreased. These data open the possibility of an involvement of TG2 in mediating the increased cough frequency in EB through the regulation of TRPA1 and TRPV1 expression. The establishment of an EB model in C57BL/6 mice opens the way for a genetic investigation of the involvement of TG2 and other molecules in this disease using KO mice, which are often generated in the C57BL/6 genetic background.


Conflict of interest statement

The authors declare no competing interests.

Figures

Figure 1
Figure 1
Flow chart of EB model establishment using C57BL/6 mice, lung resistance and collagen deposition measurements. (a) Flow chart of EB model establishment using C57BL/6 mice. C57BL/6 mice were sensitized and then boosted with ovalbumin (OVA) plus aluminium adjuvant (alum) intraperitoneally and then intranasally challenged with OVA three times. 12 h after the last challenge, the capsaicine-induced cough frequency was recorded. 36 h after the last challenge, lung resistance or lung enhanced pause (Penh) was evaluated, and finally BALF and lung tissues were subsequently harvested for further analyses. (b) Penh in all groups changes in response to increased doses of inhaled methacholine (MCh) (3.125, 6.25, 12.5, 25, and 50 mg/mL). (c,d) Different doses of OVA challenge affected collagen deposition in lung tissue of mice, as revealed by Sirius red staining. With NS challenge and different doses of OVA challenge, semi-quantitative image analysis of the collagen deposition area (c) and representative views (d) are shown [25 µg OVA dose, n = 5, other groups, n ≥ 9. *P ≤ 0.05; **P < 0.01; ***P < 0.001; ns, no significance; ##P < 0.01. *compared with NS, # compared with 50 µg]. The scale is indicated on the panel by the length of the box around the size in µm.
Figure 2
Figure 2
IgE concentration in sera and lung pathology score are significantly increased after OVA intranasal challenges. (a) IgE levels in mice sera were all elevated after OVA administration at all doses. (b) Lung pathology score according to calibrated criteria (Table 1) from indicated C57BL/6 mice under hematoxylin and eosin staining. (c) Representative photographs of (b), 200 × , insets show infiltrated eosinophils (red) around terminal bronchioles. (25 µg OVA dose, n = 5, other groups, n ≥ 9. *P ≤ 0.05; **P < 0.01; ***P < 0.001). The scale is indicated on the panel by the length of the box around the size in µm.
Figure 3
Figure 3
Total cells count and cell classification in BALF after OVA administration. (a–c) Bronchoalveolar lavage fluid (BALF) from mice was obtained after airway responsiveness determination. (a) Total cells count in BALF were measured using a Neubauer hemocytometer under 200 × microscope. (b) Giemsa-Wright stained cells in the BALF were ascribed to distinct categories and counted using a 100 × microscope objective (oil immersion lens) by Wright-Giemsa staining. (c) Representative photographs of BALF cells after Wright–Giemsa staining (up, 200 × and down, 1000 × magnifications). Arrows’ colors represent different cells types (green-neutrophils; black-monocytes and macrophages; blue-lymphocytes, red-eosinophils). (25 µg OVA, n = 5; other groups, n ≥ 9. *P ≤ 0.05; **P < 0.01; ***P < 0.001; ns, no significance). The scale is indicated on the panel by the length of the box around the size in µm.
Figure 4
Figure 4
Cough frequency and goblet cell hyperplasia in lung tissue after OVA challenge. (a) 12 h after the last OVA challenge, atomized capsaicin (0.1 mmol/L) was used for cough stimulation, and the frequency of cough in mice of all groups was automatically detected using the Finepointe software and recorded. (b,c) The extent of goblet cell hyperplasia, a significant inflammatory factor leading to wet cough, was estimated by periodic acid-Schiff (PAS) staining. Semi-quantitation of PAS staining was shown as the positive staining area percentage after Image J software analysis (b) and representative views were shown in (c) (magnification 200 ×). (25 µg OVA dose, n = 5, other groups, n ≥ 9. *P ≤ 0.05; **P < 0.01; ***P < 0.001; ns, no significance). The scale is indicated on the panel by the length of the box around the size in µm.
Figure 5
Figure 5
TG2 is up-regulated in the lung of EB mice and in the bronchial epithelial cells of EB patients. (a–c) The steady-state mRNA expression levels of TG2 in mice lung were determined by RT-qPCR (a) (figure representative of three dependent experiments) and the semi quantitative level of TG2 protein by immunohistochemistry was quantified (b) (n ≥ 8), and typical micrographs are presented (up, 40 × ; middle, 100 × ; and down, 400 × magnification.Arrows showed the location of TG2 positive signal) (c). (d) TG2 protein expression levels and location were also determined through immunohistochemistry on bronchial brush slices from non-EB control and EB patients (200 × magnification). (*P ≤ 0.05; **P < 0.01). The scale is indicated on the panel by the length of the box around the size in µm.
Figure 6
Figure 6
Inhibition of TG2 activity by cystamine treatment lowers the extent of inflammation in the lung and decreases the cough frequency in EB mice. TG2 activity in C57BL/6 mice was inhibited by intraperitoneal injection of CTM (0.01 M, 100 μL each mice) once daily for seven days from one day before the first intraperitoneal OVA sensitization and the first OVA intranasal challenge respectively. (b) Penh was evaluated in mice with or without CTM treatment. (c,d) Lung pathology score of C57BL/6 mice lung sections with or without CTM treatment was evaluated under hematoxylin and eosin staining. Representative photographs (200 × magnification) are shown; insets in (c) show eosinophil (red) infiltration around terminal bronchioles. Lung pathology score is displayed in (d). IgE concentration in indicated mice sera is represented in (e). (f) The frequency of cough in NS or EB model usingC57BL/6 mice with or without CTM treatment was automatically detected using the Finepointe software and recorded. Total cells in the BALF (g), differential cells percentage (h) and representative photographs of BALF cells’ staining (i) were exhibited. (up, 200 × ; down, 1000 × magnification). Arrows’ colors represented different type of cells (black-monocytes and macrophages; blue-lymphocytes, red-eosinophils). (n ≥ 6. *P ≤ 0.05; ***P < 0.001; ns, no significance). The scale is indicated on the panel by the length of the box around the size in µm.
Figure 7
Figure 7
Inhibition of TG2 activity by cystamine treatment significantly lowers the induction of IL-4, IL-13, IL-6, Mcpt7 steady-state mRNA transcripts during EB as well as the induction level of TRPA1 and TRPV1 proteins. (a–d) Steady-state mRNA levels in the lung of indicated mice with or without CTM treatment were measured by RT-qPCR. (a) Steady-state mRNA levels of IFN-γ, IL-4, IL-5, IL-17A, and IL-9 which are related to Th cell sub-populations. (b) Steady-state mRNA levels of IL-1α, TNF-α, IL-6, IL-8, IL-10, COX-2 and mPGES-1. (c) Steady-state mRNA levels of eotaxin and some mast cell proteases including MCPT4, MCPT5, MCPT6, MCPT7, mast cell chemokines such as CCL2, CCL5, mast cell adhesion molecular VCAM-1, and mast cell growth factor SCF and its c-KIT receptor. (d) Steady-state mRNA levels of some cough receptors including P2X2, P2X3, TRPA1, TRPV1 and TRPV4. (e–f) Protein expression level of TRPA1 and TRPV1 with or without CTM treatment were visualized using Immunofluorescence (IF). (e) Representative view of TRPA1 (boxes indicate the location of TRPA1 positive staining displayed in the inset) and its semi-quantitation (n = 5). (f) Representative view of TRPV1 (boxes indicate the location of TRPV1 positive staining displayed in the inset) and its semi-quantitation using modified H-score (n = 5). The scale is indicated on the panel by the length of the box around the size in µm.

References

    1. Gibson PG, Dolovich J, Denburg J, Ramsdale EH, Hargreave FE. Chronic cough: Eosinophilic bronchitis without asthma. Lancet (London, England) 1989;1:1346–1348. doi: 10.1016/s0140-6736(89)92801-8. - DOI - PubMed
    1. Lai K, Chen R, Peng W, Zhan W. Non-asthmatic eosinophilic bronchitis and its relationship with asthma. Pulm. Pharmacol. Ther. 2017;47:66–71. doi: 10.1016/j.pupt.2017.07.002. - DOI - PubMed
    1. Song WJ, et al. The global epidemiology of chronic cough in adults: A systematic review and meta-analysis. Eur. Respir. J. 2015;45:1479–1481. doi: 10.1183/09031936.00218714. - DOI - PubMed
    1. Morice AH, et al. ERS guidelines on the diagnosis and treatment of chronic cough in adults and children. Eur. Respir. J. 2020;55:1901136. doi: 10.1183/13993003.01136-2019. - DOI - PMC - PubMed
    1. Brightling CE, et al. Mast-cell infiltration of airway smooth muscle in asthma. N. Engl. J. Med. 2002;346:1699–1705. doi: 10.1056/NEJMoa012705. - DOI - PubMed

MeSH terms