Reversed and increased functional connectivity in non-REM sleep suggests an altered rather than reduced state of consciousness relative to wake
- PMID: 34099771
- PMCID: PMC8184935
- DOI: 10.1038/s41598-021-91211-5
Reversed and increased functional connectivity in non-REM sleep suggests an altered rather than reduced state of consciousness relative to wake
Abstract
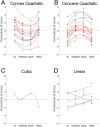
Sleep resting state network (RSN) functional connectivity (FC) is poorly understood, particularly for rapid eye movement (REM), and in non-sleep deprived subjects. REM and non-REM (NREM) sleep involve competing drives; towards hypersynchronous cortical oscillations in NREM; and towards wake-like desynchronized oscillations in REM. This study employed simultaneous electroencephalography-functional magnetic resonance imaging (EEG-fMRI) to explore whether sleep RSN FC reflects these opposing drives. As hypothesized, this was confirmed for the majority of functional connections modulated by sleep. Further, changes were directional: e.g., positive wake correlations trended towards negative correlations in NREM and back towards positive correlations in REM. Moreover, the majority did not merely reduce magnitude, but actually either reversed and strengthened in the opposite direction, or increased in magnitude during NREM. This finding supports the notion that NREM is best expressed as having altered, rather than reduced FC. Further, as many of these functional connections comprised "higher-order" RSNs (which have been previously linked to cognition and consciousness), such as the default mode network, this finding is suggestive of possibly concomitant alterations to cognition and consciousness.
Conflict of interest statement
The authors declare no competing interests.
Figures


Similar articles
-
Toward a complete taxonomy of resting state networks across wakefulness and sleep: an assessment of spatially distinct resting state networks using independent component analysis.Sleep. 2019 Mar 1;42(3):zsy235. doi: 10.1093/sleep/zsy235. Sleep. 2019. PMID: 30476346
-
Higher-order sensorimotor circuit of the brain's global network supports human consciousness.Neuroimage. 2021 May 1;231:117850. doi: 10.1016/j.neuroimage.2021.117850. Epub 2021 Feb 12. Neuroimage. 2021. PMID: 33582277 Free PMC article.
-
Hierarchical clustering of brain activity during human nonrapid eye movement sleep.Proc Natl Acad Sci U S A. 2012 Apr 10;109(15):5856-61. doi: 10.1073/pnas.1111133109. Epub 2012 Mar 26. Proc Natl Acad Sci U S A. 2012. PMID: 22451917 Free PMC article.
-
Non-REM sleep and the neural correlates of consciousness: more than meets the eyes.Arch Ital Biol. 2018 Sep 1;156(3):137-148. doi: 10.12871/00039829201835. Arch Ital Biol. 2018. PMID: 30324609 Review.
-
The cognitive neuroscience of sleep: neuronal systems, consciousness and learning.Nat Rev Neurosci. 2002 Sep;3(9):679-93. doi: 10.1038/nrn915. Nat Rev Neurosci. 2002. PMID: 12209117 Review.
Cited by
-
Event-Related Potential Study of Recovery of Consciousness during Forced Awakening from Slow-Wave Sleep and Rapid Eye Movement Sleep.Int J Mol Sci. 2022 Oct 4;23(19):11785. doi: 10.3390/ijms231911785. Int J Mol Sci. 2022. PMID: 36233081 Free PMC article.
-
Altered brain dynamics index levels of arousal in complete locked-in syndrome.Commun Biol. 2023 Jul 20;6(1):757. doi: 10.1038/s42003-023-05109-1. Commun Biol. 2023. PMID: 37474587 Free PMC article.
-
Infant sleep state coded from respiration and its relationship to the developing functional connectome: A feasibility study.Dev Cogn Neurosci. 2025 Apr;72:101525. doi: 10.1016/j.dcn.2025.101525. Epub 2025 Feb 9. Dev Cogn Neurosci. 2025. PMID: 39965287 Free PMC article.
-
Functional networks in prolonged disorders of consciousness.Front Neurosci. 2023 Feb 17;17:1113695. doi: 10.3389/fnins.2023.1113695. eCollection 2023. Front Neurosci. 2023. PMID: 36875660 Free PMC article. Review.
-
Effects of Chronic Administration of Green Tea Ethanol Extract on Sleep Architecture in Mice: A Comparative Study with a Representative Stimulant Caffeine.Nutrients. 2023 Feb 20;15(4):1042. doi: 10.3390/nu15041042. Nutrients. 2023. PMID: 36839400 Free PMC article.
References
Publication types
MeSH terms
LinkOut - more resources
Full Text Sources
Medical
Research Materials

