Identifying molecular pathways and candidate genes associated with knob traits by transcriptome analysis in the goose (Anser cygnoides)
- PMID: 34099774
- PMCID: PMC8184827
- DOI: 10.1038/s41598-021-91269-1
Identifying molecular pathways and candidate genes associated with knob traits by transcriptome analysis in the goose (Anser cygnoides)
Abstract
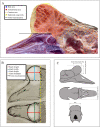
Anser cygnoides has a spherical crest on the beak roof, which is described as knob. However, the mechanisms affecting knob morphology are unclear. Here, we investigated the phenotypic characteristics and molecular basis of knob-size differences in Yangzhou geese. Anatomically, the knob was identified as frontal hump in the frontal area of the skull, rather than hump of upper beak. Although the frontal hump length, and height varied greatly in geese with different knob phenotypes, little was changed in the width. Histologically, knob skin in large-size knobs geese have a greater length in the stratum corneum, stratum spinosum, and stratum reticular than that in small-size knobs geese. Moveover, the 415 differentially expressed genes were found between the large knobs and small ones through transcriptome profiling. In addition, GO enrichment and KEGG pathway analysis revealed 455 significant GO terms and 210 KEGG pathways were enriched, respectively. Among these, TGF-β signaling and thyroid hormone synthesis-signaling pathways were identified to determine knob-size phenotype. Furthermore, BMP5, DCN, TSHR and ADCY3 were recognized to involve in the growth and development of knob. Our data provide comprehensive molecular determinants of knob size phenotype, which can potentially promote the genetic improvement of goose knobs.
Conflict of interest statement
The authors declare no competing interests.
Figures


Similar articles
-
Transcriptome Profiling Unveils Key Genes Regulating the Growth and Development of Yangzhou Goose Knob.Int J Mol Sci. 2024 Apr 10;25(8):4166. doi: 10.3390/ijms25084166. Int J Mol Sci. 2024. PMID: 38673752 Free PMC article.
-
Relationship of knob morphometric analysis with production performance and meat quality in Yangzhou goose (Anser cygnoides).Front Physiol. 2023 Nov 8;14:1291202. doi: 10.3389/fphys.2023.1291202. eCollection 2023. Front Physiol. 2023. PMID: 38028791 Free PMC article.
-
Integrative analysis of histomorphology, transcriptome and whole genome resequencing identified DIO2 gene as a crucial gene for the protuberant knob located on forehead in geese.BMC Genomics. 2021 Jun 30;22(1):487. doi: 10.1186/s12864-021-07822-9. BMC Genomics. 2021. PMID: 34193033 Free PMC article.
-
De Novo Assembly and Comparative Transcriptome Profiling of Anser anser and Anser cygnoides Geese Species' Embryonic Skin Feather Follicles.Genes (Basel). 2019 May 8;10(5):351. doi: 10.3390/genes10050351. Genes (Basel). 2019. PMID: 31072014 Free PMC article.
-
Comprehensive analysis of Sichuan white geese (Anser cygnoides) transcriptome.Anim Sci J. 2014 Jun;85(6):650-9. doi: 10.1111/asj.12197. Epub 2014 Apr 13. Anim Sci J. 2014. PMID: 24725216
Cited by
-
Global epidemiology of severe fever with thrombocytopenia syndrome virus in human and animals: a systematic review and meta-analysis.Lancet Reg Health West Pac. 2024 Jul 2;48:101133. doi: 10.1016/j.lanwpc.2024.101133. eCollection 2024 Jul. Lancet Reg Health West Pac. 2024. PMID: 39040038 Free PMC article.
-
Transcriptome Profiling Unveils Key Genes Regulating the Growth and Development of Yangzhou Goose Knob.Int J Mol Sci. 2024 Apr 10;25(8):4166. doi: 10.3390/ijms25084166. Int J Mol Sci. 2024. PMID: 38673752 Free PMC article.
-
Morphological, anatomical and histological studies on knob and beak characters of six goose breeds from China.Front Physiol. 2023 Aug 28;14:1241216. doi: 10.3389/fphys.2023.1241216. eCollection 2023. Front Physiol. 2023. PMID: 37700764 Free PMC article.
-
Identification of polymorphic loci in the deiodinase 2 gene and their associations with head dimensions in geese.Anim Biosci. 2022 Jun;35(5):639-647. doi: 10.5713/ab.21.0382. Epub 2021 Oct 29. Anim Biosci. 2022. PMID: 34727635 Free PMC article.
-
Relationship of knob morphometric analysis with production performance and meat quality in Yangzhou goose (Anser cygnoides).Front Physiol. 2023 Nov 8;14:1291202. doi: 10.3389/fphys.2023.1291202. eCollection 2023. Front Physiol. 2023. PMID: 38028791 Free PMC article.
References
-
- Mayr G. A survey of casques, frontal humps, and other extravagant bony cranial protuberances in birds. Zoomorphology. 2018;137:457–472. doi: 10.1007/s00435-018-0410-2. - DOI
-
- Mead D. 4 Domesticated Geese and Ducks—and Allied Species. Sulawesi Language Alliance; 2013.
-
- Crawford RD. Poultry Breeding and Genetics. Elsevier; 1990.
-
- Horrocks N, Perrins C, Charmantier J. Seasonal changes in male and female bill knob size in the mute swan Cygnus olor. Avian. Biol. 2010;40:511–519. doi: 10.1111/j.1600-048X.2008.04515.x. - DOI
Publication types
MeSH terms
Substances
LinkOut - more resources
Full Text Sources
Miscellaneous

