. 2021 Jun 7;11(1):11906.
doi: 10.1038/s41598-021-91479-7.

The efficacy of public health information for encouraging radon gas awareness and testing varies by audience age, sex and profession

Affiliations

The efficacy of public health information for encouraging radon gas awareness and testing varies by audience age, sex and profession

Natasha L Cholowsky et al. Sci Rep. .

Abstract

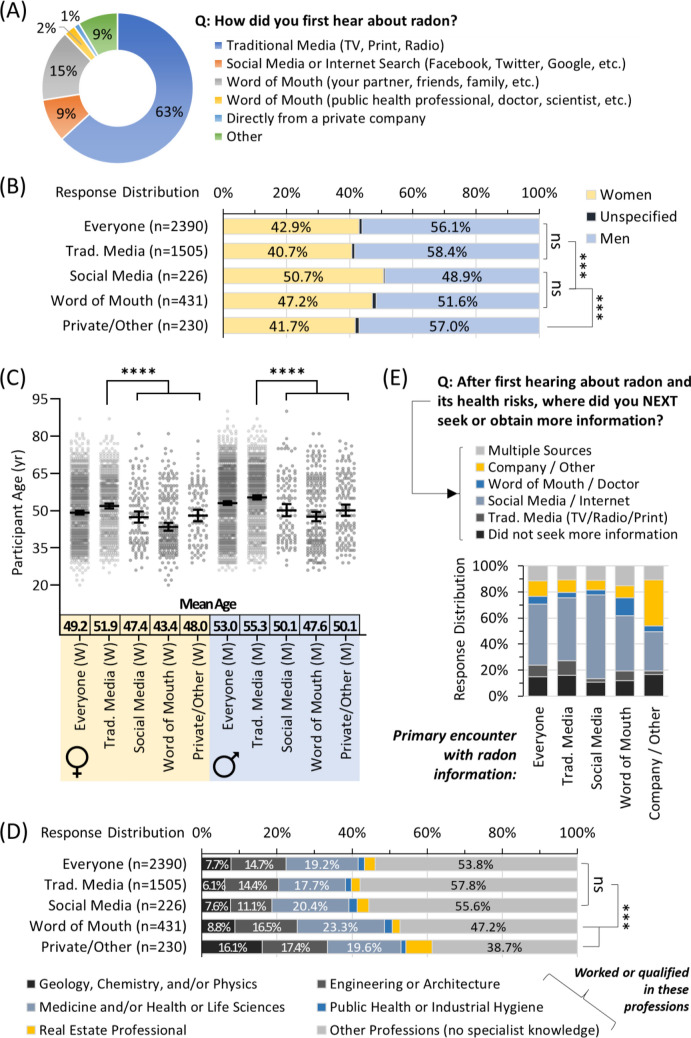
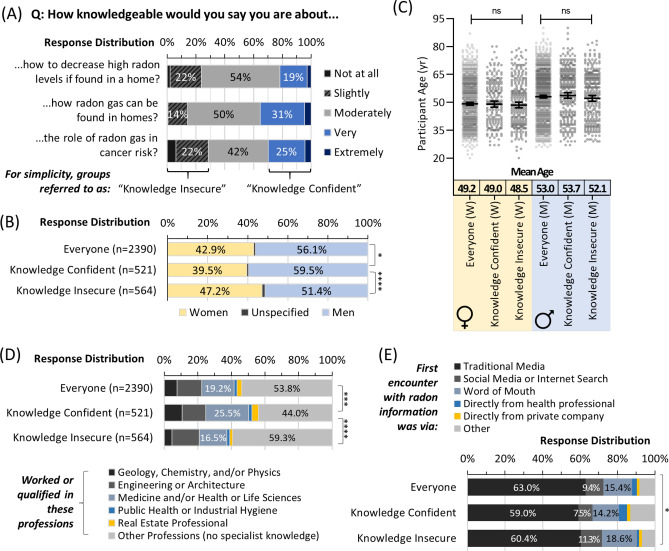
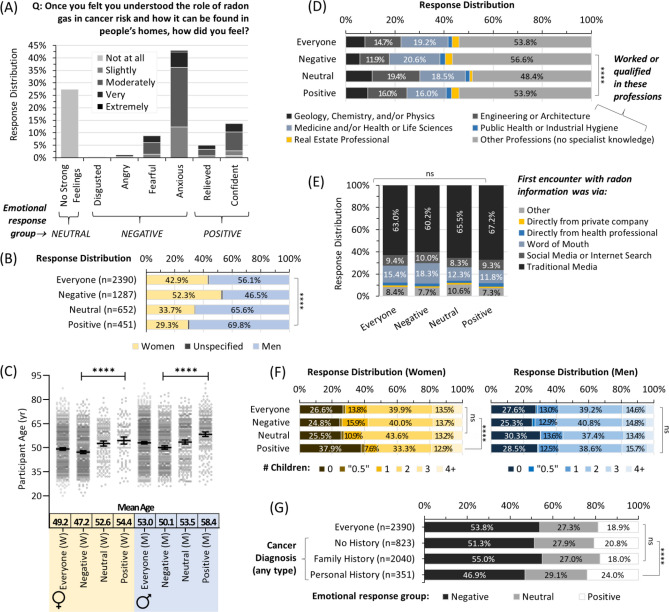
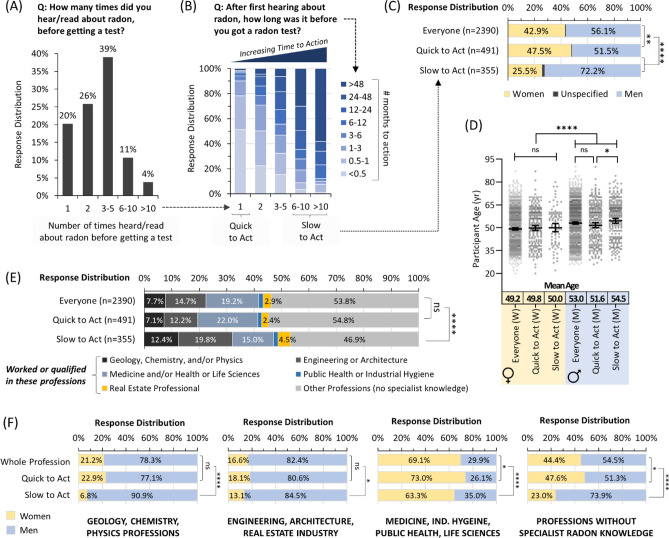
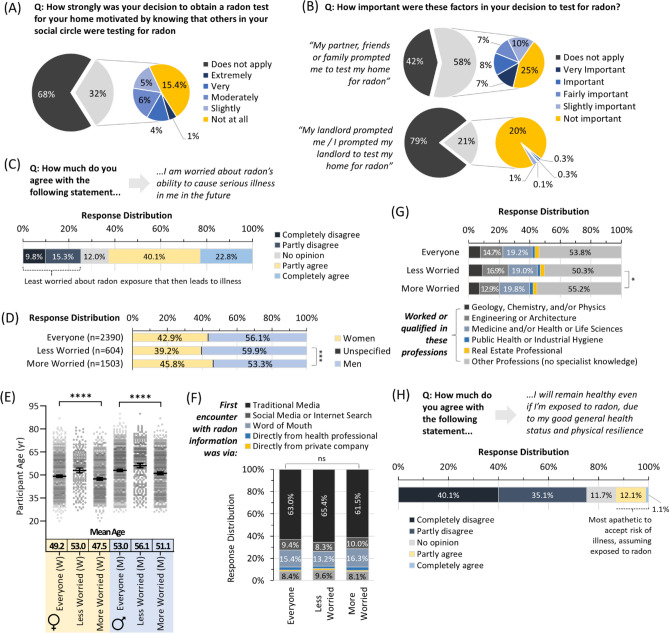
Radioactive radon inhalation is a leading cause of lung cancer and underlies an ongoing public health crisis. Radon exposure prevention strategies typically begin by informing populations about health effects, and their initial efficacy is measured by how well and how fast information convinces individuals to test properties. This communication process is rarely individualized, and there is little understanding if messages impact diverse demographics equally. Here, we explored how 2,390 people interested in radon testing differed in their reaction to radon's public health information and their subsequent decision to test. Only 20% were prompted to radon test after 1 encounter with awareness information, while 65% required 2-5 encounters over several months, and 15% needed 6 to > 10 encounters over many years. People who most delayed testing were more likely to be men or involved in engineering, architecture, real estate and/or physical science-related professions. Social pressures were not a major factor influencing radon testing. People who were the least worried about radon health risks were older and/or men, while negative emotional responses to awareness information were reported more by younger people, women and/or parents. This highlights the importance of developing targeted demographic messaging to create effective radon exposure prevention strategies.


Conflict of interest statement

The authors declare no competing interests.

Figures

Figure 1
Figure 1
Age, sex, and profession influence how people first encounter radon awareness information. Panel (A) Overall distribution of responses for the first encounter with radon awareness information. Panel (B) First encounter with radon awareness information as a function of sex. Panel (C) First encounter with radon awareness information as a function of sex and age. Mean Age refers to a geometric mean ± CI95%. Panel (D) First encounter with radon awareness information as a function of status (worked or qualified) in professions with or without the potential for a specialist on radon. Panel (E) Response distribution of how groups based on their first encounter with radon awareness information went on to next seek or obtain more information. Statistical comparisons are Mann–Whitney pairwise nonparametric t-tests of comparisons for scatter plot data or 1-way ANOVA for all other data. **** = p < 0.0001; *** = p < 0.001; ns = p > 0.05. Figures were prepared using Excel and GraphPad Prism 9.1.1 (225) (www.graphpad.com).
Figure 2
Figure 2
Radon knowledge perceptions differ by profession and sex but not age. Panel (A) Overall distribution of responses to indicated questions on self-perceptions of radon knowledge. Panel (B) Self-perceptions of radon knowledge as a function of sex. Panel (C) Self-perceptions of radon knowledge as a function of sex and age. Mean Age refers to a geometric mean ± CI95%. Panel (D) Self-perceptions of radon knowledge as a function of status (worked or qualified) in professions with or without the potential for a specialist on radon. Panel (E) Self-perceptions of radon knowledge as a function of the first encounter with radon awareness information. Statistical comparisons are Mann–Whitney pairwise nonparametric t-tests of comparisons for scatter plot data or 1-way ANOVA for all other data. **** = p < 0.0001; *** = p < 0.001; * = p < 0.05; ns = p > 0.05. Figures were prepared using Excel and GraphPad Prism 9.1.1 (225) (www.graphpad.com).
Figure 3
Figure 3
Emotional reactions to radon awareness vary by personal demographics, but not the first encounter. Panel (A) Overall distribution and Likert scale intensity of emotional responses to gaining awareness of radon health effects and how it can be found in homes. Panel (B) Emotional response distributions from (A) as a function of sex. Panel (C) Emotional response distributions from (A) as a function of sex and age. Mean Age refers to a geometric mean ± CI95%. Panel (D) Emotional response distributions from (A) as a function of status (worked or qualified) in professions with or without the potential for a specialist on radon. Panel (E) Emotional response distributions from (A) as a function of their first encounter with radon awareness information. Panel (F) Emotional response distributions from (A) for parental status of women (left, yellow) and men (right, blue). Panel (G) Emotional response distributions from (A) as a function of experience with a cancer (of any type) diagnosis. Statistical comparisons are Mann–Whitney pairwise nonparametric t-tests of comparisons for scatter plot data or 1-way ANOVA for all other data. **** = p < 0.0001; ns = p > 0.05. Figures were prepared using Excel and GraphPad Prism 9.1.1 (225) (www.graphpad.com).
Figure 4
Figure 4
Time to action following radon awareness diverges strongly by sex and profession. Panel (A) Overall distribution of responses for the number of times people report encountering radon awareness information before obtaining a radon test. Panel (B) The amount of time that people report between first encountering radon awareness information and obtaining a radon test is expressed as a function of data in (A). Panel (C) Time to action (from A,B) as a function of sex. Panel (D) Time to action (from A,B) as a function of sex and age. Mean Age refers to a geometric mean ± CI95%. Panel (E) Time to action (from A,B) as a function of status (worked or qualified) in professions with or without the potential for specialist knowledge on radon. Panel (F) Time to action (from A,B) was expressed as in (C) but split into the professional alignment groups from (E). Statistical comparisons are Mann–Whitney pairwise nonparametric t-tests of comparisons for scatter plot data or 1-way ANOVA for all other data. **** = p < 0.0001; ** = p < 0.01; * = p < 0.05; ns = p > 0.05. Figures were prepared using Excel and GraphPad Prism 9.1.1 (225) (www.graphpad.com).
Figure 5
Figure 5
Social pressures do not motivate radon testing, and risk perceptions vary primarily by age. Panel (A) Overall distribution of responses assessing role of general social circle pressure in the decision to radon test. Panel (B) Response distributions assess immediate family, friend and landlord-related social pressure in decision to radon test. Panel (C) Overall distribution of Likert scale responses about concern of future radon exposure leading to illness. Panel (D) Relative concern about radon exposure leading to illness (as in C) as a function of sex. Panel (E) Relative concern about radon exposure leading to illness (as in C) as a function of sex and age. Mean Age refers to a geometric mean ± CI95%. Panel (F) Relative concern about radon exposure leading to illness (as in C) as a function of their first encounter with radon awareness information. Panel (G) Relative concern about radon exposure leading to illness (as in C) as a function of status (worked or qualified) in professions with or without the potential for a specialist on radon. Panel (H) Overall distribution of Likert scale responses to self-perceptions of future risk of illness assuming exposure to radon. Statistical comparisons are Mann–Whitney pairwise nonparametric t-tests of comparisons for scatter plot data, or 1-way ANOVA for all other data. ****p < 0.0001; ***p < 0.001; * = p < 0.05; ns = p > 0.05. Figures were prepared using Excel and GraphPad Prism 9.1.1 (225) (www.graphpad.com).

References

    1. Public Health Agency of C, Statistics C, Canadian Cancer S & provincial/territorial cancer r Release notice—Canadian Cancer Statistics 2019. Health Promot Chronic Dis Prev Can39, 255–255 (2019). - PubMed
    1. Kang HR, Cho JY, Lee SH, Lee YJ, Park JS, Cho YJ, Lee CT. Role of low-dose computerized tomography in lung cancer screening among never-smokers. J. Thorac. Oncol. 2019;14:436–444. doi: 10.1016/j.jtho.2018.11.002. - DOI - PubMed
    1. Kiriluk KJ, Prasad SM, Patel AR, Steinberg GD, Smith ND. Bladder cancer risk from occupational and environmental exposures. Urol. Oncol. 2012;30:199–211. doi: 10.1016/j.urolonc.2011.10.010. - DOI - PubMed
    1. Corrales L, Rosell R, Cardona AF, Martin C, Zatarain-Barron ZL, Arrieta O. Lung cancer in never smokers: The role of different risk factors other than tobacco smoking. Crit Rev Oncol Hematol. 2020;148:102895. doi: 10.1016/j.critrevonc.2020.102895. - DOI - PubMed
    1. Subramanian J, Govindan R. Lung cancer in never smokers: A review. J. Clin. Oncol. 2007;25:561–570. doi: 10.1200/JCO.2006.06.8015. - DOI - PubMed

Publication types

MeSH terms