Comparative Study
. 2021 Jul;22(7):880-892.
doi: 10.1038/s41590-021-00948-8. Epub 2021 Jun 7.

Skin and gut imprinted helper T cell subsets exhibit distinct functional phenotypes in central nervous system autoimmunity

Affiliations
Comparative Study

Skin and gut imprinted helper T cell subsets exhibit distinct functional phenotypes in central nervous system autoimmunity

Michael Hiltensperger et al. Nat Immunol. 2021 Jul.

Abstract

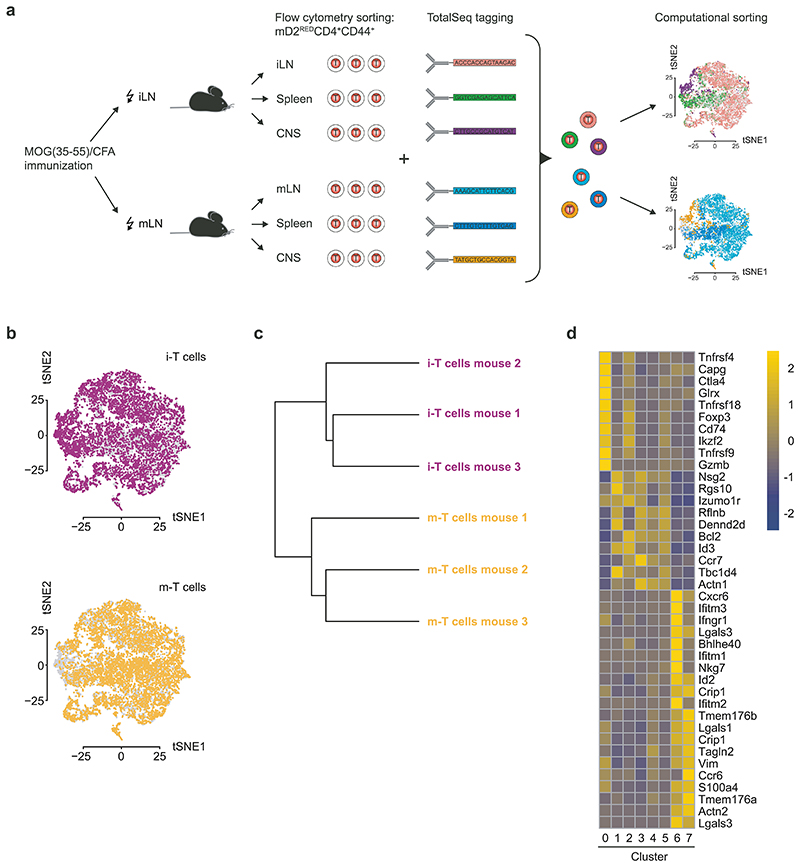
Multidimensional single-cell analyses of T cells have fueled the debate about whether there is extensive plasticity or 'mixed' priming of helper T cell subsets in vivo. Here, we developed an experimental framework to probe the idea that the site of priming in the systemic immune compartment is a determinant of helper T cell-induced immunopathology in remote organs. By site-specific in vivo labeling of antigen-specific T cells in inguinal (i) or gut draining mesenteric (m) lymph nodes, we show that i-T cells and m-T cells isolated from the inflamed central nervous system (CNS) in a model of multiple sclerosis (MS) are distinct. i-T cells were Cxcr6+, and m-T cells expressed P2rx7. Notably, m-T cells infiltrated white matter, while i-T cells were also recruited to gray matter. Therefore, we propose that the definition of helper T cell subsets by their site of priming may guide an advanced understanding of helper T cell biology in health and disease.


Conflict of interest statement

Competing interests

The authors declare no competing interests.

Figures

Extended Data Fig. 1
Extended Data Fig. 1. Site-specific labeling of T cells by photoconversion in inguinal and mesenteric lymph nodes in vivo.
a, Schematic of photoconversion of T cells in the iLN and mLN of PhAM T mice. b, Flow cytometric gating strategy for mD2GREEN or mD2RED CD4+ T cells. The DUMP channel comprised LIVE/DEAD™-Near-IR and CD8α-APC-Cy7. c, Flow cytometric assessment in the indicated LN of iLN-labeled (top) and mLN-labeled (bottom) PhAM T mice immediately after photoconversion (photo) or without photoconversion (dark). Representative plots of n = 3 mice per group. d, e, Flow cytometric proliferation readout of in vitro-activated PhAM T CD4+ T cells 4 days after photoconversion (d) and mD2RED signal over time (e). Representative plots from two independent experiments. f, Experimental design of iLN (top) or mLN (bottom) irradiation in MOG(35-55)/CFA immunized Pham T mice. g, Flow cytometric assessment of mD2REDCD44high frequencies (top) and absolute numbers (bottom) in different tissues in iLN-labeled PhAM T EAE mice 2 days after photoconversion at indicated time points. Representative plots from two mice per time point. h, i, Flow cytometric assessment in the spleen of iLN-labeled (left) and mLN-labeled (right) PhAM T EAE mice 2 days after photoconversion at disease onset (h) and of the CNS in non-photoconverted (dark) PhAM T EAE mice (i). Representative plots from spleen n = 15 mice per group, CNS n = 7 mice. j, Frequencies of regulatory and activated conventional mD2GREENCD4+ T cells in PhAM T EAE mice for different tissues. n = 2 mice per group, representative plot from three independent experiments for Foxp3 and CD44 and two for CD69. k, Frequency and duration of Ca2+ signaling in iLN (top) or mLN (bottom) of mice immunized on days 3 or 4 post transfer, i.e. days 13 or 14 post immunization. Left panels: individual Ca2+ signaling durations of TCRMOG Twitch-2B T cells. The dotted line indicates the cut-off (2 minutes) to distinguish between short- and long-term Ca2+ signaling. Cumulative results from iLN(PBS) and mLN(PBS) n = 2, iLN(MOG) and mLN(MOG) n = 3 mice. Right panels: fractions of T cells presenting short- and long-term Ca2+ signaling or no Ca2+ spikes. Data shown as mean. l, Representative images of TCRMOG Twitch-2B T cells from intravital time-lapse two-photon microscopy for Ca2+ imaging depicted by a fluorescence overlay of T cells (left) and a pseudocolor Ca2+ ratio image (right) from iLN(PBS) and mLN(PBS) n = 2, iLN(MOG) and mLN(MOG) n = 3 mice (see Supplementary Videos 1–4). Scale bars 25 μm.
Extended Data Fig. 2
Extended Data Fig. 2. TCR repertoire analysis of i-T cells and m-T cells.
a, Schematic of single cell sequencing of sorted iLN- or mLN-derived photoconverted T cells from MOG(35-55)/CFA immunized PhAM T mice in combination with TotalSeq hashtag barcoding antibodies. b, Unsupervised clustering t-distributed stochastic neighbour embedding (t-SNE) plot of all single mD2RED CD4+CD44high T cells analyzed. In the upper plot only single T cells from i-stream are colored (purple). In the lower plot only single T cells from m-stream are colored (orange). n = 5 PhAM T EAE mice per group, n = 14621 cells, i-T cells n = 7228 cells, m-T cells n = 7393 cells. c, Repertoire overlap analysis using hierarchical clustering. Dendrogram shows weighted clonal overlaps for TRB-CDR3 sequences among mice, analyzed using F pairwise similarity metric in VDJtools. Branch length shows the distance between repertoires. n = 3 PhAM T EAE mice per group. d, Average gene expression of all single mD2RED CD4+CD44high T cells analyzed for the TOP10 differentially expressed genes of cluster 0 to 7.
Extended Data Fig. 3
Extended Data Fig. 3. Single cell transcriptome analysis in i-T cells and m-T cells.
a, Average gene expression of all single mD2RED CD4+CD44high T cells analyzed from i- and m-stream in spleen and CNS grouped into T cell subsets based on key signature genes (see Fig. 3). b, Flow cytometric assessment in iLN-labeled (left) and mLN-labeled (right) PhAM IL17 EAE mice 2 days after photoconversion at disease onset. LN (top row), spleen (middle row), and CNS (bottom row). Representative plots of n = 3 mice per group. c, Unsupervised clustering t-SNE plot, colored according to i- and m-stream cell group and key gene marker (Tbx21, Rorc, Ccr6, Csf2, Ifng, Il17a, Il10) expression. n = 2 PhAM T EAE mice per group, n = 4169 cells.
Extended Data Fig. 4
Extended Data Fig. 4. Core signatures and transcription factor regulons of i-T cells and m-T cells.
a, b, Gene expression (violin plots) of i-stream signature genes Cxcr6 and Itgb1 and m-stream signature genes P2rx7 and Itga4 in the spleen (a) and CNS (b). c-e, Transcriptional module analysis of scRNAseq data from Fig. 4 based on SCENIC algorithm in i- and m-T cells. All genes controlled by a given transcription factor build a regulon. The regulon specificity score (RSS) was calculated using Jensen-Shannon divergence. c, Genome-wide regulons with RSS > 0.2 in at least one condition are displayed for i-T cells and m-T cells (i-stream and m-stream across all organs). d, e, Regulons that control Cxcr6 (d) and Itga4 (e) with no RSS threshold requirement.
Extended Data Fig. 5
Extended Data Fig. 5. ATACseq of i-T cells and m-T cells isolated from the spleen.
a, Genome browser view of key gene markers (Tbx21, Rorc, Ifng, Csf2, Il21, and Ccr6). Displayed tracks correspond to ATACseq for i-T cells (purple) and m-T cells (orange). In all regions, differential peaks (if existing) are highlighted with arrows. b, c, Ranked list of the top transcription factor motifs predicted by HOMER based on cumulative hypergeometric distribution testing for differential ATAC peaks associated to signature genes for splenic i-T cells (b) and m-T cells (c). For i-T cells 48 transcription factor sequences out of 154 are shown and for m-T cells, 16 sequences out of 30 are shown.
Extended Data Fig. 6
Extended Data Fig. 6. Robust i-T cell and m-T cell signatures in various immunization protocols.
a, Flow cytometric assessment of mD2REDCD4+CD44high T cells in the spleen of iLN-labeled (purple) and mLN-labeled (orange) Pham T mice, for Cxcr6 (top), P2rx7 (middle), and CD49d (Itga4) vs CD29 (Itgb1) (bottom). Pham T mice were subjected to different s.c. immunization regimens at the base of tail plus pertussis toxin i.v. on day 0 and day 2 after immunization (as indicated) and analyzed 2 days after photoconversion on day 11 after immunization. Representative plots from n= 3 Pham T mice per group (iLN- and mLN-labeled) and immunization condition. Numbers indicate mean fluorescent intensities. b, i-T cells and m-T cells do not cross-traffic after i.v. immunization. 2D2 Pham T mice were injected with 40 μg MOG(35-55) i.v., photoconverted at iLN (left) or mLN (right) on day 2, and analyzed for the fraction of CD44high mD2RED T cells in iLN and mLN on day 4 after injection. Representative plots from n = 4 2D2 Pham T mice per group.
Extended Data Fig. 7
Extended Data Fig. 7. Distinct functional phenotypes of i-T cells and m-T cells in the CNS compartment both in mice and humans.
a, EAE progression in iLN-labeled and mLN-labeled PhAM T EAE mice. Photoconversion at disease onset and analysis 2 days later. iLN-labeled n = 5 mice, mLN-labeled n = 3 mice, representative plot from five independent experiments. Data shown as mean ± s.d. b, Flow cytometric assessment of CD49d (Itga4) vs CD44 in transferred TCRMOG mD2REDCD4+CD44high i- and m-T cells isolated from the spleen of secondary recipient Rag1 –/– mice (approximately 20 days after transfer). n = 3 mice per group. c, EAE progression in wild-type (WT) and Cxcr6 –/– mice. WT n = 5 mice, Cxcr6 –/– n = 6 mice, representative plot from three independent experiments. Data shown as mean ± s.d. d, Unsupervised clustering t-distributed stochastic neighbour embedding (t-SNE) plot of cerebrospinal fluid (CSF) single CD4+ T cells isolated from untreated MS patients, colored according to T helper cell and Treg cell signature gene expression. Th1 (CSF1, CXCR6, IL12B2, IL18R1, KLRC1, HOPX), Th2 (IL4, TNFSF13B, BATF, NFIL3, ATF5), Th17 (IL17A, IL21, IL2, TNFRSF13B, PTGFRN, AHR, IRF4, RORA, PLAGL2), and Treg (FOXP3, IKZF2, NRP1, FOSB, TNFSF11, IRF8). e, Gene marker expression of a selection of i-stream core signature genes (IL2RB, IL18RAP, SYTL2) (top row), and m-stream core signature genes (NT5E, DST, AIG1) (bottom row). d, e, n = 6 CSF samples from untreated MS patients, n = 14339 cells.
Fig. 1
Fig. 1. Provenance mapping of central nervous system T cells to distinct peripheral priming sites.
a, c, Kinetics of mD2REDCD4+ T cell in iLN of FTY720-treated and untreated (no FTY) mice after photoconversion in steady state (a) and on day 4 after EAE induction (c). Representative plot of one PhAM T mouse per time point and one non-photoconverted dark control (bar) from two independent experiments. b, d, Population dynamics of T cell populations 2 days after photoconversion without (left; no FTY) or with FTY (right) in steady state (b) and on day 6 after immunization (d). Red bars represent the frequencies of mD2REDCD4+ T cells of all CD4+ T cells directly (day 0, left) and 2 days after photoconversion (right) in iLN. Representative plot from two independent experiments. e, f, g, Flow cytometric assessment of iLN-labeled (e) and mLN-labeled (f) PhAM T EAE mice 2 days after photoconversion at disease onset in the periphery (e, f) and the CNS (g). Representative plots from n = 15 mice per group for the periphery and the CNS. The site of photoconversion (iLN or mLN) is indicated (lightning symbol). h, Frequencies of regulatory and activated conventional mD2REDCD4+ T cells in PhAM T EAE mice for different tissues. n = 2 mice per group, representative plot from three independent experiments. Data shown as mean. i, Velocity versus Ca2+-indicator ratio (YFP/CFP) of TCRMOG Twitch-2B T cells in iLN and mLN imaged on days 3 or 4 post transfer. Cell numbers and Ca2+ ratios = 24 and 883 for iLN(PBS), 25 and 856 for iLN(MOG), 67 and 2353 for mLN(PBS), and 167 and 5971 for mLN(MOG), respectively. j, Mean T cell fractions with MOG-specific Ca2+ signals in iLN and mLN. n = 3 experiments. Data shown as mean T cell fraction (MOG(CFA) – PBS (CFA)) + s.d.. k, IAb-MOG tetramer binding in mD2RED i-T and m-T cells in the CNS of PhAM T EAE mice. Pool of n = 3 mice per group, representative plot from two independent experiments.
Fig. 2
Fig. 2. Clonal expansion of i-T cells vs m-T cells.
a, Unsupervised clustering t-distributed stochastic neighbour embedding (t-SNE) plot of all single mD2RED CD4+CD44high T cells colored according to the cell cluster (upper plot), i-stream (middle), and m-stream (lower). n = 5 PhAM T EAE mice per group, n = 14621 cells, i-LN n = 4940 cells, i-Spleen n = 1840 cells, i-CNS n = 448 cells, m-LN n = 4888 cells, m-Spleen = 2001 cells, m-CNS n = 504 cells. Clusters 0, 1-5, 6, and 7 are highlighted by grey lines. b, TCR repertoire clonality analysis for each group plotted on a two-layer donut chart. First layer indicates the frequency of singleton (“1”, met once), doubleton (“2”, met twice), and clonotypes that met three or more times (“3+”). The second layer (quantile), displays the abundance of top 20% (Q1), next 20% (Q2) and up to Q5 clonotypes for clonotypes from “3+” set. The letter at the beginning corresponds to the i- or m-stream and the number corresponds to the cluster where those single T cells originated from in the unsupervised clustering. c, Repertoire overlap analysis using hierarchical clustering. Dendrogram shows weighted clonal overlaps for TRBCDR3 sequences among clusters, analyzed using F pairwise similarity metric in VDJtools. Branch length shows the distance between repertoires. For each stream a clonotype tracking heatmap is shown. Each row corresponds to a clonotype that is shared between samples of the same stream. Only top shared most abundant clonotypes are plotted. d, Heatmap representation of TRBV gene families across samples. Sample clustering based on variable segment usage. Weighted variable segment usage profiles were used, hierarchical clustering was performed using Euclidean distance. b-d, n = 3 PhAM T EAE mice per group, n = 8254 cells, i0 n = 723 cells, i1-5 n = 2603 cells, i7 n = 321 cells, i6 n = 411 cells, m0 n = 643 cells, m1-5 n = 3166 cells, m7 n = 240 cells, m6 n = 147 cells.
Fig. 3
Fig. 3. Imprinting of T helper cell signatures in i-T cells vs m-T cells.
a, Unsupervised clustering t-distributed stochastic neighbour embedding (t-SNE) plot of all single mD2RED CD4+CD44high T cells colored according to the cell cluster (left) or i- and m-stream (right). n = 2 PhAM T EAE mice per group, n = 4169 cells. b, Cluster distribution of i-stream (top) vs m-stream (bottom) by tissue. c, Two-sided Hartigan’s dip test of multimodality applied to i-T cells in the CNS (left), m-T cells in the CNS (middle), and all mD2RED (combined i- and m-) T cells per CNS (right) without adjustments for multiple comparison. d, RNA velocity analysis using ratios of unspliced-to-spliced transcripts plotted in UMAP space for single T cells from i-stream (left) and m-stream (right). The directional flow of the velocity arrows between cell clusters shows the projection from the observed state to predicted future state. e, T-cell signature scores based on the expression of key genes. Th1 n = 553 cells, at least 3 genes out of Csf1, Cxcr6, Il12rb2, Il18r1, Klrc1, and Hopx; Th2 n = 389 cells, at least 2 genes out of Il4, Tnfsf13b, Batf, Nfil3, and Atf5; Th17 n = 127 cells, at least 4 genes out of Il17f, Il17a, Il21, Il2, Tnfrsf13b, Ptgfrn, Ahr, Irf4, Rora, and Plagl2; Treg n = 373 cells, at least 3 genes out of Ikzf2, Nrp1, Fosb, Tnfsf11, and Irf8. f, GSEA for gene signatures (see text) differentially expressed in m-stream vs i-stream tissues.
Fig. 4
Fig. 4. Core signatures of i-T cells vs m-T cells.
a, Unsupervised clustering t-distributed stochastic neighbour embedding (t-SNE) plot of all single mD2REDCD4+CD44high T cells colored according to the lymph node of origin (top), the spleen (middle), and the CNS (bottom) for the i- and m-stream. n = 2 PhAM T EAE mice per group, n = 4169 cells, i-LN n = 1296 cells, i-Spleen n = 542 cells, i-CNS n = 233 cells, m-LN n = 1404 cells, m-Spleen = 525 cells, m-CNS n = 169 cells. b, Core gene set from differentially expressed genes in all three tissues with P-value < 0.05 for the i-stream (top) vs the m-stream (bottom). Two-sided Wilcoxon rank-sum test. c, d, Average gene expression for the 94 genes in the i-stream core gene set (c) and the 50 genes in the m-stream core gene set (d) per tissue as indicated. e, Flow cytometric assessment of Cxcr6 (top), P2rx7 (middle) vs CD44 and CD49d (Itga4) vs CD29 (Itgb1) (bottom) of mD2REDCD4+CD44high i- and m-T cells in the spleen of PhAM T EAE mice 2 days after photoconversion at disease onset. Representative plots from n = 3 mice per group for Cxcr6, P2rx7 and CD49d/CD29.
Fig. 5
Fig. 5. Transcriptional modules of i-T cells vs m-T cells.
a, Normalized ATAC signal displaying all peaks for i- and m-T cells from spleen (grey). Dashed lines represent the border of fold enrichment between i- and m-T cells > 2; peaks with < 5-fold enrichment over background signal were discarded. Peaks associated to genes overexpressed in CNS i-stream are shown in purple; peaks associated to genes overexpressed in CNS m-stream are shown in orange. Some relevant genes are labeled: Ahr, Itga4, Nt5e, Adk, Malt1, and P2rx7 (m-stream); Ifngr1, Itgb1, Icos, Cxcr6, Il1r1, Satb1, and Cd7 (i-stream). Pool of n = 2 PhAM T EAE mice per group. b, Average gene expression of genes (n = 65, 47 i-stream up and 18 m-stream up) that are both in the core gene set of differentially expressed genes and contain differentially open chromatin. c, Genome browser view of some of the signature genes mentioned in (a) which are also associated to differentially open chromatin regions. Displayed tracks correspond to ATACseq for i-T cells (purple) and m-T cells (orange). In all regions, differential peaks are highlighted with arrows. d, List of the top 20 enriched pathways found for i-stream (left) and m-stream (right) based on genes associated to differential open chromatin regions which were also differentially expressed (core signature genes). Two-tailed Fisher’s exact test with Benjamini-Hochberg FDR correction. e, Transcription factor activity score as assessed with Regulatory Genomics Toolbox in i-signature genes with differentially open chromatin regions as compared to m-T cells and in m-signature genes with differentially open chromatin regions as compared to i-T cells, ranked by transcription factor activity score. Y-axis represents the differences in the transcription factor dynamics between the two conditions, and x-axis shows the position of transcription factors in the ranking. Transcription factors active in the m- and i-stream are positioned on the left and right side of the plot, respectively. Some relevant transcription factors are highlighted.
Fig. 6
Fig. 6. The i- and m-signatures of antigen specific T cells are robust under various priming conditions.
a, Flow cytometric assessment of mD2REDCD4+CD44high T cells in the spleen of iLN-labeled (purple) and mLN-labeled (orange) Pham T mice, 2D2 Pham T mice, and 2D2 x TH Pham T mice for Cxcr6 (top), P2rx7 (middle), and CD49d (Itga4) vs CD29 (Itgb1) (bottom). Pham T mice were subjected to either MOG(35-55)/CFA or OVA(323-339)/CFA s.c. immunization at the base of tail or MOG(35-55)/CFA s.c. immunization at the neck (between the shoulder blades) plus pertussis toxin i.v. on day 0 and day 2 after immunization (as indicated) and analyzed 2 days after photoconversion on day 11 after immunization. 2D2 Pham T mice were immunized with 40 μg MOG(35-55) i.v., photoconverted on day 2, and analyzed on day 4 after immunization. 2D2 x TH Pham T mice were photoconverted at disease onset (approximately at 5 weeks of age) and analyzed 3 days after photoconversion. Representative plots from n = 3 Pham T mice per group and immunization condition, n = 4 2D2 Pham T mice and 2D2 x TH Pham T mice per group. Numbers indicate mean fluorescent intensities. b, Gene expression heatmap of all differentially expressed genes in the bulk sequencing data (up and down regulated) in i-T cells and m-T cells isolated from the spleen of 2D2 x TH Pham T mice. Differentially expressed genes (p-value < 0.05) were detected using the Seurat “FindMarkers” function, based on two-sided Wilcoxon rank-sum test and adjusted by the Bonferroni method. Art2b, Itga4, Itgb1, Ifitm2, Cd7, Rarg and Stx11 position is indicated. c, GSEA of i- and m-T cell core signatures (see Supplementary Table 1) in bulk RNAseq data of i-T cells vs m-T cells isolated from lymph nodes (top row) and spleen (bottom row) of 2D2 x TH Pham T mice. d, Waterfall plot of genes expressed in i-T cells (left) versus m-T cells (right) from the spleen of 2D2 x TH Pham T mice, ranked by fold-change. Significant genes at p-value < 0.05 are colored. Two-sided Wilcoxon rank-sum test adjusted by the Bonferroni method. Some genes are indicated by name.
Fig. 7
Fig. 7. Distinct functional phenotypes of i-T cells vs m-T cells in the CNS.
a, b, Histology of mD2GR(EEN) and mD2RED T cells in the lumbar spinal cord (SC(L)) of PhAM T EAE mice 2 days after photoconversion at disease onset (a) and quantification in SC(L) and brain stem (BST) (b). Scale bars 500 μm (left) and 20 μm (magnified; middle and right). Ten sections per mouse from n = 5 mice for i-T cells and n = 3 mice for m-T cells. Unpaired two-tailed t-test. ****P=0.000033. Data shown as mean + s.e.m.. c, Flow cytometric assessment of Cxcr6 and Itga4 vs CD44 in mD2REDCD4+ i- and m-T cells in the CNS of PhAM T EAE mice 2 days after photoconversion at disease onset. Representative plots from three mice per group. d, e, Histology of transferred TCRMOG i-T cells and m-T cells in BST and cerebellum (i-iv) and SC(L) (v-viii), comprising white matter (WM) and grey matter (GM) of recipient Rag1 –/– mice. Scale bars 500 μm (i, ii, v, vi), 50 μm (iii, iv), and 100 μm (vii, viii) (d). Quantification of GM frequencies of i- and m- T cells per SC(L) transsection (e). n = 3 mice per group. Unpaired two-tailed t-test. *P=0.046. Data shown as mean + s.d.. f, g, Immunostaining (f) and quantification of GM frequencies (g) of CD4+ T cells in SC(L) of wild-type (WT) and Cxcr6 –/– mice. WT n = 7 mice, Cxcr6 –/– n = 5 mice. Unpaired two-tailed t-test. **P=0.0055. FM, FluoroMyelin Red. Data shown as mean + s.d.. Scale bars 500 μm. h, Immunostaining of CD4+ T cells in the cerebellum of WT and Cxcr6 –/– mice. n = 3 mice per group. Scale bars 100 μm. i, Unsupervised clustering t-SNE plot of cerebrospinal fluid (CSF) single CD4+ T cells from untreated MS patients, representations of clusters (left) and TCR clonality (right). T cell clones were considered as expanded when found > 2. j, Unsupervised clustering t-SNE plot, colored according to Cxcr6 gene expression. n = 6 CSF samples, n = 14338, cluster0 = 6119, cluster1 = 4821, cluster2 = 2403, cluster3 = 995 cells.

References

    1. Bielekova B, et al. Encephalitogenic potential of the myelin basic protein peptide (amino acids 83-99) in multiple sclerosis: results of a phase II clinical trial with an altered peptide ligand. Nat Med. 2000;6:1167–1175. - PubMed
    1. Sospedra M, Martin R. Immunology of multiple sclerosis. Annu Rev Immunol. 2005;23:683–747. - PubMed
    1. Roosendaal SD, Barkhof F. Imaging phenotypes in multiple sclerosis. Neuroimaging Clin N Am. 2015;25:83–96. - PubMed
    1. Berer K, et al. Commensal microbiota and myelin autoantigen cooperate to trigger autoimmune demyelination. Nature. 2011;479:538–541. - PubMed
    1. Kadowaki A, Quintana FJ. The Gut-CNS Axis in Multiple Sclerosis. Trends Neurosci. 2020;43:622–634. - PMC - PubMed

Publication types

MeSH terms