. 2021 Jul;22(7):851-864.
doi: 10.1038/s41590-021-00943-z. Epub 2021 Jun 7.

Blockade of the co-inhibitory molecule PD-1 unleashes ILC2-dependent antitumor immunity in melanoma

Affiliations

Blockade of the co-inhibitory molecule PD-1 unleashes ILC2-dependent antitumor immunity in melanoma

Nicolas Jacquelot et al. Nat Immunol. 2021 Jul.

Abstract

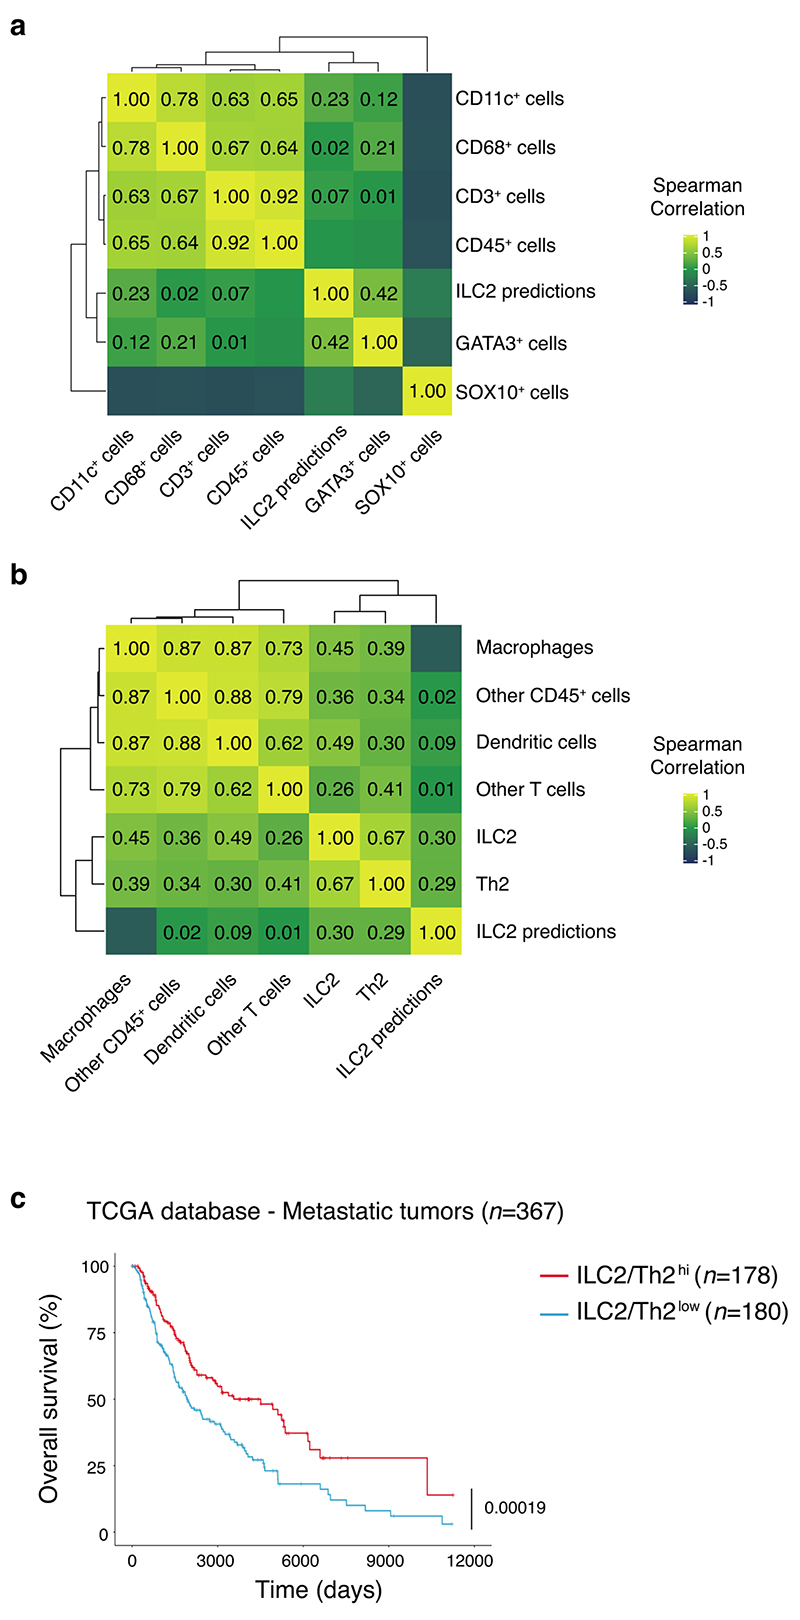
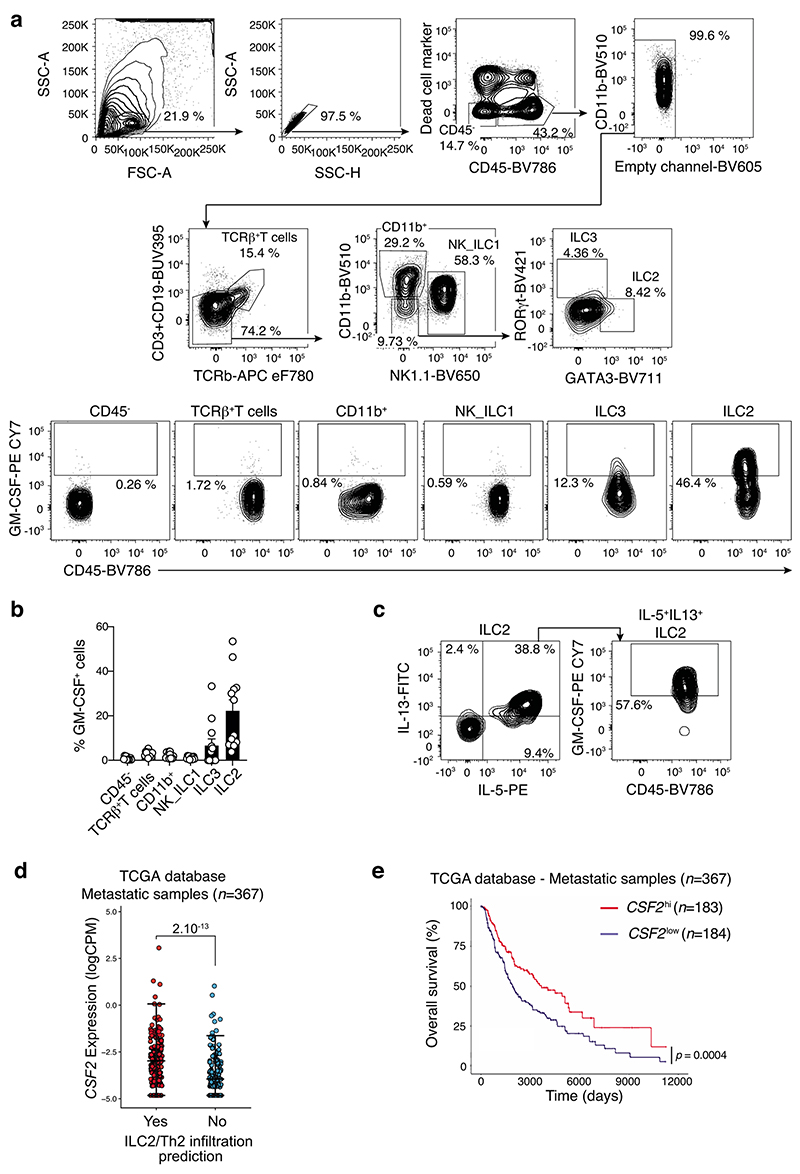
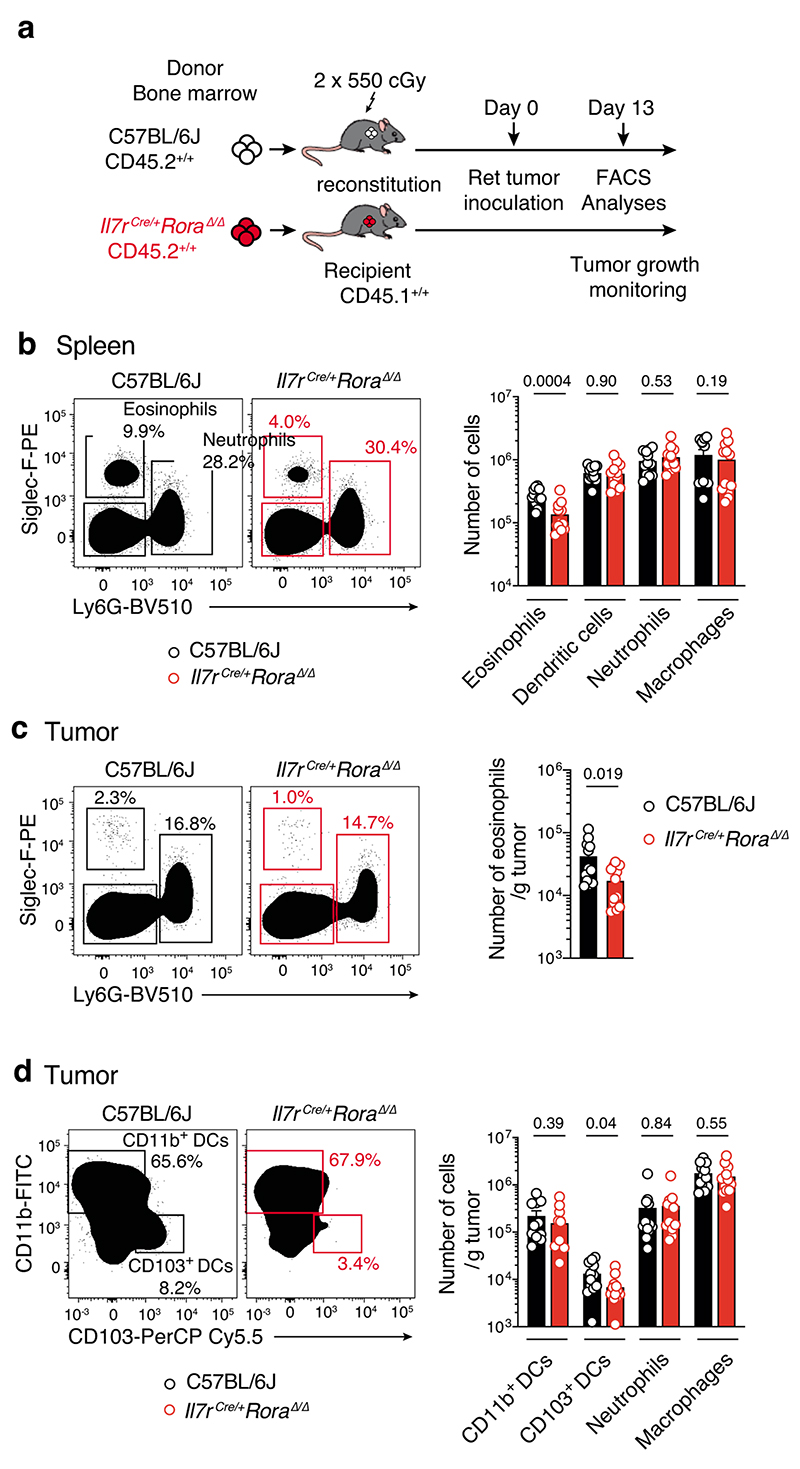
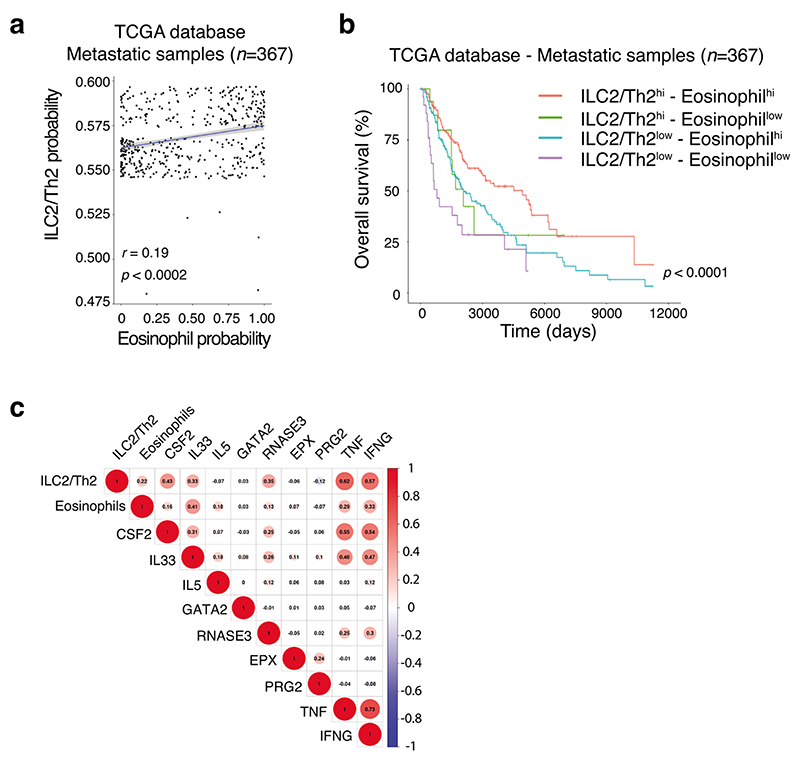
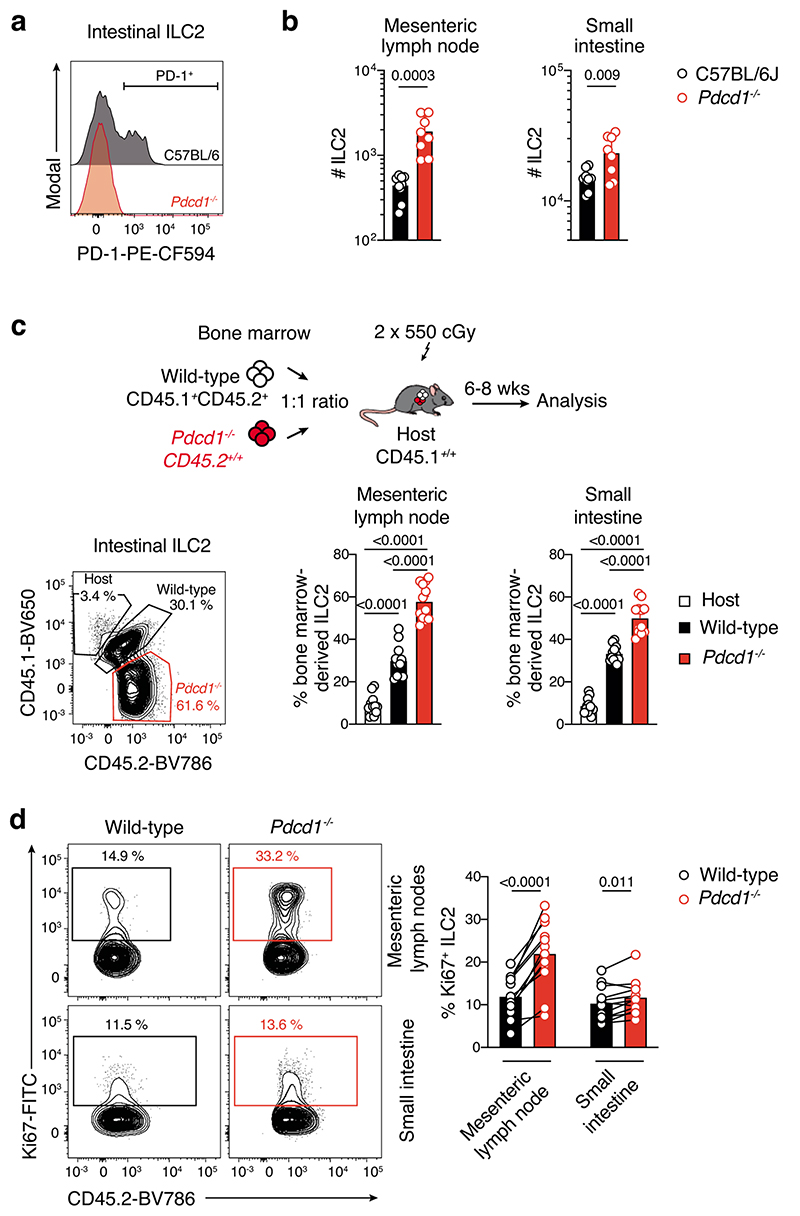
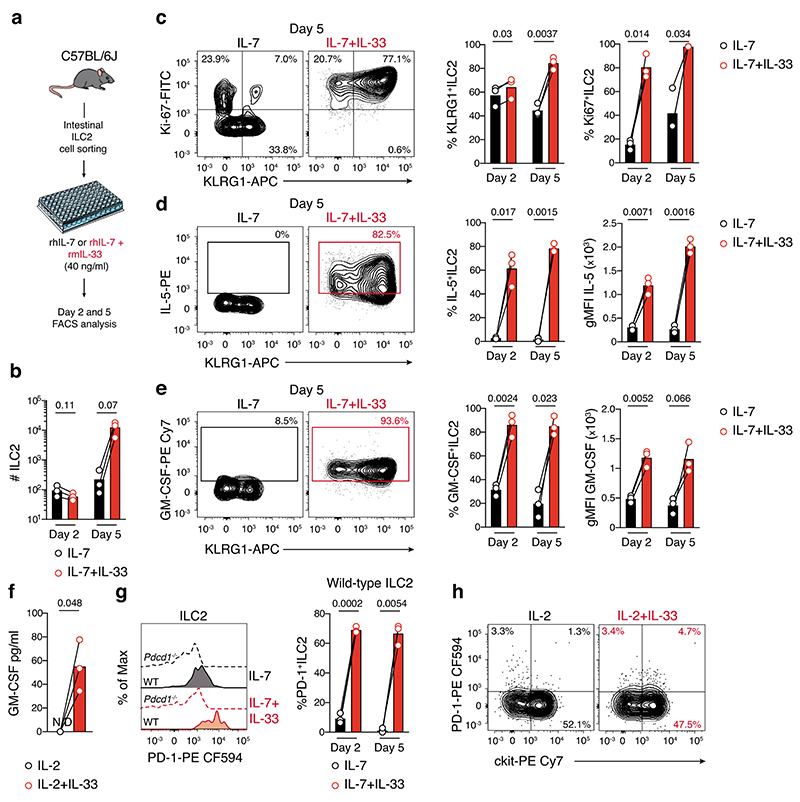
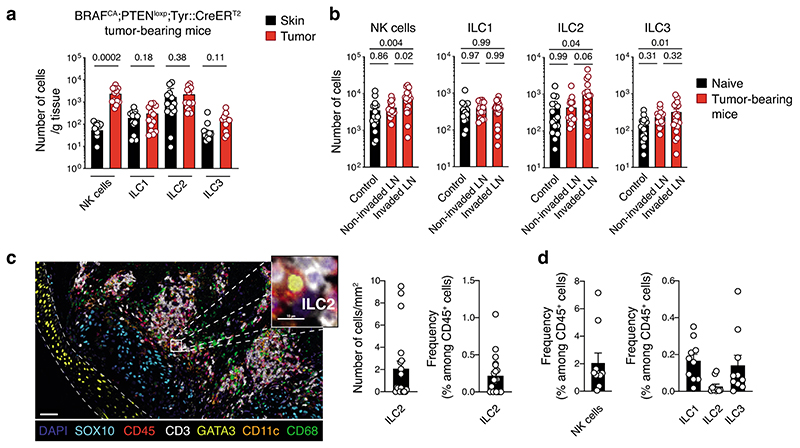
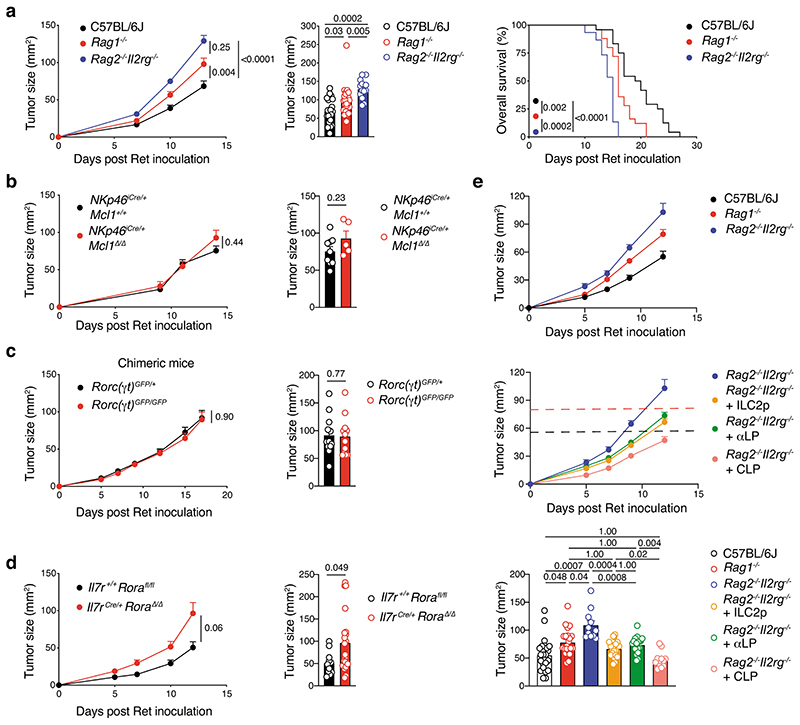
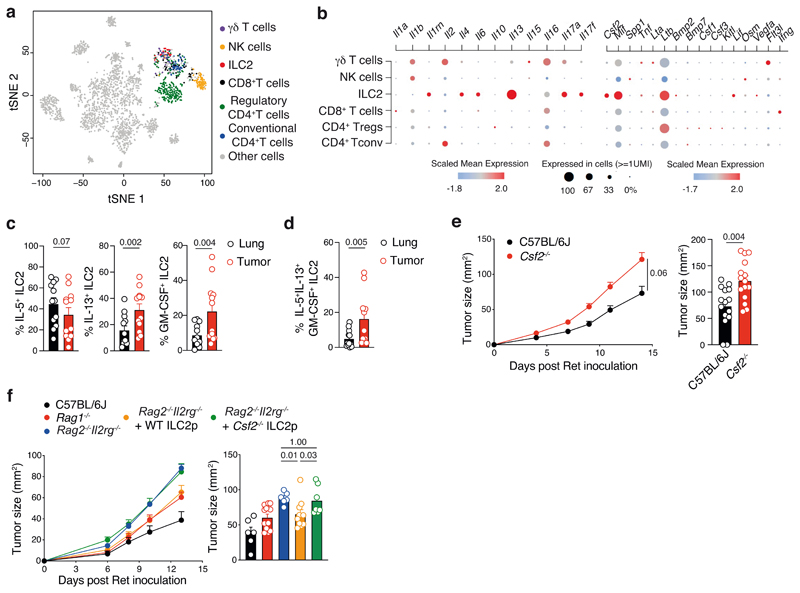
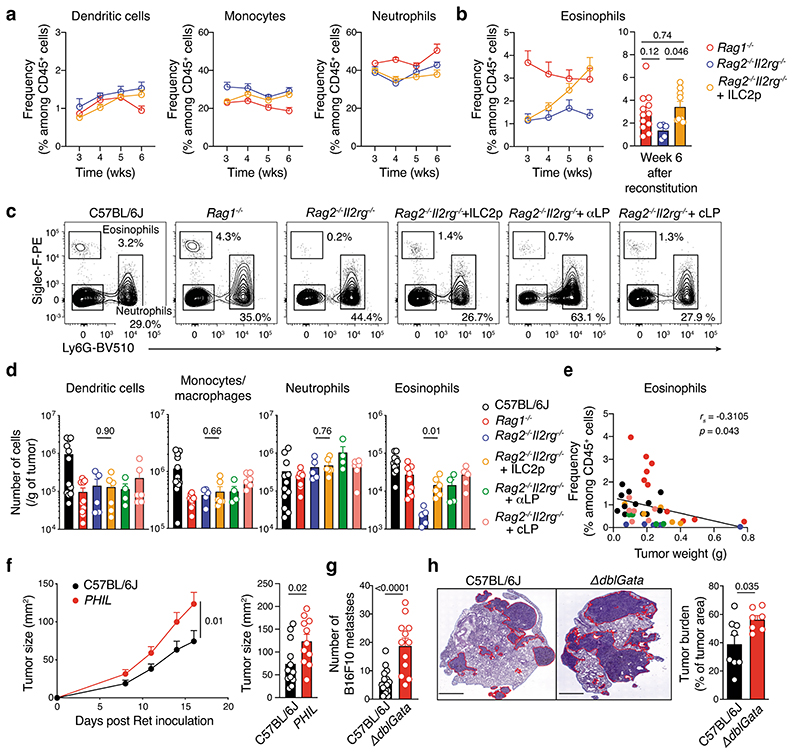
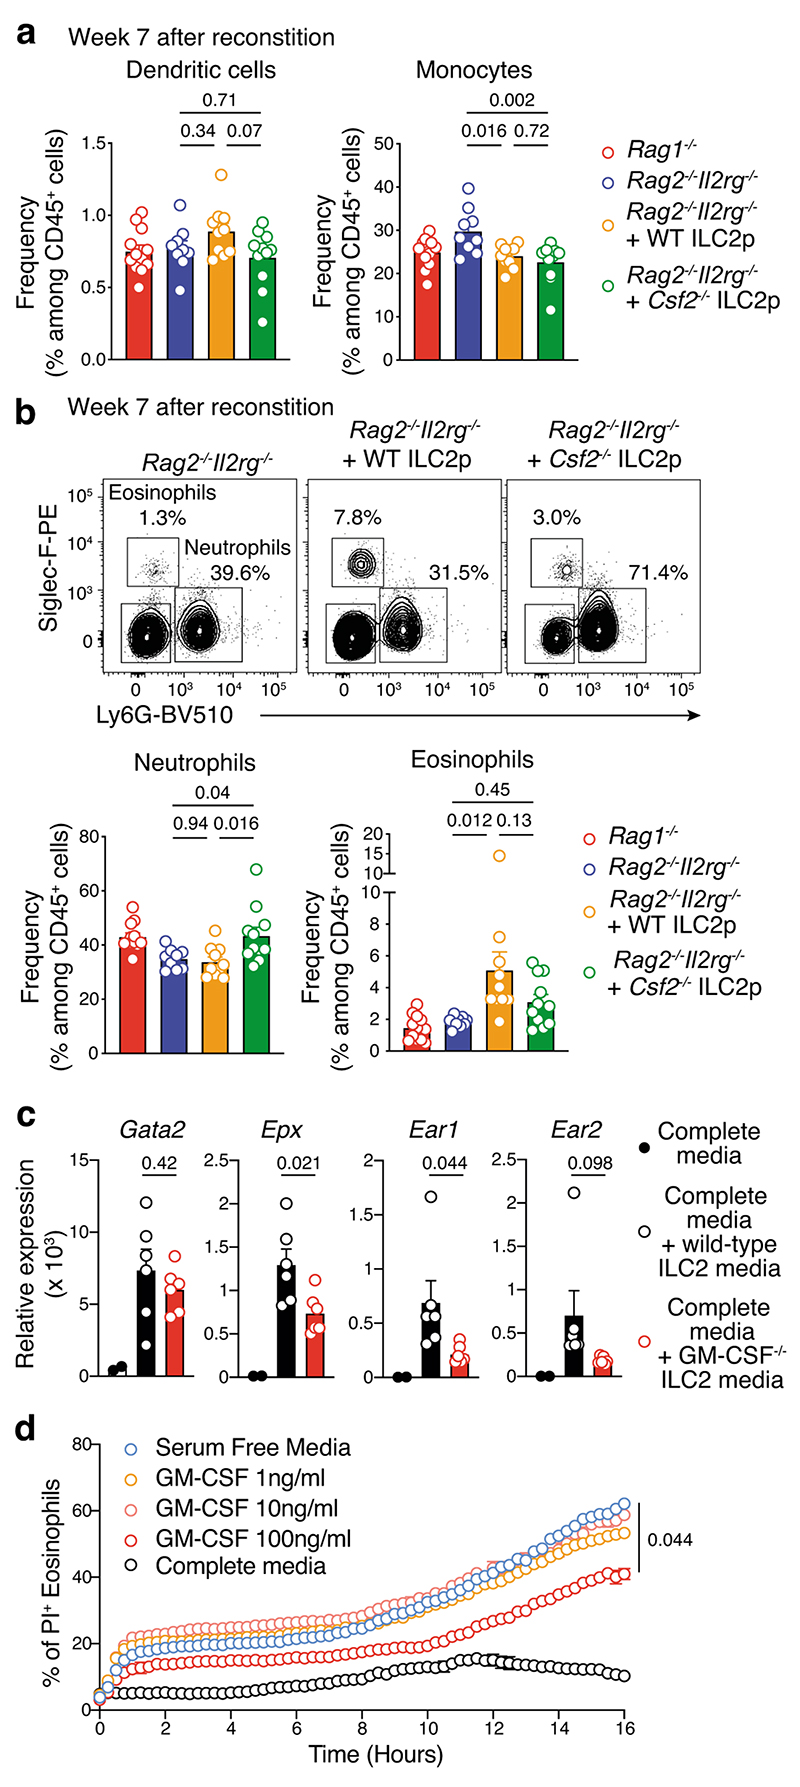
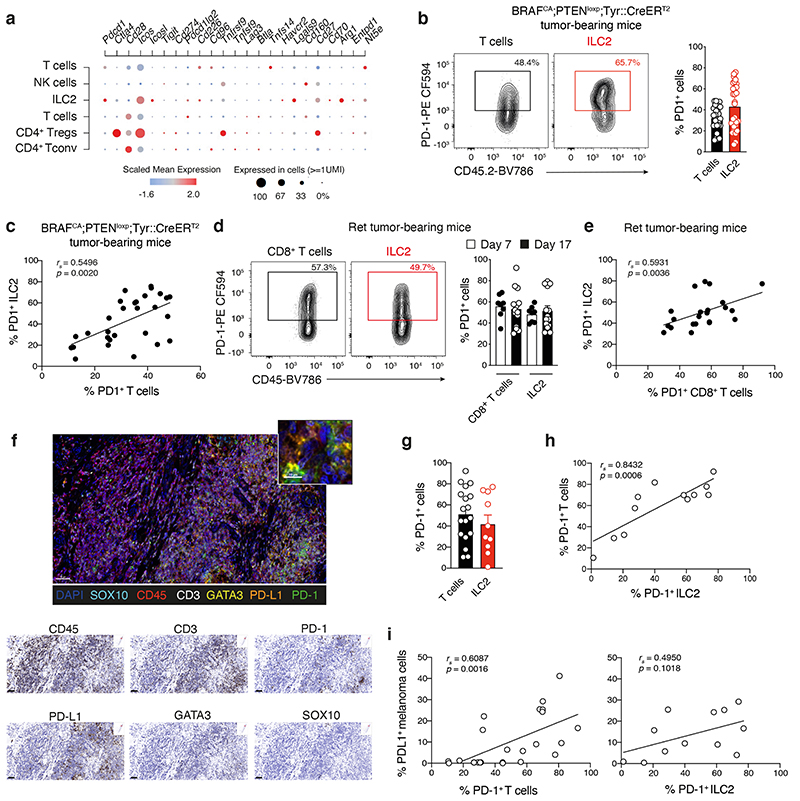
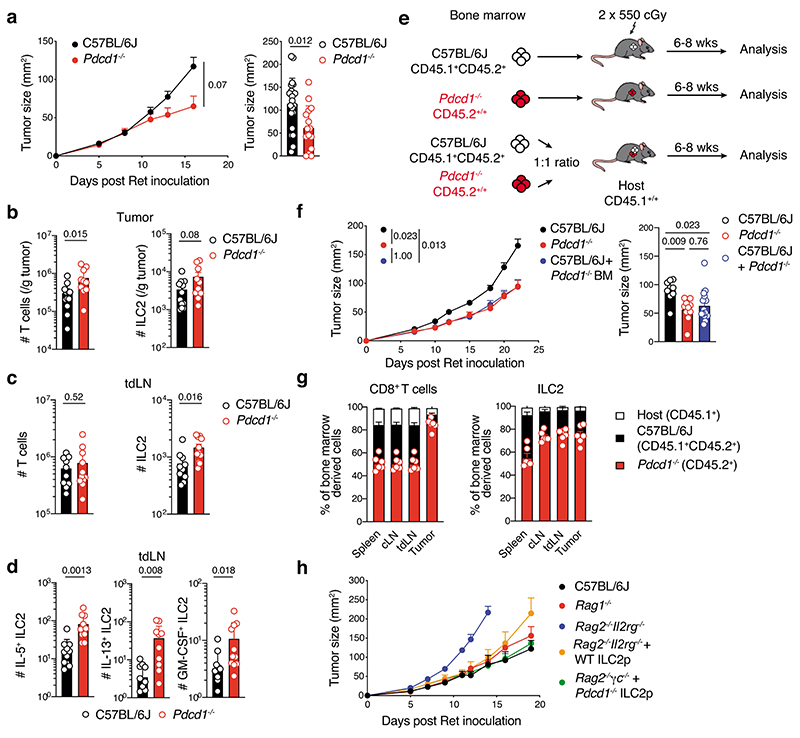
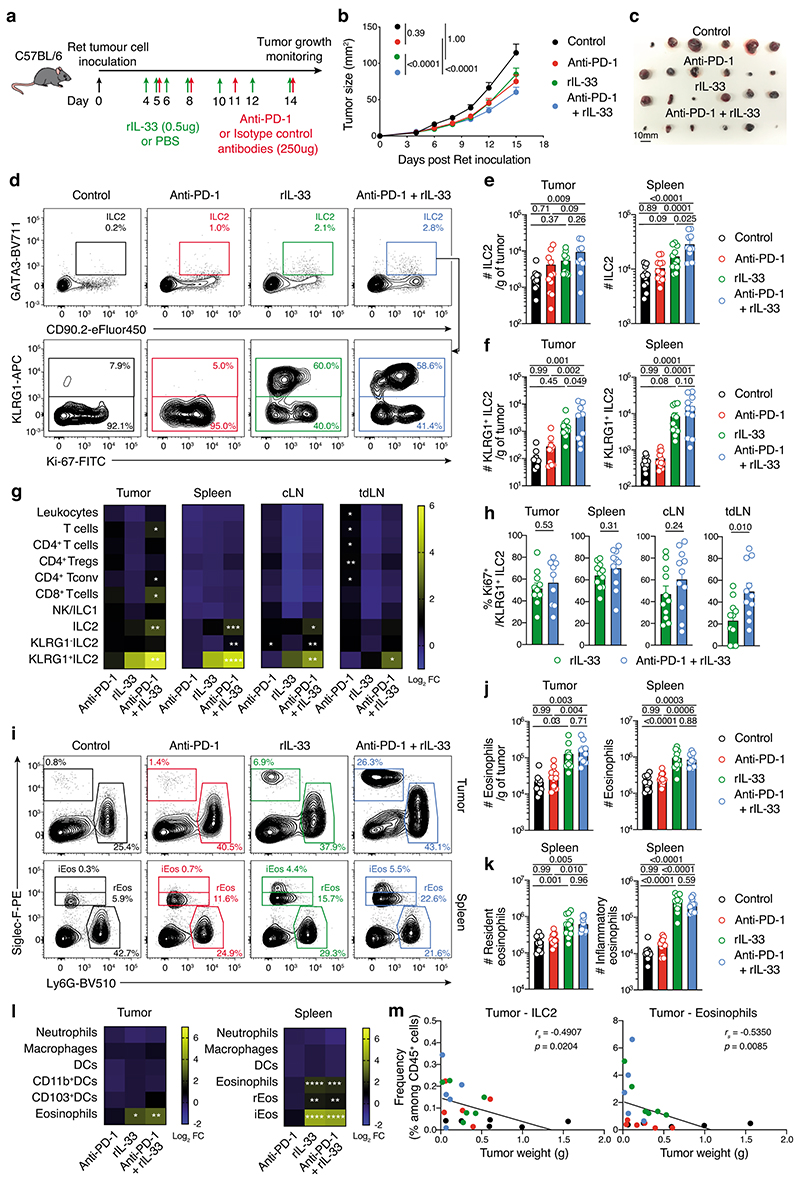
Group 2 innate lymphoid cells (ILC2s) are essential to maintain tissue homeostasis. In cancer, ILC2s can harbor both pro-tumorigenic and anti-tumorigenic functions, but we know little about their underlying mechanisms or whether they could be clinically relevant or targeted to improve patient outcomes. Here, we found that high ILC2 infiltration in human melanoma was associated with a good clinical prognosis. ILC2s are critical producers of the cytokine granulocyte-macrophage colony-stimulating factor, which coordinates the recruitment and activation of eosinophils to enhance antitumor responses. Tumor-infiltrating ILC2s expressed programmed cell death protein-1, which limited their intratumoral accumulation, proliferation and antitumor effector functions. This inhibition could be overcome in vivo by combining interleukin-33-driven ILC2 activation with programmed cell death protein-1 blockade to significantly increase antitumor responses. Together, our results identified ILC2s as a critical immune cell type involved in melanoma immunity and revealed a potential synergistic approach to harness ILC2 function for antitumor immunotherapies.


Conflict of interest statement

Competing interests

E.V. is an employee of Innate Pharma. F.S-F-G. is a consultant and has a funded research agreement with Biotheus Inc. P.N. has received research funding from Bristol Myers Squibb, Roche Genentech, Merck Sharp & Dohme, CRISPR Therapeutics, Allergan and Compugen. Other authors declare no competing interests.

Figures

Extended Data Fig. 1
Extended Data Fig. 1. Flow cytometric analyses of innate lymphoid cell subsets in BRAFCA;PTENloxp;Tyr::CreERT2 mice.
a, Kinetics of individual tumor growth in BRAFCA;PTENloxp;Tyr::CreERT2 mice. Tumor induction was performed at day 0. Individual data were pooled from 3 independent experiments (n=16, 3-9 mice per experiment). Each line shows the growth curve for an individual mouse and the mean growth is shown in dark red. b, Representative flow cytometric contour plots showing the gating strategy used to identify tumor-infiltrating immune cell populations. c, Frequency of NK cells, ILC1, ILC2 and ILC3 within skin and tumors. The skin was collected from flank on the opposite side to tumor induction. Tumor and skin-resident immune cell populations were identified as indicated in b. Data are pooled from 4 independent experiments (n=14 mice; 2-5 mice/experiment). c, Each dot represents one mouse and data show mean ± s.e.m. Statistical analyses were performed using a Student’s paired t test. p-values are indicated.
Extended Data Fig. 2
Extended Data Fig. 2. Flow cytometric analyses of innate lymphoid cell subsets in Ret melanoma tumor-bearing mice.
a,b, Enumeration (a and b) and frequency (a) of NK cells, ILC1, ILC2 and ILC3 in tumors (a) and control and tumor-draining lymph nodes (b) at 7 and 17 days after Ret tumor cell inoculation of C57BL/6J mice. NK cells were CD45+CD3-TCRβ-CD19-(lin-)CD11b+/-NK1.1+NKp46+EOMES+CD49a-, ILC1 lin-CD11b+/-NK1.1+NKp46+EOMES-CD49a+; ILC2 lin-CD11b+/-NK1.1-NKp46-RORγt-GATA3+; ILC3 lin-CD11b+/-NK1.1-NKp46-RORγt+ GATA3- cells. Data pooled from 2 independent experiments with 4-6 mice/experiment/time-point (day 7, n=8 mice; day 17, n=12 mice). c-k, Intracellular cytokine production in in vitro stimulated ILC subsets from tumors in C57BL/6J mice at day 7 and 17 for IFN-g and TNF-a (c), IL-5 and IL-13 (f), and IL-17A and IL-22 (i) in NK cells and ILC1 (c), ILC2 (f) and ILC3 (i). Representative samples for each time point (n=4-6 mice/experiment). d,g and j, Heatmaps showing the log2 fold change between day 7 and 17 of the mean intracellular IFN-g (d), IL-5 and IL-13 (g), and IL-17A and IL-22 (j) in NK cells and ILC1 (d), ILC2 (g) and ILC3 (j) from different tissues. Data are pooled from 2 experiments (day 7, n=8 mice, except for the lung, n=4; day 17, n=12 mice; 4-6 mice per experiment/time point). Insufficient ILC1 were recovered from the contralateral lymph nodes for accurate data interpretation (indicated by a cross). e,h and k, Frequency of tumor-infiltrating IFN-g+ NK cells and ILC1 (e), IL-5+ and IL-13+ ILC2 (h), and IL-17A+ and IL-22+ ILC3 (k) relative to tumor weight (g). Data shows pooled results from day 7 (n=8) and 17 (n=12). a,b,e,h, and k, Each dot represents one mouse. a and b, Data show the mean ± s.e.m and statistical analyses were performed using unpaired Student’s t tests (a) or ANOVA followed with Tukey’s multiple comparison tests (b). e,h, and k, Correlations were assessed using non-parametric Spearman’s correlation test. Non-linear fitting curves (one-phase decay) were overlaid. Spearman’s Rho (rs) and p-values are indicated.
Extended Data Fig. 3
Extended Data Fig. 3. ILC2-dependent anti-tumor immunity in Il7rCre/+Roraρ/ρ mice.
a-e, Ret tumor growth and immune cell composition of Ly5.1+/+ chimeric mice reconstituted with C57BL/6J (CD45.2+/+) or Il7rCre/+Rora□/□ (CD45.2+/+) (5) bone marrow. a, Schematic representation of the experimental design. b, Ret tumor growth over time (left) and day 18 tumor size (right). Statistical analyses of tumor growth were performed using TumGrowth. Data represents one experiment with 6 mice/genotype and show the mean ± s.e.m. c-d, Representative flow cytometric contour plots (left panels) and enumeration (right panels) of intestinal (c) and tumor-infiltrating (d) ILC2 at day 13 after Ret tumor cell inoculation. ILC2 were defined as live CD45.2+lin-(CD3e-TCRb-CD19-CD11b-NKp46-RORgt-) CD90.2+GATA3+ cells. e, Enumeration of tumor infiltrating leukocytes cells at day 13 post Ret tumor inoculation. Leukocytes were defined as live CD45+; B cells as live CD45+CD3ε-TCRβ-CD19+; CD4+ T cells as live CD45+CD3ε+TCRβ+CD4+; CD8+ T cells as live CD45+CD3ε+TCRβ+CD8+; NK cells as live CD45+CD3ε-TCRβ-(lin-)CD19-NKp46+Eomes+; ILC1 as live lin-NKp46+Eomes-; and ILC3 as live lin-CD11b-NKp46-RORγt+. Data pooled from 2 independent experiments (n=6 mice/genotype/experiment) and show the mean ± s.e.m. b-e. Each circle represents one mouse and p-values are indicated.
Extended Data Fig. 4
Extended Data Fig. 4. ILC2-dependent anti-tumor immunity in ICOS-T mice.
Ret tumor growth and tumor immune cell composition of C57BL/6J and ICOS-T mice (CD4Cre/+ICOSfl-DTr/+) treated with PBS or rmIL-33 and/or diphtheria toxin (DTx). a, Experimental design and treatment regime for amplification and deletion of ILC2 in vivo. b, Ret tumor growth (left panel) and tumor weight (g) (right panel) at day 17. Data show the mean ± s.e.m. Each dot represents one mouse. Statistical differences were assessed using an unpaired Student’s t test between the groups ICOS-T + IL-33 and ICOS-T DTx + IL-33 and the p value is indicated. Data show C57BL/6J + PBS (tumor growth, n=3; tumor weight, n=2 mice), C57BL/6J + IL-33 (tumor growth, n=3; tumor weight, n=3 mice), ICOS-T + IL-33 (tumor growth, n=6; tumor weight, n=4 mice), ICOS-T + IL-33 + Dtx (tumor growth, n=6; tumor weight, n=4 mice). c,d, Representative flow cytometric contour plots (left panels) and quantification (middle panels) of tumor-infiltrating ILC2 (CD45+lin-(CD3e-TCRb-CD11b-NK1.1-NKp46-) RORgt-GATA3+) and regulatory CD4+ T cells (Tregs, CD45+CD3e+TCRb+CD8-CD4+CD25+Foxp3+) in each treatment. Data show mean ± s.e.m. (middle panels). Dot plots show the correlation of the frequency of (c, right) tumor infiltrating ILC2 or (d, right) Tregs with tumor weight (g) (right panels). Individual data points are colored by experimental group. Correlations were assessed using non-parametric Spearman’s correlation tests and overlaid by linear regression curves. Each dot represents one mouse (n=13 mice). Spearman’s Rho (rs) and p-values are indicated. e, Frequency of tumor-infiltrating CD8+ (live CD45+CD3e+TCRb+CD8+CD4-) T cells. Data show mean ± s.e.m (left panel). Dot plots showing correlation between the frequency of tumor-infiltrating CD8+ T cells and tumor weight (g) (right panel). Individual data points are colored by experimental group. The correlation was assessed using a non-parametric Spearman’s correlation test. A simple linear regression curve was been overlaid on data for individual animals (n=13) from one experiment. Spearman’s Rho and p-values are indicated.
Extended Data Fig. 5
Extended Data Fig. 5. Internal validation and prognosis of an ILC2/type 2 immune cell signature in human melanoma.
a,b, ILC2 infiltration probability is predicted from NanoString transcriptome profiles, which measures a panel of 730 genes. For each patient, the predicted infiltration probability is correlated with IHC markers (a) and immune cell infiltration estimates (b) from Pan Immune multiplex IHC obtained from that patient. Spearman correlation values are indicated. c, Analysis of the impact of enrichment of type 2 immune cell infiltration on melanoma patient survival using the publicly available TCGA database. Tumor infiltration probability was determined as described in the Methods using machine learning. Kaplan-Meier overall survival curves of metastatic melanomas (n=367) plotted against the likelihood of high and low infiltration of tumors by ILC2. f, Kaplan-Meier survival statistical analysis was performed using a Log-rank test. p-value is indicated.
Extended Data Fig. 6
Extended Data Fig. 6. Ret tumor-infiltrating ILC2 express high levels of GM-CSF and high Csf2 expression in human melanoma tumors is associated with increased survival.
a, Representative flow cytometric full gating strategy used to identify GM-CSF-expressing ILC2 in Ret melanoma tumors 7 days after tumor inoculation. GM-CSF expression in other immune and non-immune cell subsets is also depicted. b, Frequency of GM-CSF producing cells in Ret melanoma tumors. Each circle represents one mouse and data and show mean ± s.e.m. Data are pooled from 2 independent experiments (n=12 mice) with 6 mice/experiment. c, Representative flow-cytometric gating strategy used to identify polyfunctional ILC2 (IL-5+IL-13+GM-CSF+). a-c, Single cell suspensions of digested tumor cells were stimulated with 50 ng/ml PMA, 500 ng/ml ionomycin in the presence of GolgiStop™ for 4h before intracellular staining for IL-5, IL-13 and GM-CSF. b, Each circle represents one mouse and data show mean ± s.e.m. and are pooled from 2 independent experiments with 6 mice/experiments. a and c, Data show one of two independent experiments performed with 6 mice/experiment. d,e, Analysis of the publicly available TCGA database. d, Plot shows tumor CSF2 gene expression according to type 2 immune cell tumor enrichment probabilities in individual human metastatic melanoma samples. Tumor enrichment probabilities were determined as described in the Material and Methods using machine learning. Mean difference in CSF2 expression between TCGA metastatic samples predicted with type 2 immune cell infiltration (red) or no infiltration (blue). Data show statistical significance was determined by Student’s t test. e, Kaplan-Meier overall survival curves of metastatic melanomas (n=367) plotted against the likelihood of high and low tumor CSF2 expression. Kaplan-Meier survival statistical analysis was performed using a Log-rank test. p-value is indicated.
Extended Data Fig. 7
Extended Data Fig. 7. Reduced eosinophils in Ret tumor-bearing ILC2 deficient mice.
Myeloid immune cell composition of Ly5.1+/+ chimeric mice reconstituted with C57BL/6J (CD45.2+/+) or Il7rCre/+RoraΔ/Δ (CD45.2+/+) (5) bone marrow. a, Schematic representation of the experimental design. b-d, Representative flow cytometric contour plots (left panels) and enumeration (right panels) of splenic (b) and tumor-infiltrating (c and d) eosinophils, dendritic cells (DC), neutrophils and macrophages at day 13 after Ret tumor cell inoculation. Immune subsets were defined as eosinophils: live CD45.2+CD64-F4/80-CD3e-CD19-CD11c+/-MHCII+/-CD11b+Siglec-F+Ly6G- cells; DC: live CD45.2+CD64-F4/80-CD3e-CD19-CD11c+MHCII+ cells; macrophages: live CD45.2+CD64+F4/80+ cells; neutrophils: live CD45.2+CD64-F4/80-CD3e-CD19-CD11c+/-MHC II+/-CD11b+Siglec-F-Ly6G+ cells. d, Tumor-infiltrating DC were segregated into CD11b+ DC and CD103+ DC. b-d, Data are pooled from 2 independent experiments (n=6 mice/genotype/experiment) and show the mean ± s.e.m. Each dot represents one mouse. b-f, Statistical differences were assessed using unpaired Student’s t tests and exact p-values are indicated.
Extended Data Fig. 8
Extended Data Fig. 8. ILC2/type 2 immune cell enriched human melanoma tumors are associated with increased eosinophil infiltration and gene expression.
a and b, Analysis of the impact of tumor ILC2 and eosinophil infiltration on melanoma patient survival using the publicly available TCGA database. a, Dot plot of the probability of tumor eosinophil infiltration versus the probability of type 2 immune cell tumor enrichment in human metastatic melanoma samples (n = 367 tumors). Tumor-infiltration probabilities were determined as described in the Material and Methods using machine learning. The correlation was assessed by using Pearson’s correlation test. Each dot represents one human sample b, Kaplan-Meier overall survival curves of metastatic melanomas (n=367) plotted against to the likelihood of the high and low infiltration of tumors by type 2 immune cells and eosinophils. Kaplan-Meier survival statistical analysis was performed using a Log-rank test. p-value is indicated. c, Pearson’s correlation analyses of the tumor-infiltrating ILC2 and eosinophil probabilities with CSF2, IL33, IL5, GATA2, RNASE3, EPX, PRG2, TNF and IFNG genes in metastatic tumor melanoma samples available from the publicly TCGA database. Populations and genes that were found to positively and negatively correlate between the indicated populations are shown in red or blue, respectively. Circle size represents the strength of the correlation between two populations.
Extended Data Fig. 9
Extended Data Fig. 9. PD-1 inhibits tissue ILC2 accumulation and ILC2 proliferation.
Flow cytometric analyses of immune cells subsets in intestinal tissues and bone marrow collected from C57BL/6J and Pdcd1-/- mice at steady-state. a, Representative flow cytometric histogram showing PD-1 expression on C57BL/6J and Pdcd1-/- intestinal ILC2. Representative of 3 independent experiments (n=3 mice/experiment) with similar PD-1 expression on C57BL/6J ILC2. b, Enumeration of ILC2 in the mesenteric lymph node (left) and the lamina propria of the small intestine collected (right) from C57BL/6J and Pdcd1-/- mice. Data (C57BL6, n=9 mice; Pdcd1-/-, n=8 mice) are pooled from 3 independent experiments with 2-3 mice/genotype/experiment. c, Schematic representation of the experimental design (top) and frequency of bone marrow derived ILC2 in the mesenteric lymph nodes and small intestine of mixed bone marrow chimeric mice (bottom). Data are pooled from 2 independent experiments (n=12 mice; 6 mice/experiment). d, Flow cytometric contour plots (left panels) and quantification (right panels) of proliferation (Ki67+ cells) in ILC2 isolated from the mesenteric lymph nodes and small intestine of mixed bone marrow chimeric mice. Data are pooled from 2 independent experiments (n=12 mice; 6 mice/experiment). b-d, Each circle represents one mouse and data show mean ± s.e.m. Statistical analyses were performed using paired (d) and unpaired (b) Student’s t tests or ANOVA followed with Tukey’s multiple comparison tests (c). p-values are indicated.
Extended Data Fig. 10
Extended Data Fig. 10. IL-33 stimulation induces expansion and proliferation of KLRG1+ ILC2 associated with increased cytokines production and PD-1 expression.
a-f, Flow cytometric analyses of the impact of IL-33 stimulation on purified intestinal ILC2. Live ILC2 were identified as follow: CD45+CD3-CD19-TCRβ-CD11b-NK1.1-c-kit-Sca-1+KLRG1+/-. a, Experimental design. Purified intestinal ILC2 were cultured for 2 and 5 days in complete media supplemented with rIL-7 or rIL-7+rIL-33 (all 40 ng/ml) before flow cytometric analyses. b, ILC2 enumeration. c-e, Representative flow-cytometric contour plots (c, d and e, left panels) and frequencies or geometrical mean fluorescent intensities of KLRG1 (c, middle panel), Ki-67 (c, right), IL-5 (d) and GM-CSF (e). c-e Data show one of two experiments showing individual responses (open circles) and the mean of three biological replicates. Flow cytometric contour plots depict a representative analysis performed at day 5 of culture. f, GM-CSF concentration in culture supernatant of purified human ILC2 isolated from the blood of three healthy donors and stimulated with rIL-2 (5 ng/ml) or rIL-2+rIL-33 (5 ng/ml and 10 ng/ml, respectively). ILC2 were identified as Live+CD45+lin-(TCRαβ-TCRγδ-CD14-CD3-CD19-CD34-FcεRI-CD123-CD303-CD15-CD33-CD11c-CD56-CD16-) CD127+ CRTH2+. Data show the mean GM-CSF production of 3 healthy donors pooled from two independent experiments. N.D., not detected. g, Histograms (left panel) and frequencies (right panel) of PD-1 expression on wild-type and Pdcd1-/- ILC2 (2.5 × 10³ cells/well) cultured in vitro for 2 and 5 days in complete media supplemented with rIL-7 or rIL-7+rIL-33 (all 40 ng/ml). Data show the mean of three biological replicates. h, Representative flow-cytometric contour plots showing PD-1 expression on purified human ILC2 isolated from blood of healthy donors after two days of stimulation with rIL-2 (5 ng/ml) or rIL-2+rIL-33 (5 ng/ml and 10 ng/ml, respectively). ILC2 were identified as in f. One representative healthy donor out of two yielding similar results is shown. b-f, Statistical analyses were performed using paired Student’s t-test. p-values are indicated.
Fig. 1
Fig. 1. Innate lymphoid cells infiltrate murine and human melanoma tumors.
a and b, Analyses of skin, tumors and lymph nodes of BRAFCA;PTENloxp;Tyr::CreERT2 mice. a, Number of NK cells, ILC1, ILC2 and ILC3 within skin and tumors. Skin was collected from the flank on the opposite side to tumor induction. Data pooled from 4 independent experiments (n=14 mice; 2-5 mice/experiment). b, Number of NK cells, ILC1, ILC2 and ILC3 from control, non-invaded and tumor-invaded axillary and inguinal lymph nodes (LN). Control axillary and inguinal LN were collected from naïve mice. LN identified as being tumor-invaded were black and hyperplasic; non-invaded LN were white and similar in size to control LN. Data pooled from 4 independent experiments (n=16-19 mice; 2-5 mice/group/experiment). c, Multiplex immunohistochemistry staining of human primary melanoma tumors. Representative multiplex immunohistochemistry staining of primary melanoma tumor with ILC2 infiltration (left, scale bar 50 μm). Inset, magnified tumor infiltrated ILC2 is shown (scale bar, 10 μm). ILC2 were identified as CD45+CD3-GATA3+. Density and frequency of ILC2 in primary melanoma tumors (right). d, Frequency of NK cells, ILC1, ILC2 and ILC3 in ten human melanoma metastatic tumors as identified using the gating strategy provided in Supplementary Fig. 4 by mass cytometry. Patient characteristics relating to c and d are detailed in Supplementary Table 1. a-d, Each circle represents one mouse or human sample and data show the mean ± s.e.m. a and b, Statistical analyses were performed using paired (a) or ANOVA with Tukey’s multiple comparison test (b). p-values are indicated.
Fig. 2
Fig. 2. ILC2-dependent anti-melanoma immunity.
a, C57BL/6J, Rag1–/– and Rag2–/–Il2rg–/– mice were inoculated with Ret tumor cells. Tumor growth curves (a, left panel), tumor size at day 13 post tumor inoculation (a, middle panel) and survival (a, right panel) are shown. Data pooled from 3-4 independent experiments with 4-7 mice/group/experiment (C57BL/6J, n=24 mice; Rag1–/–, n=25 mice; Rag2–/–Il2rg–/–, n=15 mice). b, Tumor growth curves (left panel) and tumor size at day 14 (right panel) in NKp46iCre/+Mcl1+/+ control and NKp46iCre/+Mcl1 Δ/Δ mice inoculated with Ret tumor cells. Data pooled from 2 independent experiments (NKp46iCre/+Mcl1+/+, n = 9; NKp46iCre/+Mcl1Δ/Δ, n = 5; 2-7 mice/genotype/experiment). c, Tumor growth curves (left panel) and tumor size at day 17 (right panel) in Rorct)GFP/+ → Ly5.1+/+ and Rorct)GFP/GFP → Ly5.1+/+ bone marrow chimeric mice inoculated with Ret tumor cells 6-8 weeks after reconstitution of the hematopoietic compartment. Data pooled from 2 independent experiments (Rorct)GFP/+ → Ly5.1+/+, n=12 mice; Rorct)GFP/GFP → Ly5.1+/+, n=12 mice; 6 mice/genotype/experiment). d, Tumor growth curves (left panel) and day 12 tumor size (right panel) in Il7r+/+Rorafl/fl littermate control and Il7rCre/+RoraΔ/Δ mice inoculated with Ret tumor cells. Data pooled from 3 independent experiments (Il7r+/+Rorafl/fl, n = 11; Il7rCre/+RoraΔ/Δ, n = 21; 2-12 mice/genotype/experiment). e, Tumor growth curves (upper panels) and day 12-13 tumor size (lower panel) of Ret tumor cells injected in C57BL/6J, Rag1–/– mice and Rag2–/–Il2rg–/– mice, or Rag2–/–Il2rg–/– recipients reconstituted for 6 to 10 weeks with purified bone marrow-derived ILC2p (2-2.5×10³ cells/mouse), αLP (2-3×10³ cells/mouse) or CLP (5×10³ cells/mouse). Data are pooled from 4 independent experiments (C57BL/6J, n=24 mice; Rag1–/–, n=22 mice; Rag2–/–Il2rg–/–, n=11 mice; Rag2–/–Il2rg–/– + ILC2p, n=20 mice; Rag2–/–Il2rg–/– + αLP, n=18 mice; Rag2–/–Il2rg–/– + CLP, n=12 mice; 2-8 mice/group/experiment). a-e, Each circle represents one mouse and data show the mean+s.e.m. Tumor growth (a-d, left and e, upper), cross-sectional (a-d, right and e, lower), and survival (a, right) statistical analyses were performed using TumGrowth. p-values are indicated.
Fig. 3
Fig. 3. GM-CSF-expressing ILC2 mediate anti-melanoma responses.
a and b, Single cell RNA sequencing of 2,261 tumor-infiltrating leukocytes from BRAFCA;PTENloxp;Tyr::CreERT2 tumors collected 48 days after treatment with tamoxifen. a, t-Distributed stochastic neighbor embedding (t-SNE) plots showing immune cell subsets colored by population. b, Selected differentially expressed genes coding cytokines and soluble factors (y-axis) grouped according to T cell and ILC subsets (x-axis) as in a. Dot size represents the fraction, color indicates z-scaled gene expression, of cells within the population that express each gene. c and d, Frequency of ILC2-producing IL-5 (c, left), IL-13 (c, middle) and GM-CSF (c, right) and polyfunctional GM-CSF+IL-5+IL-13+ ILC2 (d) isolated from lung and Ret tumors of C57BL/6J mice at day 7 post-tumor inoculation. ILC2 were identified as CD45+CD3-TCRβ-NK1.1-CD11b-RORγt-GATA3+. Single cell suspensions of stimulated lung- and tumor-digested samples were stained intracellularly for IL-5, IL-13 and GM-CSF. Data are pooled from 2 independent experiments (n=6 mice/group/experiment). e and f, Ret tumor growth in e, C57BL/6J and Csf2–/– (GM-CSF–/–) mice and f, C57BL/6J, Rag1–/– mice and Rag2–/–Il2rg–/– mice, or Rag2–/–Il2rg–/– recipients reconstituted for 8 weeks with purified bone marrow-derived ILC2p (2.5×10³ cells/mouse) isolated from GM-CSF deficient (Csf2–/–) and wildtype (WT) control mice. Data are pooled from e, 3 independent experiments (C57BL/6J, n=16 mice and Csf2–/–, n=17 mice; 4-7 mice/genotype/experiment); f, 2 independent experiments (C57BL/6J, n=6 mice; Rag1–/–, n=12 mice; Rag2–/–Il2rg–/–, n=6 mice; Rag2–/–Il2rg–/– + WT ILC2p, n=10 mice; Rag2–/–Il2rg–/– + Csf2–/– ILC2p, n=7 mice; 2-6 mice/group/experiment) with the exception of C57BL/6J control mice which represents 1 experiment. Statistical analyses were performed by using TumGrowth. c-f, Each dot shows one mouse and data show the mean ± s.e.m. c, d and g, Statistical analyses were performed using paired Student’s t test (c and d) or unpaired Student’s t test (g). p-values are indicated.
Fig. 4
Fig. 4. ILC2-driven eosinophil recruitment control melanoma anti-tumor immunity.
a and b, Frequency of circulating dendritic cells, monocytes and neutrophils (a), and eosinophils (b) in Rag1–/– (n=12), Rag2–/–Il2rg–/– (n=5) and Rag2–/–Il2rg–/– (n=9) mice reconstituted with ILC2 progenitors and analyzed at 3, 4, 5 and 6 wks after transfer. Data pooled from 2 independent experiments (2-6 mice/group/experiment). c to e, Eosinophil infiltration of tumors in ILC2p-reconstituted Rag2–/–Il2rg–/–. c, Flow cytometric plots of tumor-infiltrating eosinophils and neutrophils in C57BL/6J, Rag1–/–, Rag2–/–Il2rg–/– and progenitor-reconstituted Rag2–/–Il2rg–/– mice 12-13 days after Ret tumor cell inoculation. d, Enumeration of tumor-infiltrating immune cells from C57BL/6J (n=12), Rag1–/– (n=10), Rag2–/–Il2rg–/– (n=5), Rag2–/–Il2rg–/–+ILC2p (n=6), Rag2–/–Il2rg–/–+αLP (n=4), and Rag2–/– Il2rg–/–+cLP (n=6) mice as in c. e, Eosinophil frequency relative to melanoma tumor weight (g). Individual mice are colored by experimental group; linear regression curve is overlaid. Correlation assessed using non-parametric Spearman’s correlation test. Data show representative plots (c) or are pooled from 2 independent experiments (n=2-6 mice/group/experiment) (d and e). f, Cumulative tumor growth (left panel) and tumor size (day 16, right panel) in C57BL/6J and PHIL mice inoculated with Ret tumor cells. Data pooled from 3 independent experiments (C57BL/6J, n=14 mice;PHIL, n=12 mice; 2-8 mice/genotype/experiment). Statistical analyses were performed by using TumGrowth. g, Quantitation and h, hematoxylin and eosin staining of B16-F10 melanoma lung metastasis (day 16) and lung tumor burden (right panel) in wild-type and eosinophil-deficient ΔdblGata mice. Data pooled from 2 independent experiments (g, C57BL/6J, n= 16 mice; ΔdblGata, n=12 mice; h, C57BL/6J, n= 8 mice; ΔdblGata, n=7 mice) and show the mean ± s.e.m. b and d-i, Each dot represents one mouse (b, d-h). Statistical analyses were performed using ANOVA followed by Tukey’s multiple comparison test (b), unpaired Student’s t tests (Rag2–/–Il2rg–/– versus Rag2–/–Il2rg–/–+ILC2p) (d), or unpaired Student’s t tests (g and h). p-values are indicated. Data are shown as the mean ± s.e.m.
Fig. 5
Fig. 5. ILC2-derived GM-CSF control eosinophil homeostasis, survival and effector functions.
a, Frequency of dendritic cells (DC, CD45+CD3ε-CD19-CD11b+CD11chiMHC class IIhi) and monocytes (CD45+CD3ε-CD19-CD11b+Siglec-F-Ly6G-Ly6ChiCD64+/-). b, Flow cytometric contour plots (upper panels)_and frequency (lower panels) of neutrophils (CD45+CD3ε-CD19-CD11b+Siglec-F-Ly6G+) and eosinophils (CD45+CD3ε-CD19-CD11b+ Ly6G -SiglecF+) from Rag1–/–, Rag2–/–Il2rg–/– and Rag2–/–Il2rg–/– mice reconstituted with ILC2 progenitors (ILC2p, 2.5×10³ cells/mouse) from GM-CSF deficient (Csf2–/–) and wildtype (WT) control mice analyzed 7 weeks after transfer of ILC2p. Data pooled from 2 independent experiments (Rag1–/–, n=12 mice; Rag2–/–Il2rg–/–, n=9 mice; Rag2–/– γc–/– + WT ILC2p, n=10 mice; Rag2–/– Il2rg–/– + Csf2–/– ILC2p, n=11 mice; 4-6 mice/group/experiment). c, Quantitative Gata2, Epx, Ear1 and Ear2 expression normalized to Gapdh in splenic eosinophils cultured overnight in complete media, or complete media + ILC2-conditioned media (ratio 1:1) (n=6 mice/experiment. Each dot represents one biological or technical replicate. Data pooled from 2 independent experiments with 1-4 biological or technical replicates/genotype/experiment. d, Effect of GM-CSF on eosinophil survival. Peritoneal eosinophils from IL-5Tg mice were cultured (40 × 103/well, in triplicate) in serum free media with or without increasing concentrations of GM-CSF or complete media for 16 hours and dead cells (Propidium Iodide+) was quantitated using IncucyteZOOM live imaging. Data show one representative experiment out of 2 performed with technical replicates. a-c, Each dot represents one mouse sample. a-d, Statistical analyses were performed using ANOVA followed by Tukey’s multiple comparison test (a and b; Rag2–/–Il2rg–/– vs Rag2–/–Il2rg–/– + WT ILC2p vs Rag2–/– Il2rg–/– + Csf2–/– ILC2p), unpaired Student’s t tests (complete media supplemented with wild-type versus Csf2–/– ILC2 conditioned media) (c), or two-way ANOVA followed by Dunnett’s multiple comparison test (d). p-values are indicated. Results are shown as the mean ± s.e.m.
Fig. 6
Fig. 6. Melanoma-infiltrating ILC2 express high levels of PD-1.
a, Single cell RNA sequencing analyses of tumor-infiltrating leukocytes purified from BRAFCA;PTENloxp;Tyr::CreERT2 tamoxifen-induced tumors showing differentially expressed genes coding for selected immune checkpoint and costimulatory molecules (y-axis) grouped according to T cell and ILC subsets (x-axis) as identified in Fig. 3a. b, Flow cytometric contour plots (left panels) and frequency (right panel) of PD-1 expression on T cells and ILC2 isolated from BRAFCA;PTENloxp;Tyr::CreERT2 tumor-bearing mice. Data pooled from 5 independent experiments (n=29 tumors). c, Comparison of the frequency of PD-1+ ILC2 relative to PD-1+ T cells. Data show individual values from 5 independent experiments (n=29 tumors). d, Flow cytometric contour plots (left panels) and frequency (right panel) of PD-1 expression on CD8+ T cells and ILC2 from Ret tumor-bearing C57BL/6J mice at day 7 and day 17 post tumor inoculation. Data pooled from 2 independent experiments with 4-6 mice/experiment/time-point (day 7, n=8 mice; day 17, n=12 mice). e, Comparison of the frequency of PD-1+ILC2 relative to PD-1+CD8+T cells. Data show individual values on day 7 and day 17 (n=20 tumors). f-i, Multiplex immunohistochemistry staining of human primary melanoma tumor. f, Immunohistochemistry staining of PD-1 and PD-L1 (scale bar, 50 μm). Inset, tumor-infiltrated PD-1+ILC2 interacting with PD-L1+cells (scale bar, 10 μm). Singlet immunostaining from the composite image (scale bar 50 μm). g, Frequency of PD-1-expressing T cells (CD45+CD3+PD-1+, n=18) and ILC2 (CD45+CD3-GATA3+PD-1+, n=10) in primary melanoma tumors. h, Comparison of the frequency of PD-1+ ILC2 relative to PD-1+ T cells. i, Comparison of the frequency of PD-1+ T cells or PD-1+ILC2 relative to PD-L1+ melanoma cells (SOX10+PD-L1+). b-e and g-i, Each dot represents one mouse (b-e) or human sample (g-i). b, d and g, Data show mean ± s.e.m. c, e, h and i, Correlations were assessed using non-parametric Spearman’s correlation test. The linear regression curves were overlaid. Spearman’s Rho (rs) and p-values are indicated.
Fig. 7
Fig. 7. PD-1 expression inhibits tumor ILC2 infiltration and ILC2-dependent anti-tumor functions.
a, Cumulative tumor growth (left panel) and tumor size (day 15-16, right panel) in C57BL/6J and Pdcd1–/– mice inoculated intradermally with Ret tumor cells. Data pooled from three independent experiments (C57BL/6J, n=26 mice; Pdcd1–/–, n=20 mice) with 6-11 mice per experiment/group. b-d, Enumeration of T cells (CD45+CD3+TCRb+), ILC2 (CD45+CD3-TCRb-NK1.1-CD11b-RORγt-GATA3+, b and c) and ILC2-cytokine producing cells (d) in tumors (b) and tumor draining lymph nodes (tdLN) (c and d) from C57BL/6J and Pdcd1–/– mice at day 7 following 4hr in vitro stimulation. Data pooled from 2 independent experiments (n=12-10 mice/genotype) with 5-6 mice per experiment/genotype. e-g, C57BL/6J (Ly5.1+Ly5.2+) → Ly5.1, Pdcd1–/– (Ly5.2+) → Ly5.1 or mixed (ratio 1:1) of C57BL/6J:Pdcd1–/– → Ly5.1 bone marrow chimeras were injected with Ret tumor cells 6 weeks after reconstitution. e, Experimental design. f, Tumor growth (left) and tumor size (day 18, right). Data pooled from 2-3 independent experiments (C57BL/6J, n=9 mice; Pdcd1–/–, n=10; C57BL/6J:Pdcd1–/–, n=15) with 3-6 mice/group/experiment. g, Frequency of CD8+ T cells (left) and ILC2 among bone marrow-derived cells in the spleen, LN and tumor. Data show one experiment (n=6 mice). h, Ret tumor growth in C57BL/6J, Rag1–/– mice and Rag2–/–Il2rg–/– mice, or Rag2–/–Il2rg–/– mice reconstituted with wildtype (WT) or Pdcd1–/– purified bone marrow-derived ILC2p six weeks prior to injection. Data show one experiment (C57BL/6J, n=6 mice ; Rag1–/–, n=6 mice; Ragc–/–Il2rg–/–, n=3 mice; Rag2–/–Il2r–/– + wildtype ILC2p, n=5 mice; Rag2–/–Il2rg–/– + Pdcd1–/– ILC2p, n=5 mice). (a-d, f and g) Each circle represents one mouse. (a-d,f-h) Data show mean ± s.e.m. (b-d) Statistical analyses were performed using unpaired Student’s t-test. (a and f) Tumor growth statistical analyses were performed using TumGrowth. p-values are indicated.
Fig. 8
Fig. 8. IL-33 combined with anti-PD-1 antibody unleashes anti-melanoma immunity mediated by the ILC2-eosinophil axis.
a-m, Ret tumor-bearing C57BL/6J mice treated with rmIL-33, anti-PD-1 antibody, rmIL-33 + anti-PD-1 or control (PBS and isotype antibody). a, Experimental design. b, Tumor growth and c, Individual tumors (day 15, scale bar, 10 mm). d-m, Immunological analyses at day 15. d, Contour plots showing ILC2 isolated from the tumors. e,f, Enumeration of total ILC2 (e) and KLRG1+ ILC2 (f) in tumors (left panels) and spleens (right panels). g, Heatmaps showing the log2 mean fold change in cell number for immune cell subsets between treatment and control group in tumors, spleen, contralateral (cLN) and tumor-draining (tdLN) lymph nodes of injected mice. *statistical significance between experimental and control groups. h, Frequency of proliferating (Ki67+) KLRG1+ ILC2. i, Flow cytometric contour plots of eosinophils (Siglec-F+Ly6G-) and neutrophils (Siglec-F-Ly6G+) from tumors (upper panels) and spleen (lower panels) resident (rEos, Siglec-F+) and inflammatory (iEos, Siglec-Fhi) eosinophils. j, Enumeration of eosinophils on day 15 post Ret tumor cell inoculation. k, Enumeration of rEos (left panel) and iEos (right panel). l, Heatmaps showing log2 mean fold change in cell number between treatment groups and control groups of immune populations (left axis) of treated mice. Statistical significance between experimental and control groups are shown. m, Frequency of tumor ILC2 and eosinophils relative to melanoma tumor weight (g). Individual data points are colored by group. b,e,f,h,j and k, Data show the mean ± s.e.m. b,e,f,h,j,k and m, Each dot shows one mouse. b-m, Data are pooled from 4 independent experiments (Control, n=21; Anti-PD-1, n=23; rIL-33, n=23; Anti-PD-1+rIL-33, n=22) (b), 2 independent experiments (Control, n=11; Anti-PD-1, n=11-12; rIL-33, n=11; Anti-PD-1+rIL-33, n=9-11) (e-h, and j-l) or represents one experiment (d,i, and m) with 4-6 mice/experimental group/experiment. b, Tumor growth statistical analyses were performed using TumGrowth. e,f,h,j,k, Statistical analyses were performed using a Student’s t-test (h) or ANOVA with Tukey’s multiple comparison test (e,f,j,k,g,l). m, Correlations were assessed using non-parametric Spearman’s correlation test. Linear regression curves were overlaid. Spearman’s Rho (rs) and p-values are indicated. g, k, * p<0.05; ** p<0.01; *** p<0.01; and **** p<0.0001.

Comment in

  • ILC2s in cancer: context matters.
    Bruchard M, Ghiringhelli F. Bruchard M, et al. Nat Immunol. 2021 Jul;22(7):804-806. doi: 10.1038/s41590-021-00945-x. Nat Immunol. 2021. PMID: 34099921 No abstract available.

References

    1. Park SL, et al. Tissue-resident memory CD8(+) T cells promote melanoma-immune equilibrium in skin. Nature. 2019;565:366–371. - PubMed
    1. Gebhardt T, Palendira U, Tscharke DC, Bedoui S. Tissue-resident memory T cells in tissue homeostasis, persistent infection, and cancer surveillance. Immunol Rev. 2018;283:54–76. - PubMed
    1. Bruggen MC, et al. In Situ Mapping of Innate Lymphoid Cells in Human Skin: Evidence for Remarkable Differences between Normal and Inflamed Skin. J Invest Dermatol. 2016;136:2396–2405. - PubMed
    1. Salimi M, et al. Activated innate lymphoid cell populations accumulate in human tumour tissues. BMC Cancer. 2018;18:341. - PMC - PubMed
    1. Bie Q, et al. Polarization of ILC2s in peripheral blood might contribute to immunosuppressive microenvironment in patients with gastric cancer. J Immunol Res. 2014;2014:923135. - PMC - PubMed

Publication types

MeSH terms