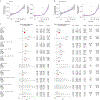
Hematopoietic mosaic chromosomal alterations increase the risk for diverse types of infection

Seyedeh M Zekavat et al. Nat Med. 2021 Jun.

Abstract

Age is the dominant risk factor for infectious diseases, but the mechanisms linking age to infectious disease risk are incompletely understood. Age-related mosaic chromosomal alterations (mCAs) detected from genotyping of blood-derived DNA, are structural somatic variants indicative of clonal hematopoiesis, and are associated with aberrant leukocyte cell counts, hematological malignancy, and mortality. Here, we show that mCAs predispose to diverse types of infections. We analyzed mCAs from 768,762 individuals without hematological cancer at the time of DNA acquisition across five biobanks. Expanded autosomal mCAs were associated with diverse incident infections (hazard ratio (HR) 1.25; 95% confidence interval (CI) = 1.15-1.36; P = 1.8 × 10⁻⁷), including sepsis (HR 2.68; 95% CI = 2.25-3.19; P = 3.1 × 10⁻²⁸), pneumonia (HR 1.76; 95% CI = 1.53-2.03; P = 2.3 × 10⁻¹⁵), digestive system infections (HR 1.51; 95% CI = 1.32-1.73; P = 2.2 × 10⁻⁹) and genitourinary infections (HR 1.25; 95% CI = 1.11-1.41; P = 3.7 × 10⁻⁴). A genome-wide association study of expanded mCAs identified 63 loci, which were enriched at transcriptional regulatory sites for immune cells. These results suggest that mCAs are a marker of impaired immunity and confer increased predisposition to infections.


Figures

Extended Data Fig. 1
Extended Data Fig. 1. mCA calls by chromosome.
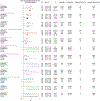
mCA calls by chromosome in the a) MGBB b) FinnGen, and c) CUB. CN-LOH = copy neutral loss of heterozygosity, CUB=Columbia University Biobank, MGBB=Mass-General Brigham Biobank
Extended Data Fig. 2
Extended Data Fig. 2. Visualization of the diverse range of expanded autosomal mCAs detected across the genome among individuals with a. incident sepsis and b. incident pneumonia in the UKB.
Each point represents one mCA carried by a case, with the x-axis as the chromosome, y-axis as the mCA size in mega-bases of DNA (MB), color as the copy change, and size of the point as the cell fraction of that mCA. CNN-LOH=copy number neutral loss of heterozygosity, MB = megabases of DNA, mCA = mosaic chromosomal alterations
Extended Data Fig. 3
Extended Data Fig. 3. Suggestive associations (P<0.05) of expanded autosomal mCAs with specific incident infections by Cox proportional-hazards models.
Analyses are adjusted for age, age2, sex, smoking status, and principal components 1–10 of ancestry. Bonferroni correction was used to determine the level of statistical significance (0.05/20 or P<0.0025). Overall estimates across studies are generated via fixed effect meta-analysis. Error bars show 95% confidence intervals. mCA = mosaic chromosomal alterations.
Extended Data Fig. 4
Extended Data Fig. 4. Associations of a) expanded ChrY and b) expanded ChrX mCAs with incident infections.
Both panels employ Cox proportional-hazards model adjusting for age, age2, sex, smoking status, and principal components 1–10 of ancestry. Error bars show 95% confidence intervals. Bonferroni correction was used to determine the level of statistical significance for each mCA category (P<0.005). mCA = mosaic chromosomal alterations.
Extended Data Fig. 5
Extended Data Fig. 5. Suggestive associations (P<0.05) of mCAs with incident infection-related mortality in Biobank Japan
Associations of autosomal mCAs with a) organ-system level infections and b) specific infection categories. c) Association of expanded autosomal mCAs with Sepsis. All panels employ Cox proportional-hazards model adjusting for age, age2, sex, smoking status, and principal components 1–10 of ancestry. Error bars show 95% confidence intervals. Bonferroni correction was used to determine the level of statistical significance. Full results are in Supplementary Table 6. Associations are presented among individuals without any cancer history. mCA = mosaic chromosomal alterations.
Extended Data Fig. 6
Extended Data Fig. 6. Incidence rate of at risk population developing each disease (N=445,101 UKB participants).
95% confidence intervals were calculated based on normal approximation. mCA = mosaic chromosomal alterations
Extended Data Fig. 7
Extended Data Fig. 7. Associations of expanded mCAs in the UK Biobank with COVID-19 and incident pneumonia.
Associations of expanded mCAs with a. COVID-19 hospitalization across different adjustment models, and b. different COVID-19 phenotypes in fully adjusted logistic regression models. Adjustment models include 1) an unadjusted model, 2) a sparsely adjusted model which adjusts for age, age2, sex, smoking status, and principal components of ancestry, and 3) a fully adjusted model which additionally adjusts for Townsend deprivation index, BMI, and the following comorbidities: Asthma, COPD, CAD, T2D, any cancer, and HTN. Bonferroni correction was used to determine the level of statistical significance. mCA = mosaic chromosomal alterations, COPD = chronic obstructive pulmonary disease, CAD = coronary artery disease, T2D = type 2 diabetes mellitus. c. Association of expanded mCAs with incident pneumonia stratified by sex, adjusted for age, age2, sex (in the All model only), smoking status, and principal components of ancestry. Error bars show 95% confidence intervals. mCA = mosaic chromosomal alterations
Extended Data Fig. 8
Extended Data Fig. 8. Correlated associations of 63 independent genome-wide significant variants associated with expanded mCAs between different mCA categories in the UKB.
Bonferroni correction was used to determine the level of statistical significance for the correlation analyses (P<0.05/6=0.0083). Across all panels except for panel (a), the labeled genes represent genes attributed to variants that have P<0.05 across the mCA categories in both axes. mCA = mosaic chromosomal alterations, rp = Pearson correlation
Extended Data Fig. 9
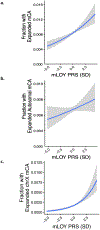
Extended Data Fig. 9. Association of a mLOY PRS consisting of 156 previously identified independent genome-wide significant variants associated with mLOY, with different expanded mCA categories in UKB Females.
Error bands were derived from binomial proportion 95% confidence intervals. mCA = mosaic chromosomal alterations, mLOY = mosaic Loss-of-chromosome Y, PRS = polygenic risk score
Extended Data Fig. 10
Extended Data Fig. 10. Pathway enrichment of TWAS results using the Elsevier Pathways.
a. Top results from pathway enrichment analysis of the TWAS results using the Elsevier Pathways. b. Highlighting the GWAS locus-zoom plots for some of the TWAS genes implicated in the top pathways from panel a. Red boxes highlight the gene(s) with strongest association in the TWAS analyses. GWAS = genome-wide association study, TWAS = transcriptome-wide association study
Figure 1:
Figure 1:
Study schematic. a. Genome-wide mCAs were detected across the UKB, MGBB (via the MoChA pipeline), FinnGen (via the MoChA pipeline), BBJ, and CUB. Association of expanded mCAs (cell fraction >10%) with incident infectious diseases in UKB, MGBB, and FinnGen, with incident infectious disease mortality in BBJ, and with COVID-19 severity among COVID-19 positive cases in the CUB, was performed. A GWAS for expanded mCAs was then performed in the UKB to discover causal factors for expanded mCAs. Using the GWAS results, cell-specific functional enrichment analyses were performed using GenoSkyline-Plus, which combines epigenetic and transcriptomic annotations with GWAS summary statistics to estimate the relative contribution of cell-specific functional markers to the GWAS results. Additionally, to prioritize putative causal genes and pathways promoting the development of expanded mCAs, whole blood TWAS was performed using UTMOST via GTEx v8. Association of b. all expanded mCAs with cell fraction >10%, and c. all expanded autosomal mCAs, with age using 5-year age bins stratified by sex among individuals in the UKB, MGBB, FinnGen, and BBJ combined. Error bands were derived from binomial proportion 95% confidence intervals. Plots by cohort and across other mCA groupings are available in Supplementary Figure 8, 9. BBJ = BioBank Japan, CUB = Columbia University Biobank, GTEx v8 = Genotype-Tissue Expression project version 8, GWAS=genome-wide association study, MGBB = Mass General Brigham Biobank, mCA = mosaic chromosomal alterations, MoChA = Mosaic Chromosomal Alterations software (https://github.com/freeseek/mocha), TWAS = transcriptome-wide association study, UKB = UK Biobank, UTMOST = Unified Test for MOlecular SignaTures.
Figure 2:
Figure 2:
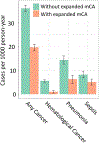
Associations of mCAs with hematologic traits. a. Linear regression is employed to explore the association between blood counts and expanded mCAs. Associations are adjusted for age, age2, sex, smoking status, and principal components of ancestry. Error bars show the 95% confidence interval for estimates. Bonferroni correction was used to determine the level of statistical significance. b. Relationship of mCA cell fraction with blood counts (in units of 10^9 cells/L) in the UKB among individuals without prevalent hematologic cancer at time of blood draw for genotyping and cell count measurement. The dotted horizontal lines reflect the mean blood count for individuals without an mCA. The dotted vertical lines at cell fraction of 0.10 represents the cutoff for the expanded mCA definition. Individuals with known hematologic cancer at time of or prior to blood draw for genotyping were excluded. Error bands were derived from binomial proportion 95% confidence intervals. c. Association of expanded mCA categories (with cell fraction>10%) with incident cancer in the UK Biobank. Analyses are adjusted for age, age2, sex, smoking status, and principal components of ancestry. Individuals with a history of hematologic cancer at enrollment were removed from analysis. Error bands were derived from binomial proportion 95% confidence intervals. d. Association of expanded mCA categories (with cell fraction>10%) with incident cancer in the UK Biobank is accessed by Cox proportional-hazards model with time-on-study as the underlying time scale. Analyses are adjusted for age, age2, sex, smoking status, and principal components of ancestry. Error bars show the 95% confidence interval for estimates. Bonferroni correction was used to determine the level of statistical significance. Individuals with a history of hematologic cancer at enrollment were removed from analysis. CLL = chronic lymphocytic leukemia, MPN = myeloproliforative neoplasm, mCA = mosaic chromosomal alterations
Figure 3:
Figure 3:
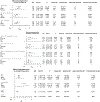
Associations of expanded mCAs with incident infections. Visualizing the dependence with cell fraction among a. all mCAs, and b. autosomal mCAs, of any incident infection and incident sepsis in the UKB among individuals without prevalent hematologic cancer at time of blood draw for genotyping across. The dotted vertical lines at cell fraction of 0.10 represents the cutoff for the expanded mCA definition. Error bands were derived from binomial proportion 95% confidence intervals. c. Association of all expanded mCAs, and separately, expanded autosomal mCAs with incident infections across individuals in the UKB, MGBB, and FinnGen by Cox proportional-hazards models with the underlying time scale of time-on-study. Analyses are adjusted for age, age2, sex, smoking status, and principal components 1–10 of ancestry. Error bars show the 95% confidence interval for estimates. Bonferroni correction was used to determine the level of statistical significance. Individuals with prevalent hematologic cancer were excluded from analysis. Association analyses for other groupings of mCAs (including across all mCAs regardless of cell fraction, as well as chrX and chrY mCAs are provided in Supplementary Figures 11, 12). BBJ = BioBank Japan, MGBB = Mass General Brigham Biobank, mCA = mosaic chromosomal alterations, UKB = UK Biobank
Figure 4:
Figure 4:
Association of expanded autosomal mCAs and incident infections, stratified by antecedent cancer history. a. Association of expanded autosomal mCAs with incident infections across individuals with and without a cancer history before their incident infection, meta-analyzed across UKB, MGBB, and FinnGen combined (cohort-specific analyses are available in Supplementary Figure 14) assuming a fixed effect. Error bars show the 95% confidence interval for estimates. Bonferroni correction was used to determine the level of statistical significance. Individuals with known hematologic cancer at time of or prior to blood draw for genotyping were excluded. Analyses are adjusted for age, age2, sex, smoking status, and principal components of ancestry. b. Cumulative incidence curves for various infections in UKB. Top: sepsis, middle: pneumonia, bottom: digestive system infection. Results from MGBB and FinnGen are available in Supplmentary Figure 16. Red: mCA+ Cancer+, Purple: mCA− Cancer+, Blue: mCA+ Cancer−, Green: mCA− cancer−. Individuals with known hematologic cancer at time of or prior to blood draw for genotyping were excluded.
Figure 5:
Figure 5:
Association of expanded mCAs with COVID-19 severity. a. Association of expanded mCAs with COVID-19 Hospitalization across the UKB and FinnGen determined by logistic regression. Error bars show the 95% confidence interval for estimates. Bonferroni correction was used to determine the level of statistical significance. Individuals with known hematologic cancer at time of or prior to blood draw for genotyping were excluded. Analyses are adjusted for age, age, sex, ever smoking status, and principal components of ancestry. b. Visualization of the diverse range of expanded autosomal mCAs detected across the genome among individuals hospitalized with COVID-19 in the UK Biobank. Each point represents one mCA carried by a case, with the x-axis as the chromosome, y-axis as the mCA size in mega-bases of DNA (MB). c. Proportion of expanded autosomal mCAs in each category of COVID-19 outcomes for the CUB COVID-19 cohort, defined using the WHO COVID-19 scale (n=871 participants). 95% binomial proportion confidence intervals are shown. The table below the bar chart shows the counts of expanded autosomal mCA carriers and non-carriers in each outcome category. In CUB, the adjusted association between expanded autosomal mCAs and these ordinal COVID-19 outcomes is evaluated by ordinal regression and has OR of 1.52 (CI 95% 1.04 to 2.21, P= 0.031, two-tailed); summary statistics for the covariates included in the adjusted model for CUB are in Supplementary Table 11. MGBB = Mass General Brigham Biobank, UKB = UK Biobank, MB=megabase, CNN-LOH = copy number neutral loss of heterozygosity, CUB = Columbia University Biobank, WHO = World Health Organization
Figure 6:
Figure 6:
Inherited risk factors for expanded mCAs: GWAS, TWAS, and Cell Type Enrichment. a. GWAS for expanded mCA identified 63 independent loci. b. Quantile-quantile plot of the whole blood TWAS of the expanded mCA GWAS using 670 samples from GTExv8 shows enrichment across 62 genes. The horizontal dotted line reflects the Bonferroni-adjusted p-value for significance. Genes with TWAS P<5×10⁻⁸ or those important in the pathway-enrichment analyses from Extended Data Figure 10 are labeled. c. cell-type enrichment results from the Expanded mCA GWAS across immune, brain, cardiovascular (CV), muscle, gastrointestinal (GI), epithelium, and other tissues as annotated using GenoSkyline-Plus annotations. d. Zooming in to show the stratified enrichment by specific categories of immune cells and tissues. Across panels C. and D., the vertical dotted lines indicate (1) P=0.05 for suggestive enrichment, and (2) the Bonferroni-adjusted P-value for significant enrichment. GWAS = genome wide association study, TWAS = transcriptome-wide association study, CV = cardiovascular, GI = Gastrointestinal

Update of

Comment in

References

    1. Gardner ID The effect of aging on susceptibility to infection. Rev Infect Dis 2, 801–810 (1980). - PubMed
    1. Gavazzi G & Krause KH Ageing and infection. Lancet Infect Dis 2, 659–666 (2002). - PubMed
    1. Aw D, Silva AB & Palmer DB Immunosenescence: emerging challenges for an ageing population. Immunology 120, 435–446 (2007). - PMC - PubMed
    1. Franceschi C, Bonafe M & Valensin S Human immunosenescence: the prevailing of innate immunity, the failing of clonotypic immunity, and the filling of immunological space. Vaccine 18, 1717–1720 (2000). - PubMed
    1. Ongradi J & Kovesdi V Factors that may impact on immunosenescence: an appraisal. Immun Ageing 7, 7 (2010). - PMC - PubMed

Publication types

MeSH terms

Supplementary concepts