. 2021 Jun 8;6(11):e147470.
doi: 10.1172/jci.insight.147470.

Optogenetic modulation of cardiac action potential properties may prevent arrhythmogenesis in short and long QT syndromes

Affiliations

Optogenetic modulation of cardiac action potential properties may prevent arrhythmogenesis in short and long QT syndromes

Amit Gruber et al. JCI Insight. .

Abstract

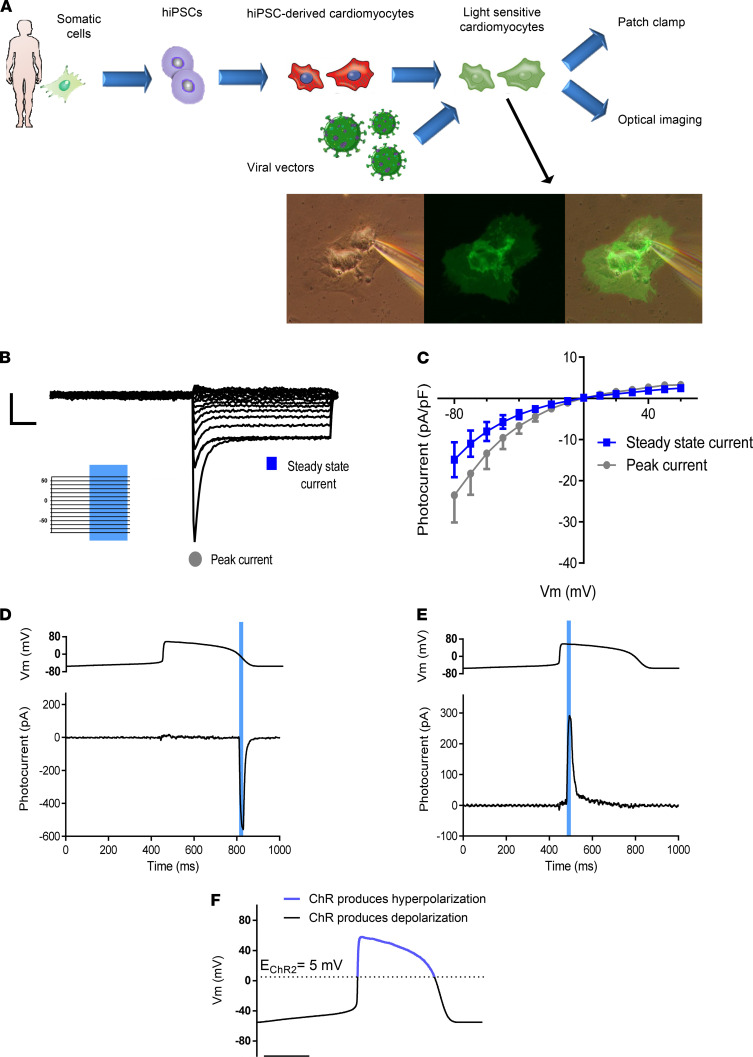
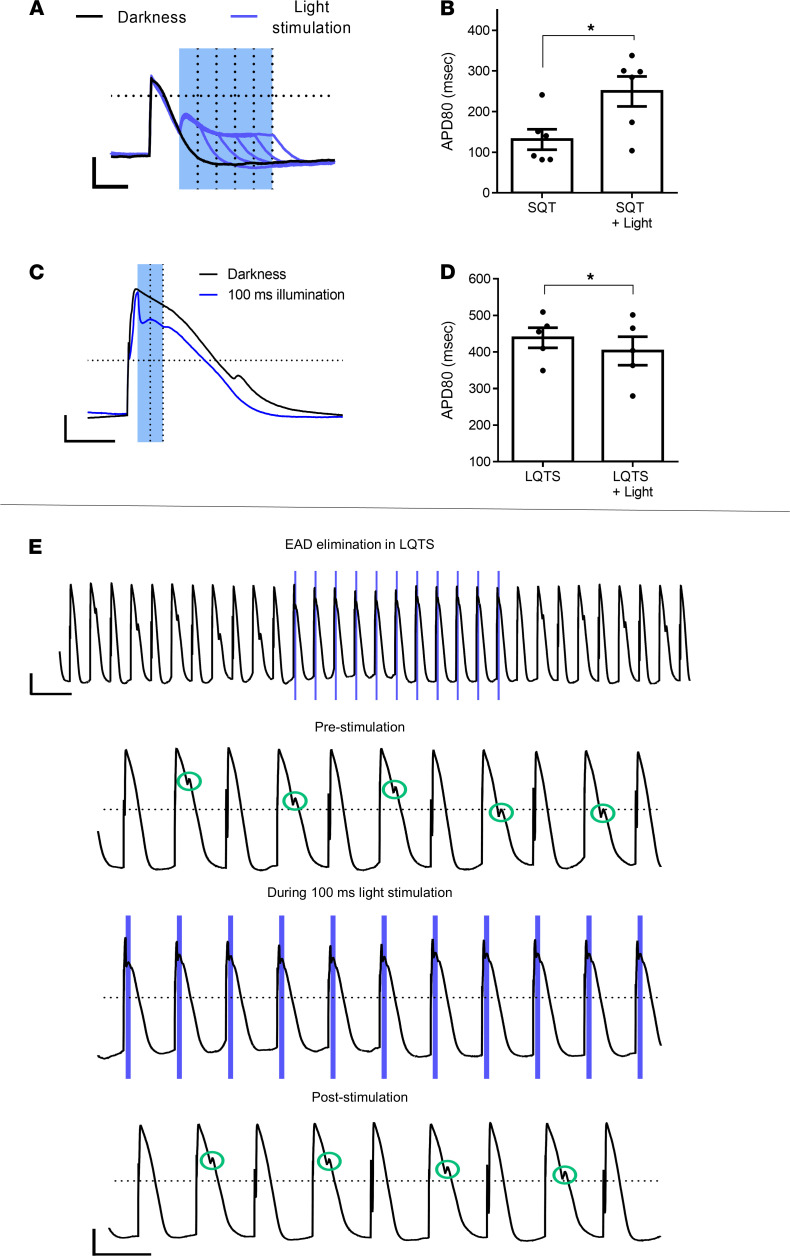
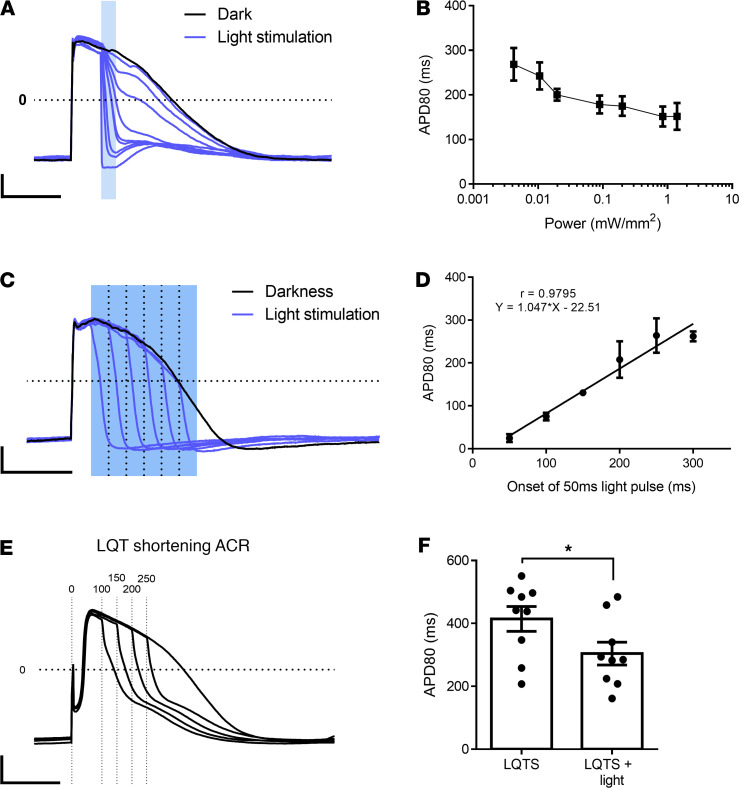
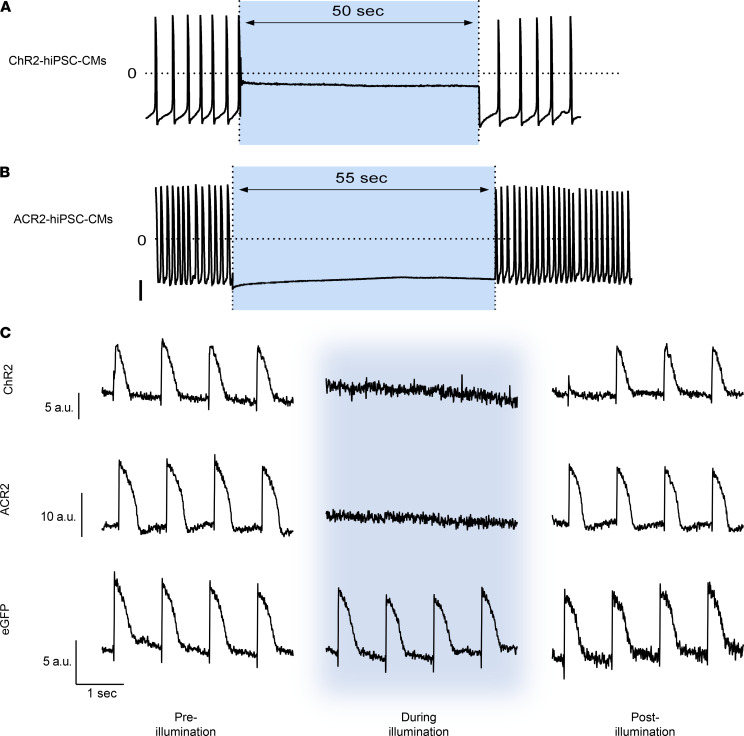
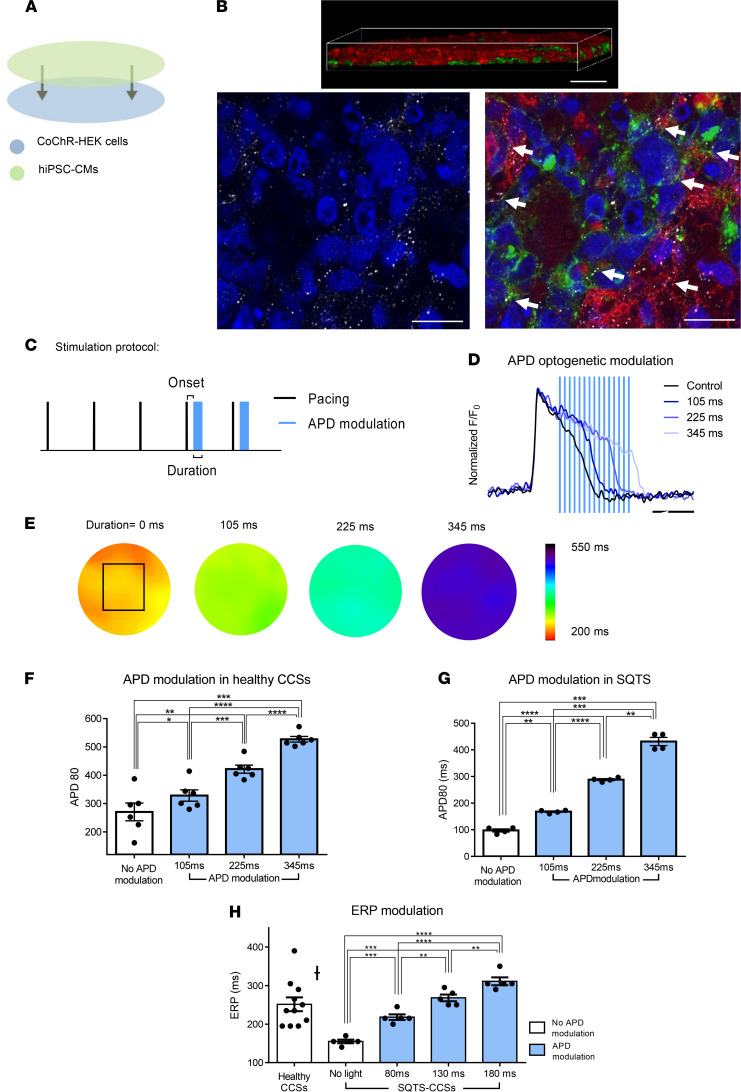
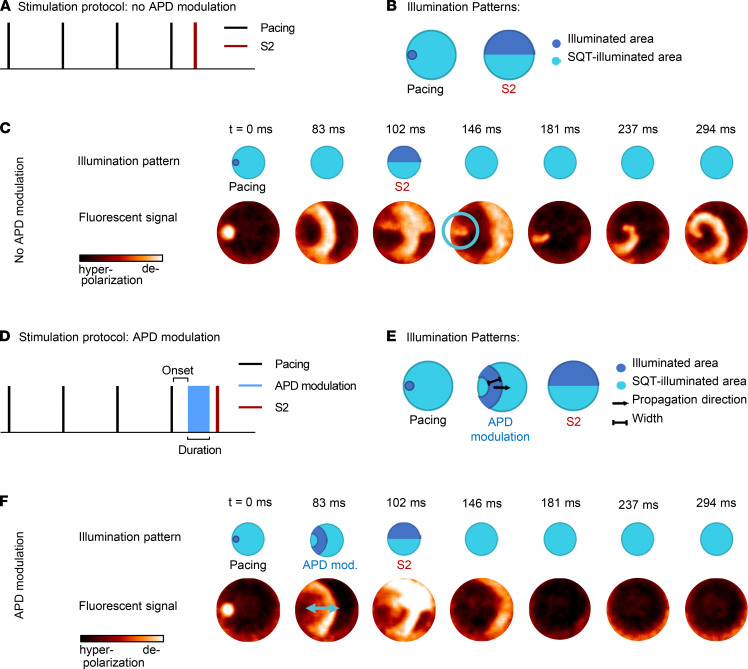
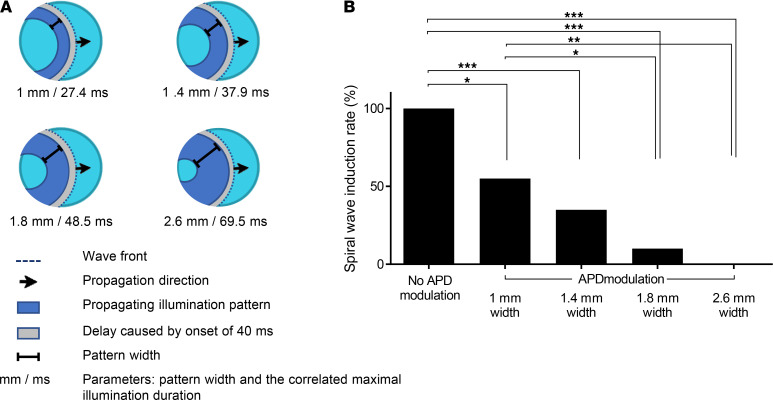
Abnormal action potential (AP) properties, as occurs in long or short QT syndromes (LQTS and SQTS, respectively), can cause life-threatening arrhythmias. Optogenetics strategies, utilizing light-sensitive proteins, have emerged as experimental platforms for cardiac pacing, resynchronization, and defibrillation. We tested the hypothesis that similar optogenetic tools can modulate the cardiomyocyte's AP properties, as a potentially novel antiarrhythmic strategy. Healthy control and LQTS/SQTS patient-specific human induced pluripotent stem cell-derived cardiomyocytes (hiPSC-CMs) were transduced to express the light-sensitive cationic channel channelrhodopsin-2 (ChR2) or the anionic-selective opsin, ACR2. Detailed patch-clamp, confocal-microscopy, and optical mapping studies evaluated the ability of spatiotemporally defined optogenetic protocols to modulate AP properties and prevent arrhythmogenesis in the hiPSC-CMs cell/tissue models. Depending on illumination timing, light-induced ChR2 activation induced robust prolongation or mild shortening of AP duration (APD), while ACR2 activation allowed effective APD shortening. Fine-tuning these approaches allowed for the normalization of pathological AP properties and suppression of arrhythmogenicity in the LQTS/SQTS hiPSC-CM cellular models. We next established a SQTS-hiPSC-CMs-based tissue model of reentrant-arrhythmias using optogenetic cross-field stimulation. An APD-modulating optogenetic protocol was then designed to dynamically prolong APD of the propagating wavefront, completely preventing arrhythmogenesis in this model. This work highlights the potential of optogenetics in studying repolarization abnormalities and in developing novel antiarrhythmic therapies.

Keywords: Arrhythmias; Cardiology; Gene therapy; Stem cells; iPS cells.


Conflict of interest statement

Conflict of interest: The authors have declared that no conflict of interest exists.

Figures

Figure 1
Figure 1. Experimental scheme and functional characterization of ChR2 photocurrents in hiPSC-CMs.
(A) Experimental outline: patient-specific or control hiPSCs are differentiated into cardiomyocytes, transduced to express the different opsins, and subjected to patch-clamp or optical imaging analysis. Total original magnification, ×28. (B) Representative traces showing 1 example of 7 similar voltage-clamp experiments in the ChR2-expressing hiPSC-CMs. Peak and steady-state photocurrents are shown. Scale bars: 100 pA and 100 ms on y and x axes, respectively. The stimulation protocol (insert) included voltage steps of 1 second (first 500 ms conducted in darkness followed by 500 ms of continuous blue light illumination) from –80 mV to 60 mV, with 10 mV increments. (C) Current-voltage relationship of the ChR2 photocurrents. Mean ± SEM of peak and steady state currents are plotted (n = 7). (D and E) Representative traces (from 5 experiments) describing the photocurrents evoked in the hiPSC-CMs by light-stimuli applied during phase 2 (D) or 3 (E) in the AP clamp experiments. The upper panel shows the voltage AP clamp protocol, while the lower panel depicts the measured photocurrents [after baseline (darkness) subtraction]. (F) The conceptual differences in the type of photocurrents generated by light-induced ChR2 activation during different AP phases. An optical stimulus will produce a hyperpolarizing current if the Vm is more positive than ChR2-ERev (early phase 2); whereas a depolarizing current will be generated if Vm is more negative than ChR2-ERev (repolarization phase). Scale bar: 200 ms.
Figure 2
Figure 2. Optogenetic APD modulation in ChR2-expressing hiPSC-CMs.
(A) Optogenetic protocols included 7 electrically stimulated APs at 1 Hz with delivery of optogenetic stimuli at a specific timing following the last electrical pacing stimulation (onset). (BD) Light-induced ChR2 activation during phase 3 prolongs APD in whole-cell current clamp recordings. (B) Representative AP traces acquired during darkness (black) and following different optogenetic stimuli (blue) of various durations (dashed lines). Note the tight correlation between optical stimulus duration and the resulting APD prolongation. (C) A plot depicting the correlation between the timings of the end of the optical stimuli and the resulting APD80 values. Both continuous (black circles) and pulsed (gray squares) illumination protocols resulted in high correlations (r = 0.99 and 0.99, n = 12; regression models are presented). (D) Comparison of continuous and pulsed (20 ms on/30 ms off) illumination effects showing similar APD prolongations. (EG) Early light-induced ChR2 activation shortens APD. (E) Representative AP traces from 9 experiments acquired during darkness (black) and with early optical stimuli of various durations (onset, 20 ms). (F) Comparing the effects achieved by varying optical stimulus durations (50 ms, 100 ms, and 150 ms, n = 9) on the relative APD80 shortening using both continuous (black) and pulsed (gray) stimulation protocols. Note that, due to the limited time window for APD shortening, the longest continuous illumination tested (150 ms) is significantly less. *P < 0.05 and **P < 0.01 using 2-way ANOVA test for repeated measurements, followed by post-hoc Tukey test. (G) Shortening of the measured APD80 values following early optogenetic stimulation (onset, 20 ms; duration, 100 ms) (*P < 0.05 using paired Student’s t test, n = 9). (H) Summary of the bidirectional APD modulating effects of ChR2 light activation as function of the timing and duration of the optical stimulus. Scale bars: 20 mV and 200 ms for the y and x axes, respectively (B, D, E, and H).
Figure 3
Figure 3. Optogenetic APD modulation in ChR2-expressing LQTS– and SQTS–hiPSC-CMs.
(A and B) Light-induced ChR2 activation during the repolarization phase prolonged APD of SQTS–hiPSC-CMs with the degree of APD prolongation correlating with illumination duration (A). Application of a 250 ms–long optical stimulus (onset = 80 ms) was able to significantly prolong APD80 (n = 6, P < 0.05 using paired t test) in the SQTS–hiPSC-CMs (B). (C and D) Light-induced ChR2 activation, early during the AP, could shorten the abnormally long APD of the LQTS–hiPSC-CMs (C). Scale bars: (A and C) 20 mV and 200 ms for the y and x axes, respectively. The degree of APD80 shortening achieved by the optimal stimulation protocol (onset, 40 ms; duration, 100 ms) was statistically significant (*P < 0.05, n = 5) using paired t test (D). (E) Light-induced ChR2 activation during early phase 2 of the AP phase suppresses EAD formation in LQTS–hiPSC-CMs. Shown are AP recordings from the LQTS–hiPSC-CMs at baseline (1 Hz electrical pacing), during the application of the illumination protocol (onset, 40 ms; duration, 100 ms) for each individual AP and following termination of illumination. The lower 3 panels present higher time resolution of the upper panel, showing the development of EADs at baseline in some paced beats; the suppression of EADs in all APs following illumination (blue lines); and resumption of arrhythmogenic activity following illumination termination. EADs are highlighted with green circles. Scale bars: 20 mV for the y axis, 2 seconds for the x axis of the upper panel, and 1 second for the 3 lower panels.
Figure 4
Figure 4. Optogenetic APD modulation in ACR2-expressing hiPSC-CMs.
(A and B) Intracellular recordings (A) and a summary plot (B) characterizing the changes in AP morphology and APD80 values of the ACR2–hiPSC-CMs as a function of the optical stimulus’ intensity (signal duration, 50ms; onset, 100ms). Scale bars: 20 mV and 200 ms for the y and x axes, respectively; n = 5. (C and D) Intracellular recordings (C) and a summary plot (D) characterizing changes in AP morphology and APD80 values of the ACR2–hiPSC-CMs as a function of the timing of the delivered stimulus (intensity, 1.3 mW/mm2; duration, 50 ms) onset. Note the clear correlation (Pearson’s correlation coefficient = 0.98, n = 5) between stimulus onset and APD80 shortening, with earlier onsets leading to shorter APD80 values. (E) Patch-clamp recordings showing robust shortening of the abnormally long APD values in LQTS–hiPSC-CMs following light-induced ACR2 activation. APD shortening inversely correlated with the onset of the optical stimulus (intensity, 1.3 mW/mm2; duration, 50 ms), which was initiated at 50, 100, 150, 200, or 250 ms after AP onset. (F) Summary of the effects of application of a 50 ms–long stimulus (intensity, 1.3 mW/mm2; onset, 100 ms) to the ACR2-expressing LQTS–hiPSC-CMs. Notice the significant shortening of APD80 values (n = 9, *P < 0.01 using paired t test).
Figure 5
Figure 5. Optogenetic protocols to suppress cardiomyocyte excitability.
(A and B) Whole-cell patch-clamp recordings from ChR2-expressing (A) or ACR2-expressing (B) hiPSC-CMs. Notice how continuous prolonged 1.3 mW/mm2 blue light illumination clamps membrane potential to either a depolarized (in the case of ChR2; A) or hyperpolarized (ACR2; B) potential and suppresses spontaneous AP generation. Scale bar: 40 mV. (C) Representative optical AP recording (using voltage-dye imaging), acquired during continuous electrical field stimulation (1 Hz) of hiPSC-CMs expressing either ChR2 (representing 7 experiments, top panel), ACR2 (representing 19 experiments, middle panel), or eGFP (representing 17 experiments, bottom panel). Note that prolonged illumination with 1.3 mW/mm2 blue light completely suppressed AP development in ChR2-expressing (top panel) and ACR2-expressing (middle panel) hiPSC-CMs. The same illumination protocol, however, did not affect control eGFP-expressing hiPSC-CMs (bottom panel). Illumination timing is represented in all tracings by the blue background.
Figure 6
Figure 6. Optogenetics-based APD modulation at the tissue level.
(A) Scheme describing the derivation of the in vitro coculture model. The hiPSC-derived cardiomyocyte cell sheets (hiPSC-CCSs) were seeded on top of a monolayer of CoChR-expressing HEK293 cells. (B) Confocal microscopy based 2D (bottom panels) and 3D reconstructed z-series (top panel) immunostainings of the cocultures. The hiPSC-CMs are identified as α-actinin+ cells (red) and engineered HEK293 cells by their eGFP expression (green). Gap junctions are indicated by the positive connexin 43 punctuate immunosignal (white) and indicated by arrows. Nuclei are counterstained with DAPI (blue). Scale bars: 50 mm (upper panel), 20 mm (lower panels). (C) Optogenetic-based APD modulation protocol. Both pacing (short flash [10 ms], black line) and APD (prolonged pulsed stimulus [100 ms], light-blue) modulation stimuli were achieved through diffuse light exposure of the culture. (D) Representative optical APs recordings (from 6 experiments) at baseline (black tracing) and during applications of the optogenetic APD modulating stimuli at variable durations (blue tracings). Note the correlation between the optical stimulus duration and the resulting APD prolongation. Scale bar: 200 ms. (E) Optical mapping–derived color-coded APD80 maps acquired at baseline (darkness, left) and during applications of the APD modulating signals (105, 225, and 345 ms). (F) Summary of changes in APD80 values at baseline (darkness) and following applications of the optogenetic stimuli in healthy control hiPSC–CCSs (n = 6; *P < 0.05, **P < 0.01, ***P < 0.001, ****P < 0.0001 using 1-way ANOVA for repeated measurements, followed by Tukey post hoc test). (G and H) Optogenetic-based modulations of APD80 (n = 4, G) and ERP (n = 5, H) values in the CoChR-SQTS–hiPSC-CCSs cocultures. Shown are baseline values and the effects of optogenetic stimuli of different durations (*P < 0.05, **P < 0.01, ***P < 0.001, ****P < 0.0001 using 1-way ANOVA for repeated measurements, followed by Tukey post hoc test). P < 0.01 using unpaired Student’s t test when comparing ERP values in SQTS versus healthy control hiPSC-CCS.
Figure 7
Figure 7. Dynamic optogenetic-based APD modulation for prevention of reentrant arrhythmias in the SQTS–hiPSC-CCS model.
(AC) Optogenetic cross-field protocol to induce spiral waves in the SQTS–hiPSC-CCSs. (A and B) Schemes describing the cross-field optogenetic stimulation protocols in both time (A) and space (B). The coculture is optogenetically paced using a point stimulation (S1) from the left side of the culture. When the S1-induced wavefront reaches the center of the tissue, a perpendicular wavefront is delivered by a broad S2 optogenetic-based stimulation wave originating from the top half of the culture (S2). (C) Sequential fluorescence images taken from the dynamic optical mapping display depicting the process of spiral wave induction. At t = 0 ms, a point optogenetic pacing stimuli (S1) induces a propagation wave traveling from left to right (t = 83 ms). When the propagation wave reaches the center of the culture, a broad optogenetic premature stimulation (S2) produced a new wavefront traveling perpendicular to the initial wave (t = 102 ms). This new wavefront is able preexcite already excitable tissue proximal to the traveling S1 wave (146 ms, marked in a blue circle) and initiate a sustained spiral wave (181–294 ms). (DF) Optogenetic APD modulation prevents spiral wave induction. (D and E) Schemes depicting the optogenetic cross-field stimulation and dynamic APD modulation protocols in both time (D) and space (E). Following application of S1, an APD-modulating illumination pattern was delivered, which was designed to be identical to the shape of the S1-induced propagating activation wavefront and to follow this wavefront with the same CV and a fixed delay of 40 ms. To complete the cross-field stimulation, a perpendicular wavefront was then induced by S2 as described above. (F) Sequential fluorescence images taken from the dynamic optical-mapping display depicting the prevention of the cross-field–induced spiral wave generation by the APD-modulating signal. The prolongation of the tissue wavelength by the APD-modulating signal is marked with a double-headed blue arrow. This resulted in the prevention of the development of reentrant activity following the premature S2 excitation wavefront.
Figure 8
Figure 8. Adjustable optogenetic prevention of reentrant arrhythmias in the SQTS–hiPSC-CCS model.
(A and B) Effects of changing the properties of the APD-modulation illumination signal on its antiarrhythmic capability. (A) Schemes highlighting the different optogenetic APD modulating patterns used and the resulting maximal APD prolongation (in ms) and degree of wavelength prolongation (in mm) of the propagative wavefront in the SQTS tissue model for each intervention. (B) Summary of the spiral wave induction rate using each of the different APD modulation protocols. The protocol with no APD modulation served as control (n = 20 in 6 independent experiments). *P < 0.05, **P < 0.01, ***P < 0.001 using Cochran’s Q test for repeated measurements of binary data, followed by Dunn post hoc test).

Similar articles

Cited by

References

    1. Schram G, et al. Differential distribution of cardiac ion channel expression as a basis for regional specialization in electrical function. Circ Res. 2002;90(9):939–950. doi: 10.1161/01.RES.0000018627.89528.6F. - DOI - PubMed
    1. Goldenberg I, Moss AJ. Long QT syndrome. J Am Coll Cardiol. 2008;51(24):2291–2300. doi: 10.1016/j.jacc.2008.02.068. - DOI - PubMed
    1. Gaita F, et al. Short QT Syndrome. Circulation. 2003;108(8):965–970. doi: 10.1161/01.CIR.0000085071.28695.C4. - DOI - PubMed
    1. Sanguinetti MC, Tristani-Firouzi M. hERG potassium channels and cardiac arrhythmia. Nature. 2006;440(7083):463–469. doi: 10.1038/nature04710. - DOI - PubMed
    1. Patel C, et al. Short QT syndrome: from bench to bedside. Circ Arrhythm Electrophysiol. 2010;3(4):401–408. doi: 10.1161/CIRCEP.109.921056. - DOI - PMC - PubMed

Publication types

MeSH terms

Supplementary concepts