. 2022 Jan 12;43(1):35-60.
doi: 10.1210/endrev/bnab018.

Fat Cell Size: Measurement Methods, Pathophysiological Origins, and Relationships With Metabolic Dysregulations

Affiliations

Fat Cell Size: Measurement Methods, Pathophysiological Origins, and Relationships With Metabolic Dysregulations

Run Zhou Ye et al. Endocr Rev. .

Abstract

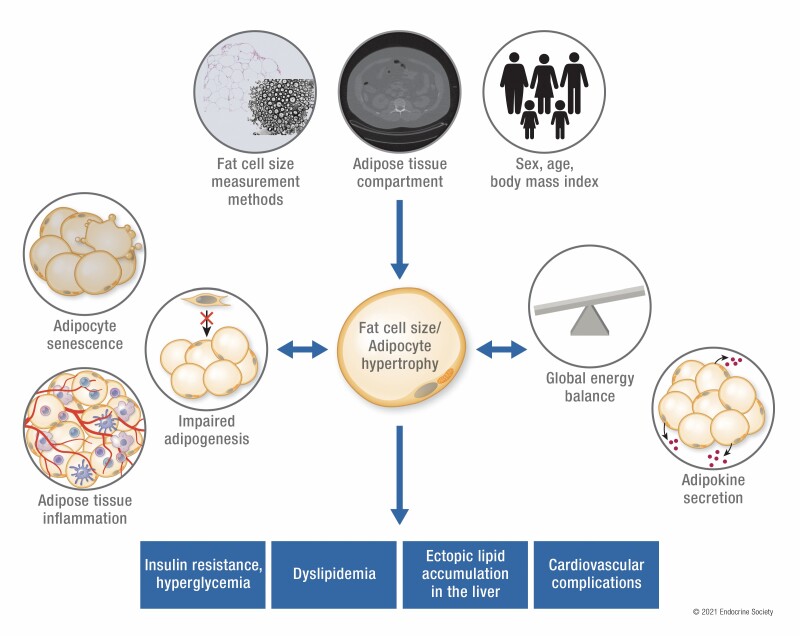
The obesity pandemic increasingly causes morbidity and mortality from type 2 diabetes, cardiovascular diseases and many other chronic diseases. Fat cell size (FCS) predicts numerous obesity-related complications such as lipid dysmetabolism, ectopic fat accumulation, insulin resistance, and cardiovascular disorders. Nevertheless, the scarcity of systematic literature reviews on this subject is compounded by the use of different methods by which FCS measurements are determined and reported. In this paper, we provide a systematic review of the current literature on the relationship between adipocyte hypertrophy and obesity-related glucose and lipid dysmetabolism, ectopic fat accumulation, and cardiovascular disorders. We also review the numerous mechanistic origins of adipocyte hypertrophy and its relationship with metabolic dysregulation, including changes in adipogenesis, cell senescence, collagen deposition, systemic inflammation, adipokine secretion, and energy balance. To quantify the effect of different FCS measurement methods, we performed statistical analyses across published data while controlling for body mass index, age, and sex.

Keywords: Adipocyte hypertrophy; cardiometabolic disorders; diabetes; meta-analysis; obesity; systematic review.


Figures

Graphical Abstract
Graphical Abstract
Figure 1.
Figure 1.
Prisma flowchart showing the number of articles at each step of the literature review and meta-analysis.
Figure 2.
Figure 2.
Adipocyte diameter according to different size measurement methods. (A) Abdominal subcutaneous adipocyte diameter. (B) Visceral adipocyte diameter. abSC, abdominal subcutaneous; CD, collagenase digestion; HS, histological section; OF, osmium fixation; VAT, visceral adipose tissue.
Figure 3.
Figure 3.
Adipocyte diameter in relation to body mass index (BMI) according to different size measurement methods. (A) Abdominal subcutaneous adipocyte diameter (in µm) assessed using collagenase digestion. (B) Abdominal subcutaneous adipocyte diameter (in µm) assessed using histological section. (C) Abdominal subcutaneous adipocyte diameter (in µm) assessed using osmium fixation. (d) Visceral adipocyte diameter (in µm) assessed using collagenase digestion. (E) Visceral adipocyte diameter (in µm) assessed using histological section. abSC, abdominal subcutaneous; CD, collagenase digestion; FCS, fat cell size; HS, histological section; OF, osmium fixation; VAT, visceral adipose tissue.
Figure 4.
Figure 4.
Adipocyte diameter across different adipose tissue regions. abSC, abdominal subcutaneous; AT, adipose tissue; fSC, femoral subcutaneous; gSC, gluteal subcutaneous; VAT, visceral adipose tissue.
Figure 5.
Figure 5.
Fat cell size as a function of BMI in different adipose tissue depots. (a) Abdominal subcutaneous fat cell size as a function of BMI. (B) Gluteal subcutaneous fat cell size as a function of BMI. (C)Femoral subcutaneous fat cell size as a function of BMI. (D) Visceral fat cell size as a function of BMI. abSC, abdominal subcutaneous; AT, adipose tissue; BMI, body mass index; FCS, fat cell size; fSC, femoral subcutaneous; gSC, gluteal subcutaneous; VAT, visceral adipose tissue.
Figure 6.
Figure 6.
Relationships between abdominal subcutaneous fat cell size and (A) fasting insulin; (B) HOMA-IR; (C) fasting glucose; (D) M-value. Relationship between visceral fat cell size and (E) fasting insulin; (F) HOMA-IR; (G) fasting glucose; and (H) M-value. abSC, abdominal subcutaneous; FCS, fat cell size; HOMA-IR, homeostatic model assessment of insulin resistance.
Figure 7.
Figure 7.
Adipocyte size and lipid metabolism. (A) Left panel: mechanisms leading to adipocyte triglyceride (TG) accumulation include nonesterified fatty acids (NEFAs) uptake from the circulatory pool or from lipoprotein lipase (LPL)-mediated hydrolysis of TG-rich lipoproteins, and de novo synthesis of fatty acids from carbohydrates (de novo lipogenesis). Right panel: mechanisms leading to adipocyte TG mobilization include basal and norepinephrine-stimulated intracellular TG lipolysis leading to NEFA efflux into the circulation or NEFA oxidation. (B) Change in fat cell size in relation to obesity is depicted for abdominal subcutaneous adipose tissue (SCAT) vs visceral adipocyte tissue (VAT) along with change in triglyceride-nonesterified fatty acid (TG-NEFA) turnover based on in vivo studies. (C) Change in the mechanisms leading to adipocyte TG accumulation (left panels) or mobilization (right panels) according to the degree of obesity and fat cell size (FCS) measured ex vivo (upper panels) or in vivo (lower panels). Changes are expressed by the color tone, light tones for low metabolic rates or smaller levels and dark tones for high metabolic rates or higher levels. Empty bands indicate conflicting results or insufficient data to indicate increase or decrease with obesity or fat cell size change. ACS, acetyl-CoA synthetase; ATGL, adipose triglyceride lipase; DGAT, diglyceride acyltransferase; DFA, dietary fatty acid; GPAT, glycerol-3-phosphate acyltransferase; HDL-c, high-density lipoprotein cholesterol; HSL, hormone sensitive lipase; LDL-c, low-density lipoprotein-cholesterol.
Figure 8.
Figure 8.
Relationships between abdominal subcutaneous fat cell size and (A) plasma triglycerides; (B) nonesterified fatty acid; (C) total cholesterol; (D) low-density lipoprotein-cholesterol; (E) and high-density lipoprotein-cholesterol. Relationships between visceral fat cell size and (F) triglycerides; (G) total cholesterol; (H) low-density lipoprotein-cholesterol; and (I), high-density lipoprotein-cholesterol. abSC, abdominal subcutaneous; FCS, fat cell size; NEFA, free fatty acid; HDL-c, high-density lipoprotein-cholesterol; LDL-c, low-density lipoprotein-cholesterol; TG, triglyceride.

References

    1. Ye RZ, Richard G, Gévry N, Tchernof A, Carpentier AC. Supplementary material to Adipocyte hypertrophy: measurement methods, pathophysiological origins, and relationships with metabolic dysregulations.2021. ProMED-mail website. https://figshare.com/s/4f70a4c8e2edc7e032c9
    1. WebPlotDigitizer [computer program]. Version 4.1. Austin, TX,2018. https://automeris.io/WebPlotDigitizer/
    1. Drevon D, Fursa SR, Malcolm AL. Intercoder reliability and validity of webplotdigitizer in extracting graphed data. Behav Modif. 2017;41(2):323-339. - PubMed
    1. Goldrick RB. Morphological changes in the adipocyte during fat deposition and mobilization. Am J Physiol. 1967;212(4):777-782. - PubMed
    1. Murphy J, Moullec G, Santosa S. Factors associated with adipocyte size reduction after weight loss interventions for overweight and obesity: a systematic review and meta-regression. Metabolism. 2017;67:31-40. - PubMed

Publication types

Grants and funding