. 2021 Jul;22(3):171-185.
doi: 10.1007/s10048-021-00645-6. Epub 2021 Jun 8.

Age-dependent neurological phenotypes in a mouse model of PRRT2-related diseases

Affiliations

Age-dependent neurological phenotypes in a mouse model of PRRT2-related diseases

Fay Aj et al. Neurogenetics. 2021 Jul.

Abstract

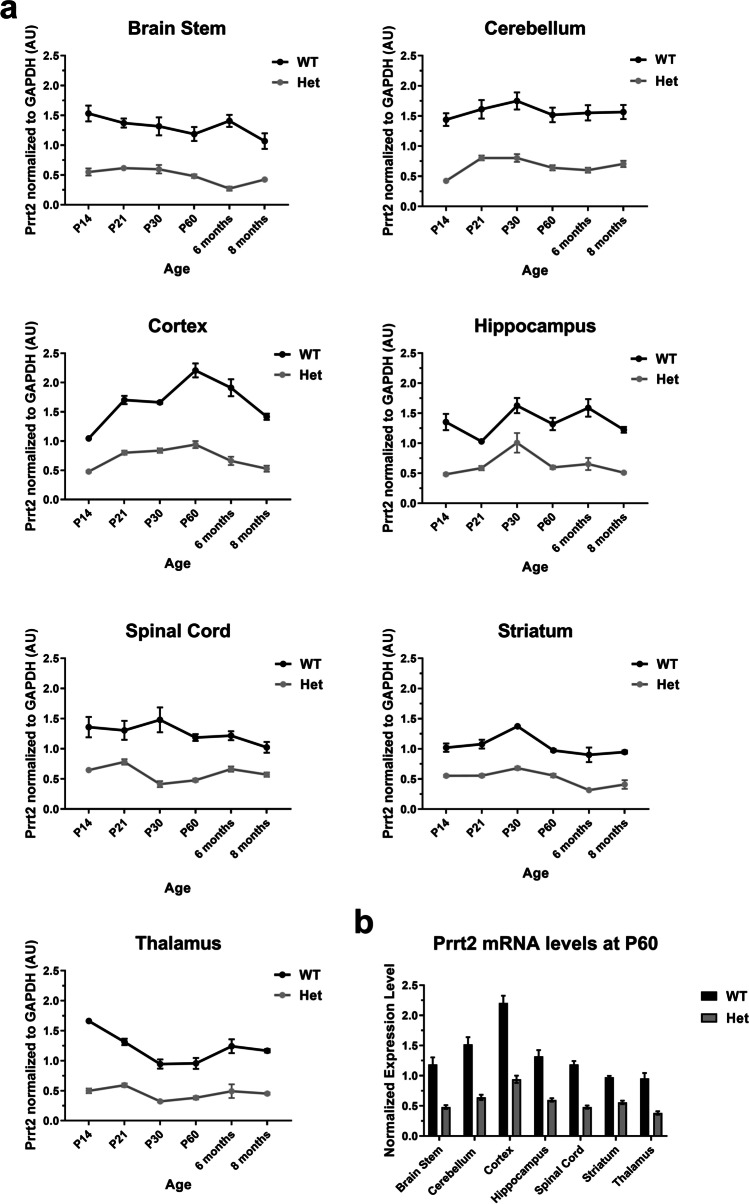
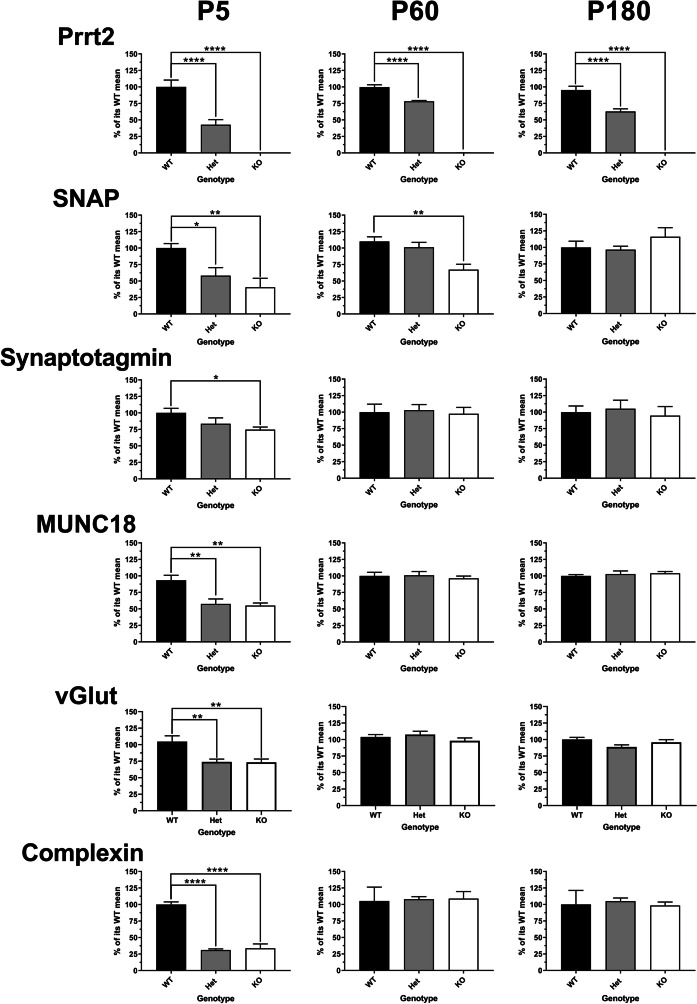
Paroxysmal kinesigenic dyskinesia is an episodic movement disorder caused by dominant mutations in the proline-rich transmembrane protein PRRT2, with onset in childhood and typically with improvement or resolution by middle age. Mutations in the same gene may also cause benign infantile seizures, which begin in the first year of life and typically remit by the age of 2 years. Many details of PRRT2 function at the synapse, and the effects of mutations on neuronal excitability in the pathophysiology of epilepsy and dyskinesia, have emerged through the work of several groups over the last decade. However, the age dependence of the phenotypes has not been explored in detail in transgenic models. Here, we report our findings in heterozygous and homozygous Prrt2 knockout mice that recapitulate the age dependence of dyskinesia seen in the human disease. We show that Prrt2 deletion reduces the levels of synaptic proteins in a dose-dependent manner that is most pronounced at postnatal day 5 (P5), attenuates at P60, and disappears by P180. In a test for foot slippage while crossing a balance beam, transient loss of coordination was most pronounced at P60 and less prominent at age extremes. Slower traverse time was noted in homozygous knockout mice only, consistent with the ataxia seen in rare individuals with biallelic loss of function mutations in Prrt2. We thus identify three age-dependent phenotypic windows in the mouse model, which recapitulate the pattern seen in humans with PRRT2-related diseases.

Keywords: Dyskinesia; Epilepsy; Mouse model; Movement disorders; Paroxysmal disorders.


Conflict of interest statement

The authors declare no competing interests.

Figures

Fig. 1
Fig. 1
Confirmation of the quantitation and distribution of Prrt2 mRNA throughout the central nervous system with an allelic mutation–dependent reduction in Pkd and Prrt2 KO mice. Prrt2 mRNA levels were assessed by quantitative real-time reverse transcriptase PCR in several brain regions of mice. a From postnatal day 14 to 8 months of age. Prrt2 wild-type mice (WT n = 3–5, black line) versus Het mice (n = 3–6, grey line). mRNA levels of the Prrt2 het mice were approximately half that of their WT littermates. All samples were normalized to GAPDH controls. b Prrt2 mRNA expression levels at postnatal 60 (P60) in several brain regions were highest in the cortex, followed by the cerebellum, with relatively similar expression levels in the thalamus, hippocampus, brainstem, striatum, and spinal cord. All comparisons were significant by genotype by two-way ANOVA ****p < 0.0001.
Fig. 2
Fig. 2
At the earliest time point studied, in P5 cerebellar neurons, Prrt2 mutation is associated with reductions of proteins associated with the SNARE complex. Followed by small reductions in a few proteins of the SNARE complex at P60 and those reductions are mitigated at P180. Western blot analysis of Prrt2 and SNARE complex proteins of cerebellar tissue in Prrt2 WT (black bars), Het (grey bars), and KO (white bars) mice. Samples were first normalized to GAPDH; then comparisons were made to the mean value of Prrt2 WT mice and expressed as % of its WT mean + / − S.E.M. In postnatal 5 days (P5) old, there was a significant reduction in Prrt2: WT n = 12, Het n = 9, KO n = 13; SNAP25: WT n = 8, Het n = 8, KO n = 8; Synaptotagmin: WT n = 17, Het n = 18, KO n = 18; MUNC18: WT n = 6, Het n = 6, KO n = 6; vGlut1: WT n = 10, Het n = 8, KO n = 10; Complexin 1 + 2: WT n = 3, Het n = 3, KO n = 3; NSF: WT n = 3, Het n = 3, KO n = 3; VAMP: WT n = 12, Het n = 12, KO n = 12; syntaxin 1: WT n = 12, Het n = 12, n = 12; syntaxin 2: WT n = 12, Het n = 12, KO n = 12; PNKD: WT n = 5, Het n = 5, KO n = 5. In postnatal 60 days (P60) old, there was a significant reduction in Prrt2: WT n = 6, Het n = 6, KO n = 6; SNAP25: WT n = 10, Het n = 9, KO n = 10; Synaptotagmin: WT n = 6, Het n = 6, KO n = 6; MUNC18: WT n = 6, Het n = 6, KO n = 6; vGlut1: WT n = 10, Het n = 11, KO n = 11; Complexin 1 + 2: WT n = 9, Het n = 8, KO n = 9; NSF: WT n = 6, Het n = 6, KO n = 6; VAMP: WT n = 12, Het n = 12, KO n = 12; syntaxin 1: WT n = 8, Het n = 9, KO n = 9; syntaxin 2: WT n = 9, Het n = 9, KO n = 9. In postnatal 180 days (P180) old, there was a significant reduction in Prrt2: WT n = 6, Het n = 6, KO n = 6; SNAP25: WT n = 18, Het n = 18, KO n = 18; Synaptotagmin: WT n = 6, Het n = 6, KO n = 6; MUNC18: WT n = 6, Het n = 6, KO n = 6; vGlut1: WT n = 12, Het n = 12, KO n = 12; Complexin 1 + 2: WT n = 18, Het n = 18, KO n = 18; NSF: WT n = 24, Het n = 22, KO n = 24; VAMP: WT n = 12, Het n = 12, KO n = 12; syntaxin 1: WT n = 6, Het n = 6, KO (p = NS, n = 6); syntaxin 2: WT n = 12, Het n = 12, and KO n = 12. All comparisons were done by one-way ANOVA, Tukey’s multiple comparisons, compared to that in WT. (*p < 0.05, **p < 0.01, ***p < 0.001, ****p < 0.0001)
Fig. 2
Fig. 2
At the earliest time point studied, in P5 cerebellar neurons, Prrt2 mutation is associated with reductions of proteins associated with the SNARE complex. Followed by small reductions in a few proteins of the SNARE complex at P60 and those reductions are mitigated at P180. Western blot analysis of Prrt2 and SNARE complex proteins of cerebellar tissue in Prrt2 WT (black bars), Het (grey bars), and KO (white bars) mice. Samples were first normalized to GAPDH; then comparisons were made to the mean value of Prrt2 WT mice and expressed as % of its WT mean + / − S.E.M. In postnatal 5 days (P5) old, there was a significant reduction in Prrt2: WT n = 12, Het n = 9, KO n = 13; SNAP25: WT n = 8, Het n = 8, KO n = 8; Synaptotagmin: WT n = 17, Het n = 18, KO n = 18; MUNC18: WT n = 6, Het n = 6, KO n = 6; vGlut1: WT n = 10, Het n = 8, KO n = 10; Complexin 1 + 2: WT n = 3, Het n = 3, KO n = 3; NSF: WT n = 3, Het n = 3, KO n = 3; VAMP: WT n = 12, Het n = 12, KO n = 12; syntaxin 1: WT n = 12, Het n = 12, n = 12; syntaxin 2: WT n = 12, Het n = 12, KO n = 12; PNKD: WT n = 5, Het n = 5, KO n = 5. In postnatal 60 days (P60) old, there was a significant reduction in Prrt2: WT n = 6, Het n = 6, KO n = 6; SNAP25: WT n = 10, Het n = 9, KO n = 10; Synaptotagmin: WT n = 6, Het n = 6, KO n = 6; MUNC18: WT n = 6, Het n = 6, KO n = 6; vGlut1: WT n = 10, Het n = 11, KO n = 11; Complexin 1 + 2: WT n = 9, Het n = 8, KO n = 9; NSF: WT n = 6, Het n = 6, KO n = 6; VAMP: WT n = 12, Het n = 12, KO n = 12; syntaxin 1: WT n = 8, Het n = 9, KO n = 9; syntaxin 2: WT n = 9, Het n = 9, KO n = 9. In postnatal 180 days (P180) old, there was a significant reduction in Prrt2: WT n = 6, Het n = 6, KO n = 6; SNAP25: WT n = 18, Het n = 18, KO n = 18; Synaptotagmin: WT n = 6, Het n = 6, KO n = 6; MUNC18: WT n = 6, Het n = 6, KO n = 6; vGlut1: WT n = 12, Het n = 12, KO n = 12; Complexin 1 + 2: WT n = 18, Het n = 18, KO n = 18; NSF: WT n = 24, Het n = 22, KO n = 24; VAMP: WT n = 12, Het n = 12, KO n = 12; syntaxin 1: WT n = 6, Het n = 6, KO (p = NS, n = 6); syntaxin 2: WT n = 12, Het n = 12, and KO n = 12. All comparisons were done by one-way ANOVA, Tukey’s multiple comparisons, compared to that in WT. (*p < 0.05, **p < 0.01, ***p < 0.001, ****p < 0.0001)
Fig. 3
Fig. 3
Deletion of prrt2 reduces the amount of glutamate release, but not GABA release, in a gene copy-number-dependent manner. Neurotransmitter levels of Prrt2 WT (black bars), Het (grey bars), and KO (white bars) of P5 cerebellar neurons measured by ELISA. a Glutamate release: Cerebellar granule cells for Prrt2 WT n = 36, Het (*p = 0.0105, n = 32) and KO (****p < 0.0001), n = 45. b GABA release: Cerebellar granule cells for Prrt2 WT n = 8, Het (p = NS, n = 5) and KO (p = NS, n = 6). Results were adjusted for protein levels and expressed as a percentage of total neurotransmitter level (neurotransmitter release/neurotransmitter release + lysate level × 100). One-way ANOVA, Tukey’s multiple comparisons to Prrt2 WT neurons
Fig. 4
Fig. 4
Deletion of prrt2 reduces the amount of VGLUT1-pH in the RP, but not the rate of exocytosis. a The time course of VGLUT1-pH fluorescence changes in response to electrical stimulation at 10 Hz 90 s (bar) in the presence of 5 µM bafilomycin (baf) in transfected hippocampal synaptic boutons from WT (black circles) or prrt2 KO mice (white triangles), normalized to the total fluorescence in each bouton in the presence of 50 mM NH4Cl applied after stimulation. The fluorescence of VGLUT1-pH increases rapidly upon stimulation and reaches a plateau which represents the fraction of VGLUT1-pH in RP. b Loss of prrt2 decreases the amount of VGLUT1-pH in the RP (KO, white bars 0.2940 ± 0.0442), compared to that in WT (black bars, 0.438 ± 0.0419, *p < 0.05). c The rate of VGLUT1-pH exocytosis is not significantly altered by loss of prrt2 [(ΔF/F0)/s: WT 0.0459 ± 0.0044; and KO 0.0485 ± 0.0052, p > 0.05)]. Data are means ± SEM of ΔF/F0 normalized to total fluorescence. Data are from 27 to 91 boutons per coverslips from 7 to 10 coverslips from three independent cultures
Fig. 5
Fig. 5
Cerebellar synaptic transmission altered at 2 months in PRRT2 mice. Cerebellar Purkinje cells were recorded in the whole-cell, voltage-clamp mode in slices from PRRT WT, Het, and KO mice at ages 1, 2, and 6 months. A stimulating electrode was placed in the nearby molecular layer. a Schematic of the recording configuration. bd Miniature excitatory postsynaptic currents (mEPSCs) recorded in the presence of picrotoxin and tetrodotoxin. b Traces of mEPSCs in representative cells from WT, Het, and KO mice at 2 and 6 months. c, d Average mEPSC amplitudes c and frequencies (d) measured at 1 month (WT: N = 4/n = 7; Het: N = 7/n = 11; KO: N = 3/n = 8), 2 months (WT: N = 5/n = 10; Het: N = 9/n = 15; KO: N = 6/n = 11) and 6 months (WT: N = 4/n = 8; Het: N = 5/n = 9; KO: N = 1/n = 4). Individual neurons are represented by the overlaid dots. ef Electrically evoked excitatory postsynaptic currents, measured in the presence of picrotoxin at 2 months. e Pairs of overlaid EPSCs evoked at different interstimulus intervals (ISIs) in representative cells from WT, Het, and KO slices. f Average paired-pulse ratio (PPR) at different ISIs in WT (N = 3/n = 9), Het (N = 6/n = 20), and KO slices (N = 5/n = 12). N refers to animals, n to cells. Data represented as average + / − SEM
Fig. 6
Fig. 6
Balance and motor coordination assessed on the balance beam. Transient loss of coordination, as measured by increased slipping on the balance beam test, is apparent at P30, and seems to persist and even worsen at P60, but disappears by P180. Prolonged balance beam traverse time becomes more apparent at later time points (P60 and P180). Graphs represent traverse time (s) and slips. Bars represent the mean + / − SEM of the final days (5–8 trials), post training on the beam. (a) Traverse time and (b) slips: P30: WT (black bar) n = 13, Het (grey bar) n = 28, and KO (white bar) n = 9. P60: WT (black bar) n = 27, Het (grey bar) n = 34, and KO (white bar) n = 10. P180: WT (black bar) n = 15, Het (grey bar) n = 22, and KO (white bar) n = 9. The maximum traverse time was 20 s. Traverse time greater than 20 s the mouse fails and was counted as 20 s. One-way ANOVA, Tukey’s multiple comparisons, compared to WT. (*p < 0.05, **p < 0.01, ***p < 0.001, ****p < 0.0001)
Fig. 7
Fig. 7
Gait and stride analysis of mice from all three genotypes revealed no significant differences in stride length of forelimbs or hindlimbs in Pkd mice compared to those in wild-type at P60. WT (black bar) n = 11, Het (grey bar) n = 10, and KO (white bar) n = 7. No significant differences by 2-way ANOVA

References

    1. Wang JL, Cao L, Li XH, Hu ZM, Li JD, Zhang JG, Liang Y, San A, Li N, Chen SQ, Guo JF, Jiang H, Shen L, Zheng L, Mao X, Yan WQ, Zhou Y, Shi YT, Ai SX, Dai MZ, Zhang P, Xia K, Chen SD, Tang BS. Identification of PRRT2 as the causative gene of paroxysmal kinesigenic dyskinesias. Brain. 2021;134(Pt 12):3493–3501. doi: 10.1093/brain/awr289. - DOI - PMC - PubMed
    1. Chen WJ, Lin Y, Xiong ZQ, Wei W, Ni W, Tan GH, Guo SL, He J, Chen YF, Zhang QJ, Li HF, Lin Y, Murong SX, Xu J, Wang N, Wu ZY. Exome sequencing identifies truncating mutations in PRRT2 that cause paroxysmal kinesigenic dyskinesia. Nat Genet. 2011;43(12):1252–1255. doi: 10.1038/ng.1008. - DOI - PubMed
    1. van Vliet R, Breedveld G, de Rijk-van AJ, Brilstra E, Verbeek N, Verschuuren-Bemelmans C, Boon M, Samijn J, Diderich K, van de Laar I, Oostra B, Bonifati V, Maat-Kievit A. PRRT2 phenotypes and penetrance of paroxysmal kinesigenic dyskinesia and infantile convulsions. Neurology. 2012;79(8):777–784. doi: 10.1212/WNL.0b013e3182661fe3. - DOI - PubMed
    1. Cloarec R, Bruneau N, Rudolf G, Massacrier A, Salmi M, Bataillard M, Boulay C, Caraballo R, Fejerman N, Genton P, Hirsch E, Hunter A, Lesca G, Motte J, Roubertie A, Sanlaville D, Wong SW, Fu YH, Rochette J, Ptácek LJ, Szepetowski P. PRRT2 links infantile convulsions and paroxysmal dyskinesia with migraine. Neurology. 2012;79(21):2097–2103. doi: 10.1212/WNL.0b013e3182752c46. - DOI - PMC - PubMed
    1. Lee HY, Huang Y, Bruneau N, Roll P, Roberson ED, Hermann M, Quinn E, Maas J, Edwards R, Ashizawa T, Baykan B, Bhatia K, Bressman S, Bruno MK, Brunt ER, Caraballo R, Echenne R, Fejerman N, Frucht S, Gurnett CA, Hirsch E, Houlden H, Jankovic J, Lee WL, Lynch DR, Mohammed S, Müller U, Nespeca MP, Renner D, Rochette J, Rudolf G, Saiki S, Soong BW, Swoboda KJ, Tucker S, Wood N, Hanna M, Bowcock AM, Szepetowski P, Fu YH, Ptáček LJ. Mutations in the gene PRRT2 cause paroxysmal kinesigenic dyskinesia with infantile convulsions. Cell Rep. 2012;1(1):2–12. doi: 10.1016/j.celrep.2011.11.001. - DOI - PMC - PubMed

Publication types

Supplementary concepts