. 2021 Aug;118(8):3239-3250.
doi: 10.1002/bit.27848. Epub 2021 Jun 17.

Scale-up economics for cultured meat

Affiliations

Scale-up economics for cultured meat

David Humbird. Biotechnol Bioeng. 2021 Aug.

Abstract

This analysis examines the potential of "cultured meat" products made from edible animal cell culture to measurably displace the global consumption of conventional meat. Recognizing that the scalability of such products must in turn depend on the scale and process intensity of animal cell production, this study draws on technoeconomic analysis perspectives in industrial fermentation and upstream biopharmaceuticals to assess the extent to which animal cell culture could be scaled like a fermentation process. Low growth rate, metabolic inefficiency, catabolite inhibition, and shear-induced cell damage will all limit practical bioreactor volume and attainable cell density. Equipment and facilities with adequate microbial contamination safeguards have high capital costs. The projected costs of suitably pure amino acids and protein growth factors are also high. The replacement of amino-acid media with plant protein hydrolysates is discussed and requires further study. Capital- and operating-cost analyses of conceptual cell-mass production facilities indicate economics that would likely preclude the affordability of their products as food. The analysis concludes that metabolic efficiency enhancements and the development of low-cost media from plant hydrolysates are both necessary but insufficient conditions for displacement of conventional meat by cultured meat.

Keywords: animal cell culture; bioreactor design; fermentation; techno-economic analysis.


Figures

Figure 1
Figure 1
Conceptual cultured meat production process
Figure 2
Figure 2
Amino‐acid profiles of cellular protein and U.S. soybean meal [Color figure can be viewed at wileyonlinelibrary.com]
Figure 3
Figure 3
Schematic of a STR with external cooling jacket. Bioreactor diameter is denoted T and impeller diameter is D. Aseptic piping and instrumentation follow BPE‐2016 (ASME, 2016). STR, stirred‐tank bioreactor [Color figure can be viewed at wileyonlinelibrary.com]
Figure 4
Figure 4
(a) Fed‐batch simulations in an O2‐sparged 20 m3 bioreactor with 80% max working volume and 5 mmol/L max NH3 concentration. Dashed lines: Reaction 2; solid lines: Reaction 3. (b) Maximum cell density achievable in fed‐batch suspension culture with Reaction 3. The limiting density for each constraint was computed independently of the others, and the density axis is truncated at the viscosity limit. (c) Maximum cell density achievable in perfusion suspension culture as a function of perfusion rate with Reactions 2 and 3 [Color figure can be viewed at wileyonlinelibrary.com]
Figure 5
Figure 5
(a) Unit cost versus production rate for individual amino acids and their cost contribution to wet cell mass at scale (stoichiometry of Reaction 3). (b) Price‐volume relations for industrial enzymes and therapeutics. Adjusted to 2018$. RHI, recombinant human insulin; SS, stainless steel; SUT, single‐use technology [Color figure can be viewed at wileyonlinelibrary.com]
Figure 6
Figure 6
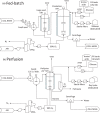
Process flow diagrams of conceptual bulk cell‐culture processes. (a) Fed‐batch. (b) Perfusion [Color figure can be viewed at wileyonlinelibrary.com]
Figure 7
Figure 7
COP sensitivities predicted by the fed‐batch TEA model. (a) 24 × 20 m3 bioreactors at increasing global production volume. (b) Varying number of 20 m3 bioreactors in a single facility, at 100 kTA. (c) Varying volume of the production bioreactor (24×). COP, cost of production [Color figure can be viewed at wileyonlinelibrary.com]
Figure 8
Figure 8
COP sensitivities predicted by the perfusion TEA model. (a) 6.9 kTA production in a single facility at increasing global production volume. (b) Varying production rate (i.e., number of bioreactors) at a single facility, at 100 kTA. (c) Increasing perfusion rate and cell density. At >1.0/d (140 g/L), a second ATF filter is added. ATF, alternating tangential‐flow; COP, cost of production [Color figure can be viewed at wileyonlinelibrary.com]

References

    1. Alberts, B., (Ed.). (2002). Molecular biology of the cell (4th ed). Garland Science.
    1. Al‐Rubeai, M., Singh, R. P., Goldman, M. H., & Emery, A. N. (1995). Death mechanisms of animal cells in conditions of intensive agitation. Biotechnology and Bioengineering, 45(6), 463–472. 10.1002/bit.260450602 - DOI - PubMed
    1. Arbige, M. (1989). Industrial enzymology: A look towards the future. Trends in Biotechnology, 7(12), 330–335. 10.1016/0167-7799(89)90032-2 - DOI - PubMed
    1. ASME . (2016). Bioprocessing equipment (BPE‐2016).
    1. Babcock, J., Smith, S., Huttinga, H., & Merrill, D. (2007). Enhancing performance in cell culture. Genetic Engineering and Biotechnology News, 27(20), https://www.genengnews.com/magazine/81/enhancing-performance-in-cell-cul...

Publication types

LinkOut - more resources