

SARS-CoV-2 sensing by RIG-I and MDA5 links epithelial infection to macrophage inflammation
- PMID: 34101213
- PMCID: PMC8209947
- DOI: 10.15252/embj.2021107826
SARS-CoV-2 sensing by RIG-I and MDA5 links epithelial infection to macrophage inflammation
Abstract
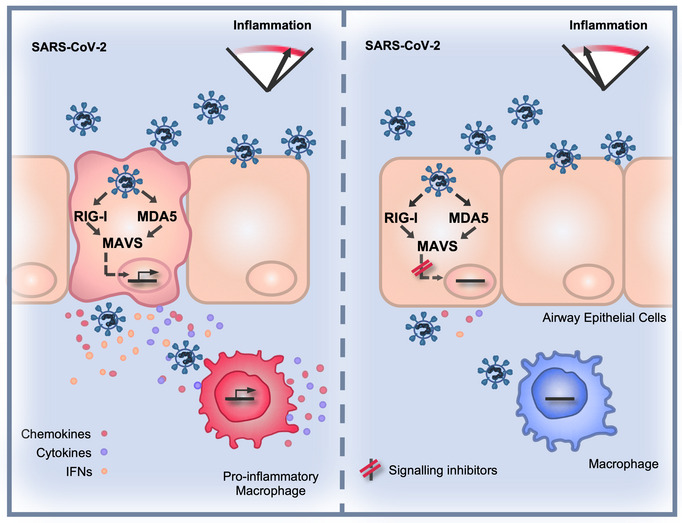
SARS-CoV-2 infection causes broad-spectrum immunopathological disease, exacerbated by inflammatory co-morbidities. A better understanding of mechanisms underpinning virus-associated inflammation is required to develop effective therapeutics. Here, we discover that SARS-CoV-2 replicates rapidly in lung epithelial cells despite triggering a robust innate immune response through the activation of cytoplasmic RNA sensors RIG-I and MDA5. The inflammatory mediators produced during epithelial cell infection can stimulate primary human macrophages to enhance cytokine production and drive cellular activation. Critically, this can be limited by abrogating RNA sensing or by inhibiting downstream signalling pathways. SARS-CoV-2 further exacerbates the local inflammatory environment when macrophages or epithelial cells are primed with exogenous inflammatory stimuli. We propose that RNA sensing of SARS-CoV-2 in lung epithelium is a key driver of inflammation, the extent of which is influenced by the inflammatory state of the local environment, and that specific inhibition of innate immune pathways may beneficially mitigate inflammation-associated COVID-19.
Keywords: RNA sensing; SARS-CoV-2; epithelial; inflammation; macrophage.
© 2021 The Authors. Published under the terms of the CC BY 4.0 license.
Conflict of interest statement
The authors declare that they have no conflict of interest.
Figures
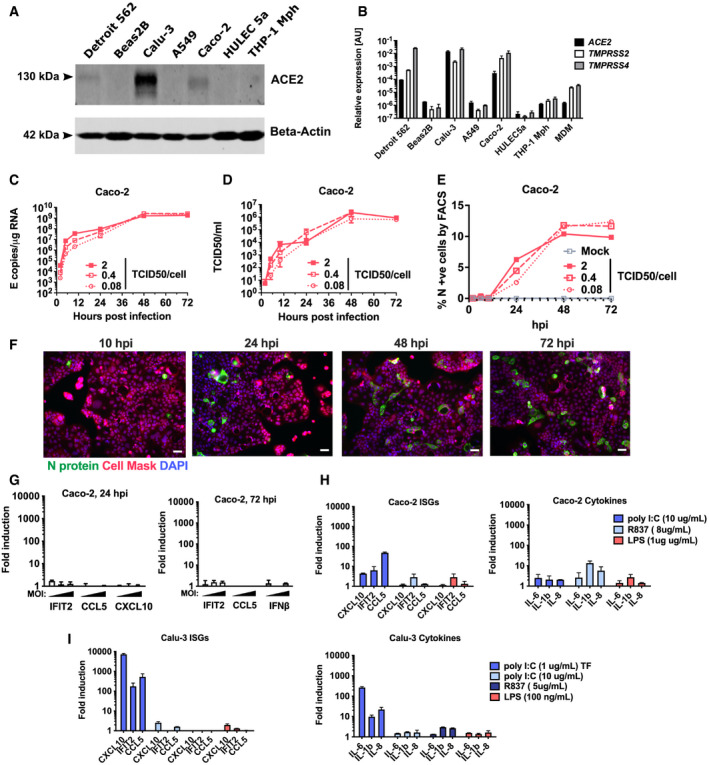
- A
Immunoblot detecting ACE2 expression in epithelial (Detroit 562, Beas2B, Calu‐3, Caco‐2), endothelial (HULEC5a) and PMA‐differentiated THP‐1 cells. b‐Actin is detected as loading control.
- B
ACE2, TMPRSS2 and TMPRSS4 gene expression in cell lines and primary monocyte‐derived macrophages (MDM). Relative expression normalised to GAPDH mean ± SEM n = 2.
- C–G
Measurements of replication and innate immune induction in Caco‐2 intestinal epithelial cells infected with SARS‐CoV‐2 at MOI 0.08, 0.4 or 2 TCID50VERO/cell. Mean ± SEM, n = 2. (C) SARS‐CoV‐2 genomic and subgenomic E RNAs (qRT‐PCR). (D) Infectious virus released from cells in (C) determined by TCID50 on Vero.E6 cells, mean ± SEM n = 2. (E) Quantification of N staining from cells in (C) by flow cytometry. Mean percentage of N‐positive of all live‐gated cells ± SEM, n = 2. (F) Representative example of immunofluorescence staining of N protein (green) after SARS‐CoV‐2 infection of Caco‐2 at MOI 0.4 TCID50VERO/cell, at time points shown. Nuclei (DAPI, blue), cell mask (red). (G) Fold induction of interferon and interferon‐stimulated genes (ISG) of infections in (C) at 24 h and 72 hpi at MOIs TCID50VERO/cell 0.08, 0.4 or 2, n = 2.
- H
Fold induction of ISG and cytokine gene expression in Caco‐2 cells in response to innate immune activation with poly(I:C), R837 and LPS for 24 h, n = 2.
- I
Fold induction of ISG and cytokine gene expression in Calu‐3 cells in response to innate immune activation with poly(I:C) (+/− transfection, TF), R837 and LPS for 24 h, n = 2. Mean ± SEM.
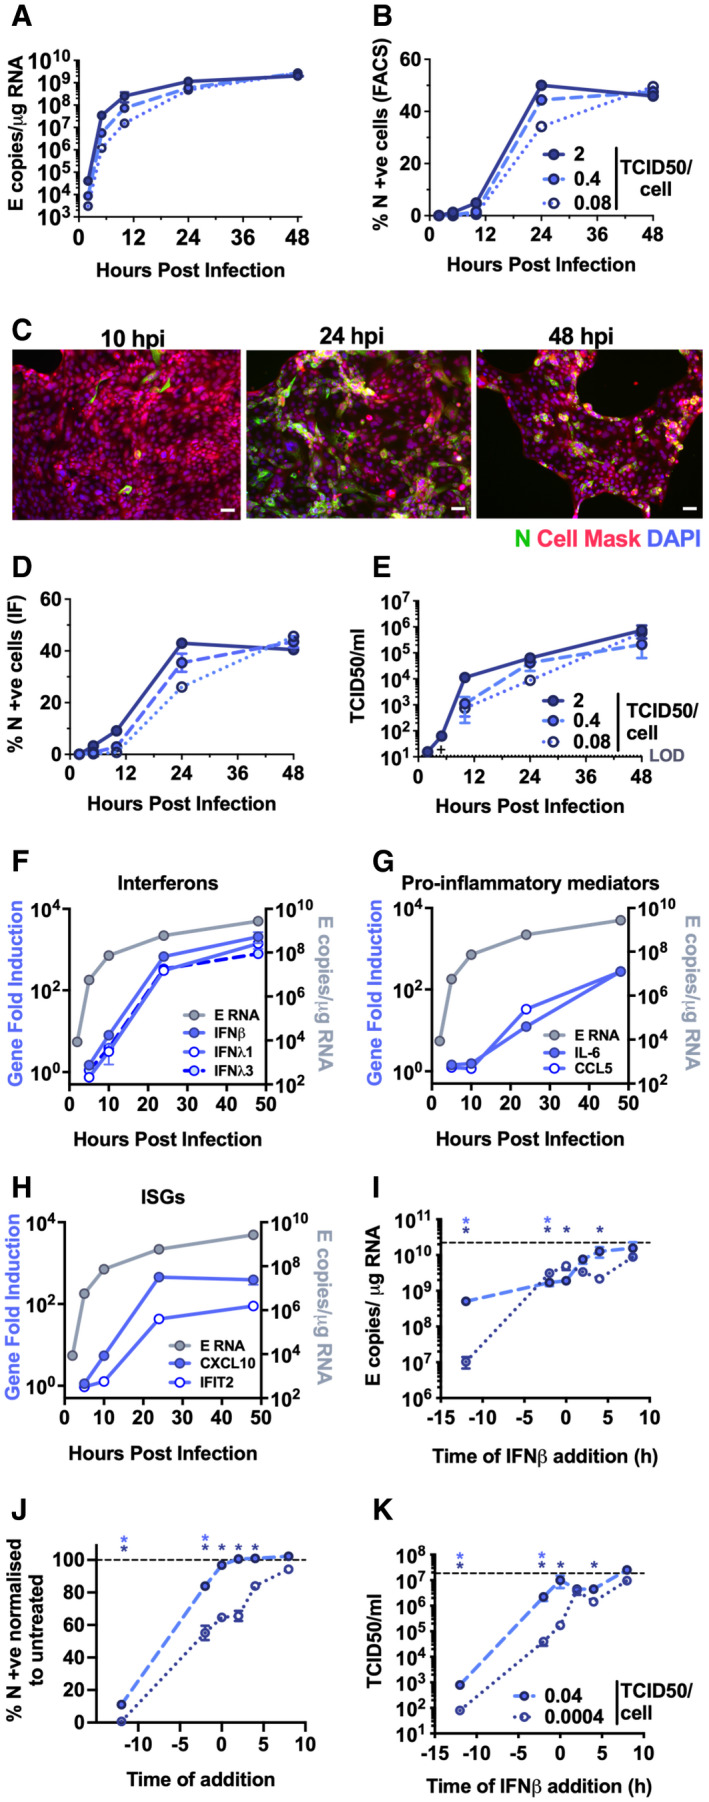
- A–H
Measurements of replication and innate immune induction in Calu‐3 lung epithelial cells infected with SARS‐CoV‐2 at MOIs 0.08, 0.4 and 2 TCID50VERO/cell. (A) Replication of SARS‐CoV‐2 genomic and subgenomic E RNAs (qRT–PCR). (B) Quantification of N staining from cells in (A) by flow cytometry. Mean percentage of N positive of all live‐gated cells is shown ± SEM, n = 2. (C) Representative example of immunofluorescence staining of N protein (green) after SARS‐CoV‐2 infection of Calu‐3 at MOI 0.4 TCID50VERO/cell, at time points shown. Nuclei (DAPI, blue), cell mask (red). Scale bar represents 50 µm. (D) Quantification of N staining in cells in (C) by immunofluorescence. (E) Infectious virus released from cells in (A) determined by TCID50 on Vero.E6 cells. (F‐H) Fold induction of (F) interferons (IFNβ, IFNλ1 and IFNλ3) (G) pro‐inflammatory mediators (IL‐6 and CCL5) or (H) IFN‐stimulated genes (CXCL10 and IFIT2) each overlaid with SARS‐CoV‐2 E (qRT‐PCR). All data from cells in (A) at MOI 0.4 TCID50VERO/cell. (A–H) Means from replicate wells shown ± SEM n = 2; full growth curve is representative of three independent experiments.
- I–K
SARS‐CoV‐2 infection (MOIs 0.04 (closed symbols) and 0.0004 (open symbols) TCID50VERO/cell) in Calu‐3 cells with addition of 10 ng/ml IFNβ before or after infection at time points shown, measured by (I) E RNA copies (J) N‐positive cells, (K) released virus (TCID50VERO/cell) all measured at 24 hpi. Dotted line indicates untreated. Mean ± SEM, n = 3, one‐way ANOVA light and dark blue * indicates significance for high and low MOIs, respectively.
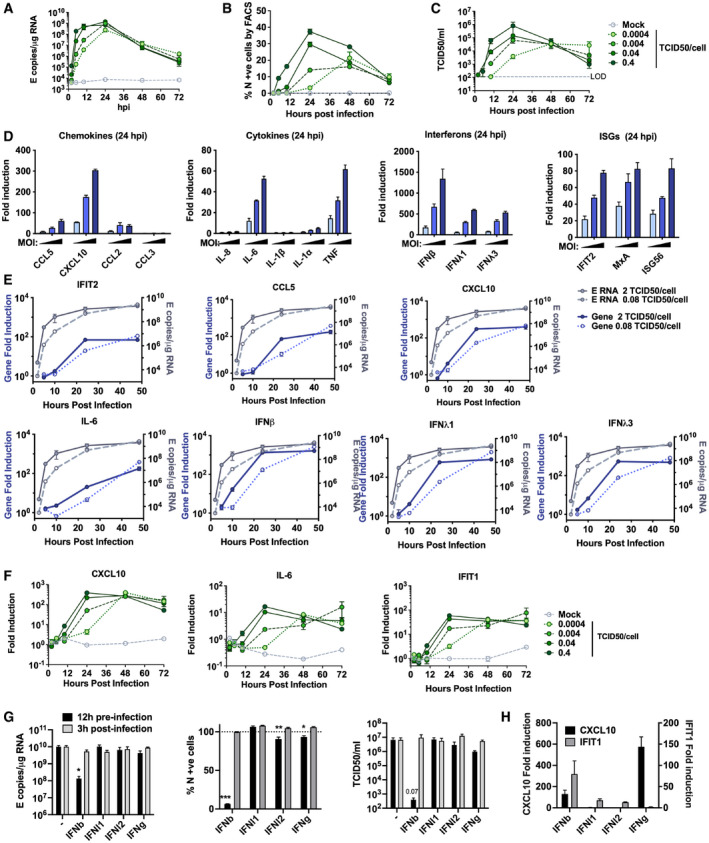
- A–C
Measurements of viral replication in Calu‐3 lung epithelial cells infected with SARS‐CoV‐2 at MOIs 0.0004, 0.004, 0.04 or 0.4 TCID50VERO/cell, n = 3. (A) Replication of SARS‐CoV‐2 genomic and subgenomic E RNAs (qRT‐PCR). (B) Quantification of N protein‐positive cells from (A) by flow cytometry. Mean percentage of N +ve of all live‐gated cells. (C) Infectious virus released from cells in (A) determined by TCID50 on Vero.E6 cells.
- D
Fold induction of chemokines from infections in (Fig 1) (CCL5, CXCL10, CCL2, CCL3), cytokines (IL‐8, IL‐6, IL‐1β, IL1α, TNF), Interferons (IFNβ, IFNλ1, IFNλ3) and ISGs (IFIT2, MX1, ISG56) at 24 hpi in Calu‐3 cells infected at MOIs 0.08, 0.4 or 2 TCID50VERO/cell, n = 2.
- E
Fold induction of IFIT2, CCL5, CXCL10, IL‐6, IFNβ, IFNλ1, IFNλ3 in Calu‐3 cells at MOI 0.08 or 2 TCID50VERO/cell each overlaid with SARS‐CoV‐2 E (qRT‐PCR), n = 2.
- F
Fold induction of CXCL10, IL‐6 and IFIT1 in SARS‐CoV‐2‐infected Calu‐3 cells from (A) at MOIs 0.0004, 0.004, 0.04 or 0.4 TCID50VERO/cell, n = 3.
- G
SARS‐CoV‐2 infection (MOIs 0.04 TCID50VERO/cell) in Calu‐3 cells after addition of 10 ng/ml IFNβ, IFNλ1, IFNλ2 or IFNγ before or after infection at time points shown, measured by E RNA copies, N‐positive cells (relative to untreated infection) and released virus as TCID50VERO/ml, all measured at 24 hpi. Treatments were compared to untreated SARS‐CoV‐2 infected Calu‐3 cells by t‐test. *P < 0.05; **P < 0.01; ***P < 0.001 or exact P‐value are shown. Mean ± SEM shown, n = 3.
- H
Fold induction of CXCL10 and IFIT1 in interferon‐treated Calu‐3 cells at 24 h. Means ± SEM, n = 3.
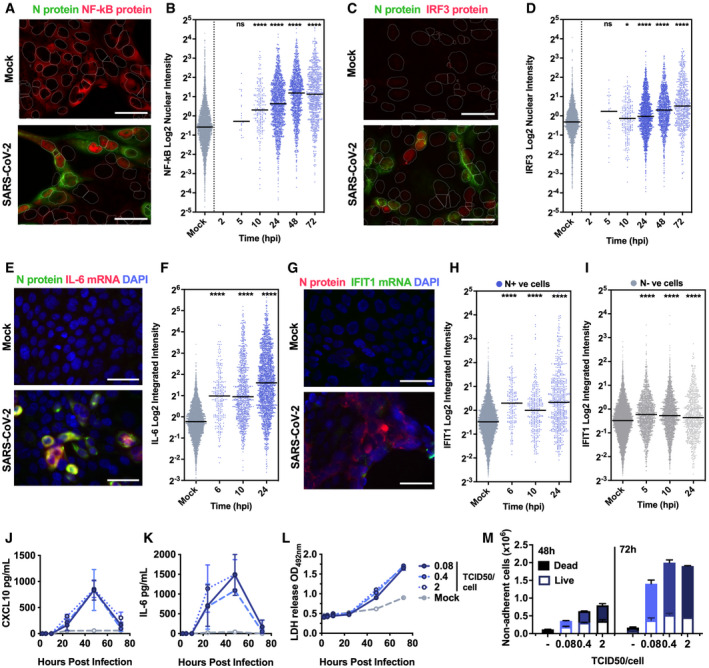
- A–I
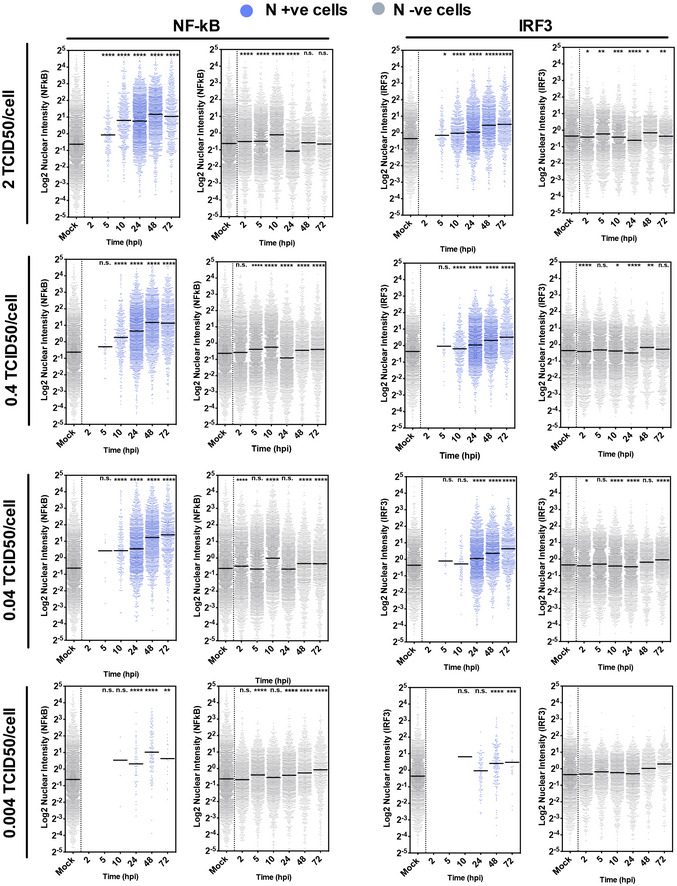
(A, C) Representative images of NF‐κB p65 (A) (red) and IRF3 (C) (red) nuclear localisation in mock or SARS‐CoV‐2‐infected (MOI 0.4 TCID50VERO/cell) Calu‐3 cells at 24 hpi. SARS‐CoV‐2 N protein (green). (E and G) Representative images of IL‐6 mRNA (E) detected by FISH (red) and N protein (green), or IFIT1 mRNA (G) (green) with N protein (red), both with nuclei (DAPI, blue) in mock or SARS‐CoV‐2‐infected (MOI 0.4 TCID50VERO/cell) Calu‐3 cells at 24 hpi. (B, D, F, H, I) Single‐cell analysis time course quantifying the integrated nuclear intensity of NF‐κB p65 (B), IRF3 (D), or overall integrated intensity for IL‐6 (F) or IFIT1 (H) mRNA over time in N protein‐positive cells and N protein‐negative cells (I). n = 2. Kruskal–Wallis test with Dunn’s multiple comparison. * (P < 0.05), **** (P < 0.0001). Scale bar represents 50 µm.
- J, K
Secretion of CXCL10 (J) and IL‐6 (K) by infected Calu‐3 cells (MOIs 0.08, 0.4 and 2 TCID50VERO/cell), (ELISA).
- L
Lactate dehydrogenase (LDH) release into culture supernatants by mock and SARS‐CoV‐2‐infected Calu‐3 cells (MOIs 0.08, 0.4 and 2 TCIDVERO50/cell) quantified absorbance (492nm).
- M
Quantification of live/dead staining of non‐adherent cells recovered from supernatants of mock or SARS‐CoV‐2‐infected Calu‐3 cultures at 48 and 72 hpi.
- A–D
Measurement of (A) viral genomic and subgenomic E RNA at 24 hpi, (B) fold induction of CXCL10 from (A), (C) IFIT2 and (D) IL‐6 mRNA (qRT‐PCR) from (A) after Remdesivir treatment (0.125–5 μM) of SARS‐CoV‐2‐infected Calu‐3 cells (MOI 0.04 TCID50/cell) with Remdesivir added 2 h prior to infection. Mean ± SEM, n = 3.
- E–H
Measurement of (E) viral genomic and subgenomic E RNA (F) fold induction of CXCL10, (G) IFIT2 and (H) IL‐6 at 24 hpi, of Calu‐3 cells with SARS‐CoV‐2 (MOI 0.04 TCID50VERO/cell) with Remdesivir treatment (5 μM) prior to, at the time of, or 8 h post‐infection. Mean ± SEM, n = 3, one‐way ANOVA with Dunnett’s multiple comparisons test to compare to untreated infected condition (“mock”), ** (P < 0.01), *** (P < 0.001), **** (P < 0.0001).
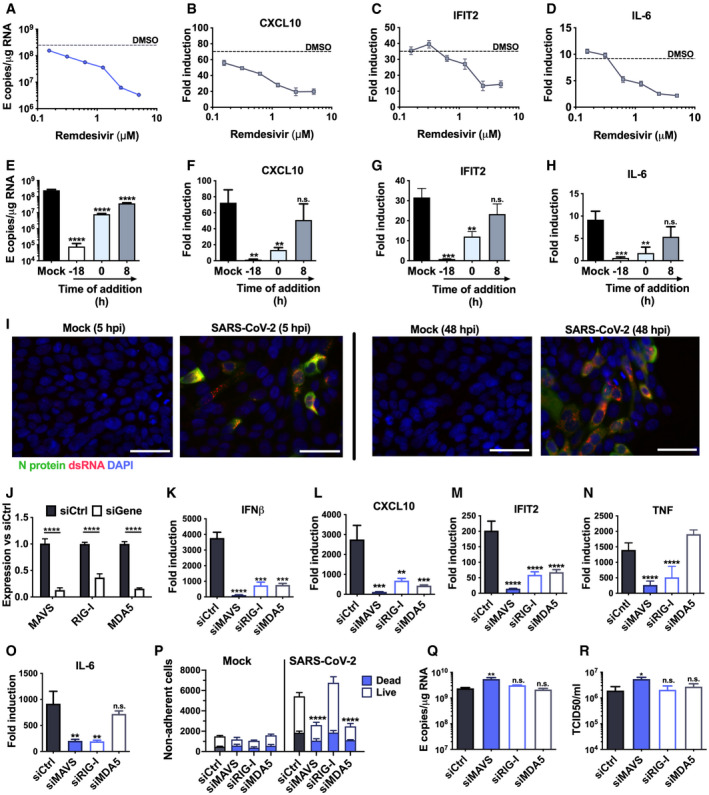
- I
Representative example of immunofluorescence staining of dsRNA (red) and N protein (green) after SARS‐CoV‐2 infection of Calu‐3 at MOI 0.4 TCID50VERO/cell, at time points shown. Nuclei (DAPI, blue). Scale bar represents 50 µm.
- J
RNAi mediated depletion of MAVS, RIG‐I or MDA5, reduced their expression levels as compared to siControl (siCtrl) Mean ± SEM, n = 3. Two‐way ANOVA with Sidak’s multiple comparisons test, **** (P < 0.0001).
- K–O
Fold induction of (K) IFNβ, (L) CXCL10, (M) IFIT2 (N) TNF and (O) IL‐6 in SARS‐CoV‐2 infected Calu‐3 cells (MOI 0.04 TCID50/cell) 24 hpi. Mean ± SEM, n = 3, and compared to siCtrl for each gene by one‐way ANOVA with Dunnett’s multiple comparisons test, ** (P < 0.01), *** (P < 0.001), **** (P < 0.0001), n.s. : non‐significant.
- P
Live/dead stain counts for non‐adherent cells, recovered at 48 hpi from supernatants of SARS‐CoV‐2 infected Calu‐3 cells, depleted for MAVS or RNA sensors, compared to siCtrl. Non‐adherent cell counts were determined by acquisition by flow cytometry for a defined period of time. Mean +/‐SEM, n = 3. Total numbers are compared with siCtrl by unpaired t‐test, *** (P < 0.001).
- Q–R
Viral E RNA and (R) released infectious virus (TCID50VERO/cell) at 24 hpi of infected Calu‐3 cells depleted for MAVs, RIG‐I or MDA5. Mean ± SEM, n = 3. Each group compared to siCtrl by one‐way ANOVA with Dunnett’s multiple comparisons test, *P > 0.05, ** (P < 0.01), n.s : non‐significant.
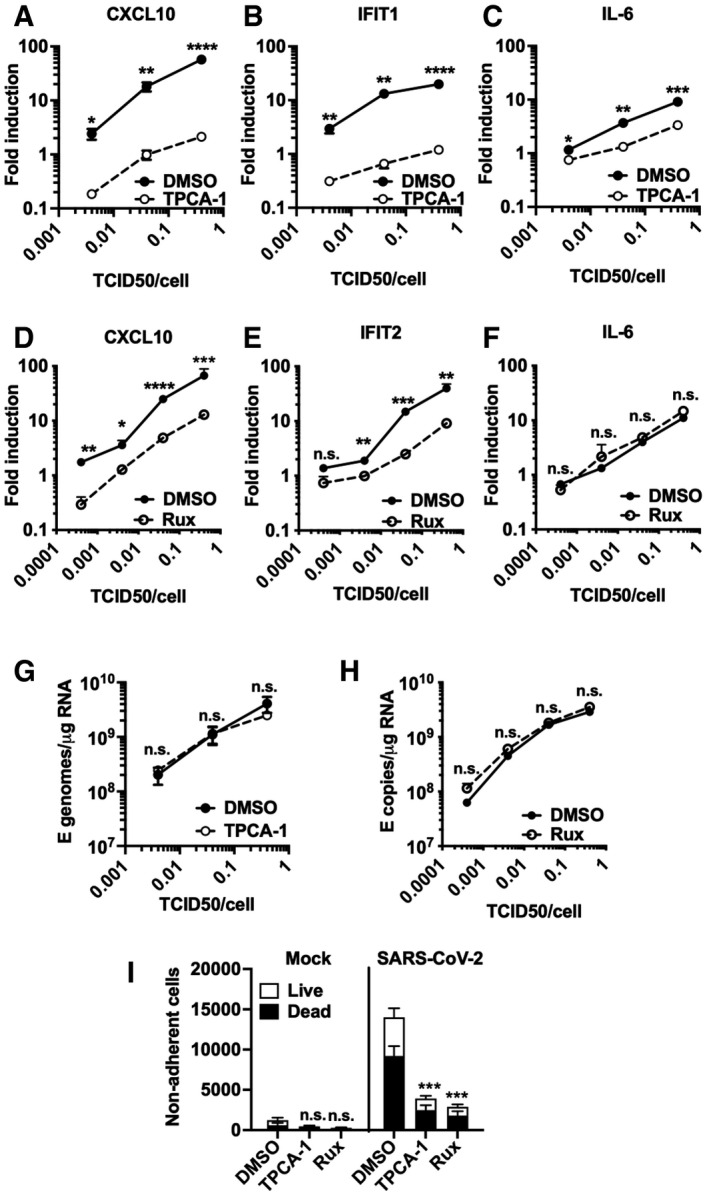
- A–C
Fold induction at 24 hpi of (A) CXCL10, (B) IFIT1 or (C) IL‐6 mRNA (qRT‐PCR) after Calu‐3 infection with SARS‐CoV‐2 over a range of MOIs (0.004, 0.04, 0.4 TCID50VERO/cell) in the presence of 10 μM TPCA‐1 or DMSO as shown.
- D–F
Fold induction at 24 hpi of (D) CXCL10, (E) IFIT2 or (F) IL‐6 mRNA (RT–qPCR) after Calu‐3 infection with SARS‐CoV‐2 over a range of MOIs (0.0004, 0.004, 0.04, 0.4 TCID50VERO/cell) in the presence of 2 μM Ruxolitinib (Rux) or DMSO as shown.
- G, H
Viral genomic and subgenomic E RNA at 24 hpi (RT–qPCR) with DMSO or TPCA (G) or Rux (H) treatment.
- I
Live/dead stain count from non‐adherent cells recovered from supernatants of SARS‐CoV‐2‐infected Calu‐3 cultures (MOI 0.04 TCID50VERO/cell) 48 hpi (flow cytometry). Mean ± SEM, (n = 3). One‐way ANOVA comparison of inhibitor‐treated infected cells to mock‐treated infected cells. *** (P < 0.001).
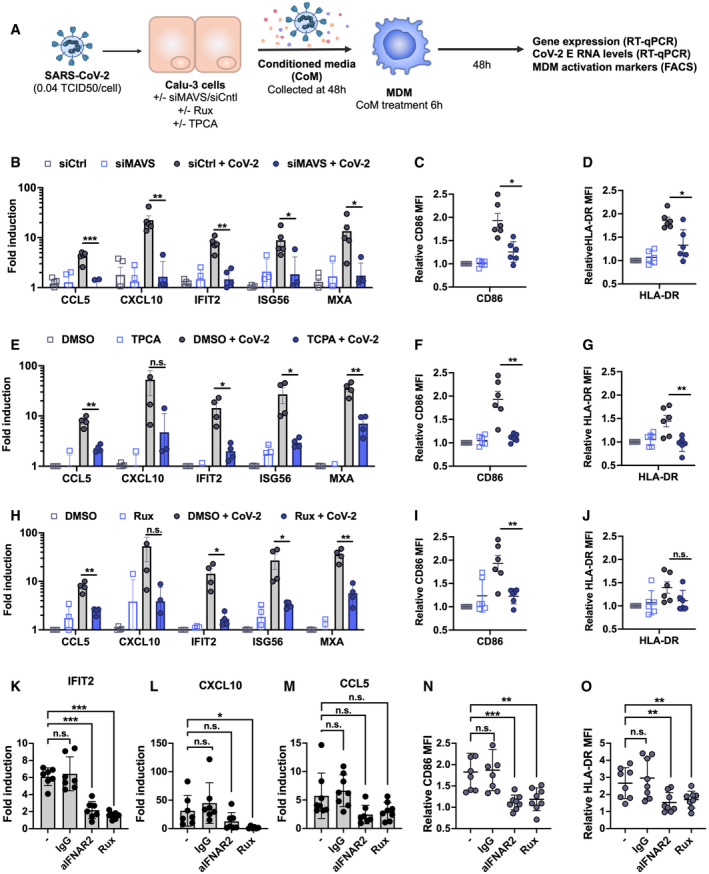
- A
Schematic of experimental design.
- B–J
Calu‐3 cells were transfected with siRNA targeting MAVS or non‐targeting control (siCtrl) (B‐D) or treated with DMSO vehicle or inhibitors 10 μM TPCA‐1 (E‐G) or 2 μM Ruxolitinib (Rux) (H‐J) as shown, and were mock‐infected or infected with SARS‐CoV‐2 at MOI 0.04 TCID50VERO/cell. Virus‐containing conditioned media (CoM) was harvested at 48 hpi. MDM were treated with Calu‐3 virus‐containing CoM for 6 hpi, before washing and measuring MDM gene expression (B, E, H), and MDM activation markers by flow cytometry 48 h later (C, D, F, G, I, J), plotting relative median fluorescent intensity (MFI) compared with mock‐infected siCtrl (C, D) or mock‐infected DMSO control (F, G, I, J). Legends in (B), (E) and (H) apply to (C, D), (F, G) and (I, J), respectively. The inhibitors in (E) and (H) were tested side‐by‐side with the same mock condition. Mean ± SEM shown, data from 4 to 6 independent MDM donors are shown. Statistical comparison by two‐tailed paired t‐test comparing MDM exposed to control infected CoM to siMAVS/inhibitor‐treated infected CoM. * (P < 0.05), ** (P < 0.01), *** (P < 0.001).
- K–O
MDM were treated with either anti‐IFNAR antibody (2.5 µg/ml), an isotype control IgG antibody (IgG, 2.5 µg/ml), Rux (2 μM) or mock treated during 6 h of exposure to CoM from infected, unmodified Calu‐3 cells, before washing and measuring MDM gene expression (K, L, M), and MDM activation markers (N, O) by flow cytometry 48 h later. Both gene expression and relative MFI are compared with mock‐treated MDM exposed to CoM from uninfected Calu‐3 cells. Mean ± SEM shown, data from 7 to 8 independent MDM donors are shown. Statistical testing by one‐way paired ANOVA, comparing treated MDMs to untreated control by Dunnett’s multiple comparison test, * (P < 0.05), ** (P < 0.01), *** (P < 0.001).
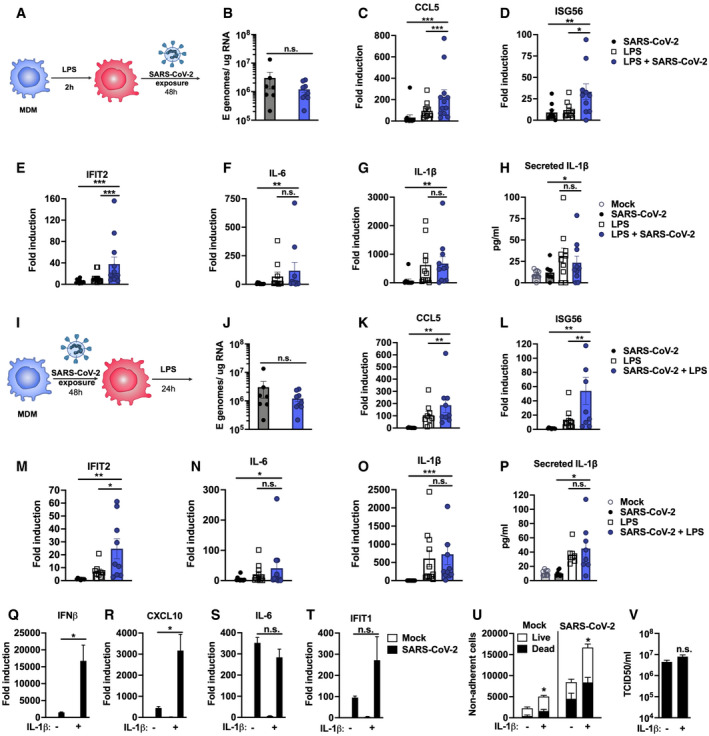
- A
Schematic of experimental design.
- B–H
MDM were primed with 100 ng/ml LPS for 2 h before exposure to SARS‐CoV‐2 (MOI 0.02 TCID50VERO/cell). (B) Expression of genomic and subgenomic viral E RNA at 48 h post‐exposure in indicated conditions. (C‐G) Host gene expression of (C) CCL5, (D) ISG56, (E) IFIT2, (F) IL‐6 or (G) IL‐1β mRNA was measured 48 hpi. (H) IL‐1β secretion was detected in culture supernatants at 48 hpi by ELISA.
- I
Schematic of experimental design. MDM were exposed to SARS‐CoV‐2 (MOI 0.02 TCID50VERO/cell) for 48 h and subsequently stimulated with 100 ng/ml LPS for 24 h.
- J–P
(J) Expression of genomic and subgenomic viral E RNA 72 h post‐exposure in indicated conditions. (K–O) Host gene expression of (K) CCL5, (L) ISG56, (M) IFIT2, (N) IL‐6 and (O) IL‐1β mRNA. (P) IL‐1β secretion was detected in culture supernatants at 48 hpi by ELISA.
- Q–V
Calu‐3 cells were infected with SARS‐CoV‐2 (MOI 0.04 TCID50VERO/cell) in the presence or absence of 10 ng/ml IL‐1β. (Q‐T) Gene expression of (Q) IFNβ, (R) CXCL10, (S) IL‐6 and (T) IFIT1 mRNA was measured after 24 h. Fold induction over untreated mock infection is shown, n = 3. (U) Non‐adherent cells were collected at 48 h post‐infection and live/dead stained. Cells were acquired by flow cytometry and cell counts determined by time‐gating. For statistical comparison, total cell numbers were compared. (V) Viral release into culture supernatants at 24 h was measured by TCID50 on VeroE6 cells. (Q‐V) Mock‐ and SARS‐CoV‐2‐infected conditions were compared with or without IL1b‐treatment, respectively, by unpaired t‐test (n = 3). *P < 0.05; n.s., non‐significant. Mean ± SEM shown.
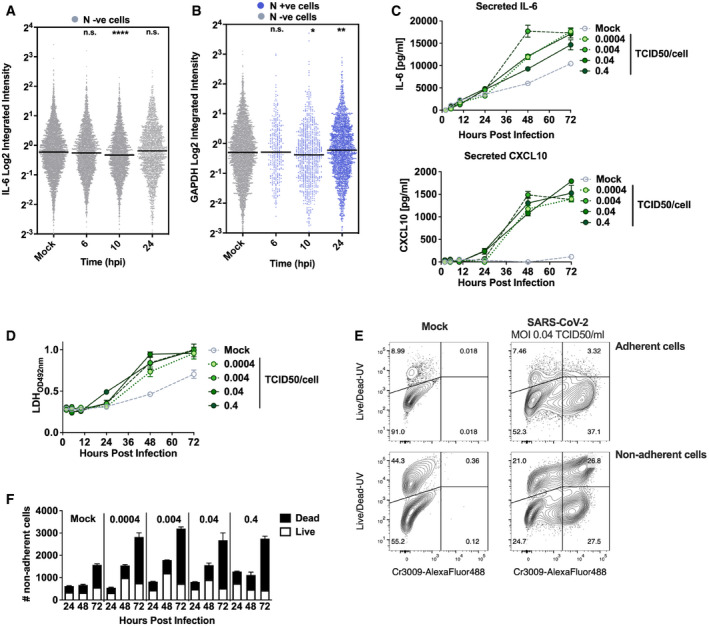
Representative single‐cell RNA‐FISH analysis time course quantifying the integrated intensity of IL‐6 in uninfected (Mock) or uninfected bystander cells (uninfected cells, grey) of Calu‐3 cells infected at MOI 0.4 TCID50/cell.
Representative single‐cell RNA‐FISH analysis time course quantifying the integrated intensity of GAPDH in uninfected (Mock), nucleocapsid protein‐positive infected (blue) and uninfected bystander (grey) Calu‐3 cells at MOI 0.4 TCID50/cell. (A, B) Horizontal lines indicate the median with Kruskal–Wallis test with Dunn’s multiple comparison, *P < 0.05; **P < 0.01; ***P < 0.001.
Secretion of IL
‐ 6 and CXCL10 (ELISA) by infected Calu‐3 cells (MOIs 0.0004, 0.004, 0.04 and 0.4 TCID50VERO/cell), matching infections in Fig EV2A–C and F. Mean ± SEM, n = 3.Lactate dehydrogenase (LDH) release into culture supernatants by mock and SARS‐CoV‐2‐infected Calu‐3 cells (MOIs 0.0004, 0.004, 0.04 and 0.4 TCID50VERO/cell, matching infections in Fig 2A–C and F) quantified by absorbance (492nm), means ± SEM, n = 3.
Representative flow cytometry contour plots depicting intracellular nucleocapsid protein detection (Cr3009‐AlexaFluor 488) and Live/Dead (Live/Dead‐UV) staining. Shown are infected (MOI 0.04 TCID50 VERO /cell) and uninfected (Mock) Calu‐3 cells at 48 h post‐infection. Adherent and non‐adherent cells were collected and acquired.
Quantification of Live/Dead staining of non‐adherent cells recovered from supernatants of Mock or SARS‐CoV‐2‐infected Calu‐3 cultures (MOIs 0.0004, 0.004, 0.04 and 0.4 TCID50VERO/cell) at 24, 48 or 72 hpi. Mean ± SEM, n = 3.
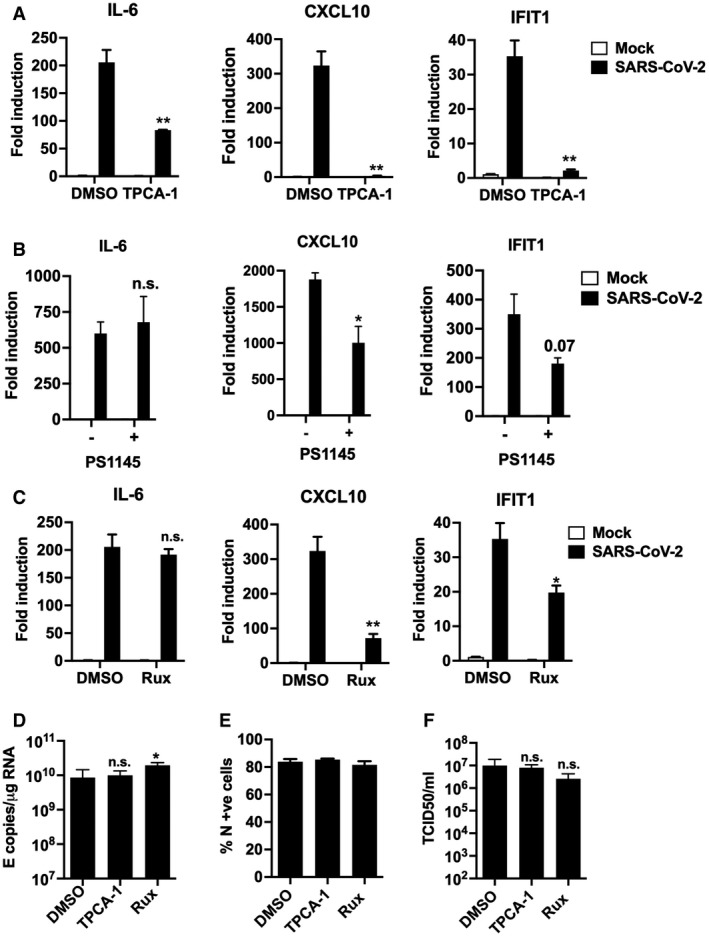
- A–C
Fold gene induction of IL‐6, CXCL10 and IFIT1 24 hpi of Calu‐3 with SARS‐CoV‐2 (MOI 0.04 TCID50VERO/cell) infected in the presence of: (A) 10 μM TPCA‐1 (B) 10 μM PS1145 or (C) 10 μM Ruxolitinib (Rux) with DMSO as control in each case.
- D–F
Measurement of SARS‐CoV‐2 (MOI 0.04 TCID50VERO/cell) replication in Calu‐3 in the presence or absence of 10 μM TPCA‐1, 10 μM Ruxolitinib (Rux) or DMSO vehicle as shown measuring (D) genomic and subgenomic E RNA, (E) N +ve cells by flow cytometry, (F) released virus in supernatant (TCID50VERO/cell) at 24 hpi. Mock and SARS‐CoV‐2‐infected/treated conditions were compared by two‐tailed t‐test. *P < 0.05; **P < 0.01; n.s., non‐significant. Mean ± SEM, n = 3.
References
-
- Azhar EI, El‐Kafrawy SA, Farraj SA, Hassan AM, Al‐Saeed MS, Hashem AM, Madani TA (2014) Evidence for camel‐to‐human transmission of MERS coronavirus. N Engl J Med 370: 2499–2505 - PubMed
Publication types
MeSH terms
Substances
Grants and funding
LinkOut - more resources
Full Text Sources
Medical
Miscellaneous
