

Impact of errors in spot size and spot position in robustly optimized pencil beam scanning proton-based stereotactic body radiation therapy (SBRT) lung plans
- PMID: 34101334
- PMCID: PMC8292703
- DOI: 10.1002/acm2.13293
Impact of errors in spot size and spot position in robustly optimized pencil beam scanning proton-based stereotactic body radiation therapy (SBRT) lung plans
Abstract
Purpose: The purpose of the current study was threefold: (a) investigate the impact of the variations (errors) in spot sizes in robustly optimized pencil beam scanning (PBS) proton-based stereotactic body radiation therapy (SBRT) lung plans, (b) evaluate the impact of spot sizes and position errors simultaneously, and (c) assess the overall effect of spot size and position errors occurring simultaneously in conjunction with either setup or range errors.
Methods: In this retrospective study, computed tomography (CT) data set of five lung patients was selected. Treatment plans were regenerated for a total dose of 5000 cGy(RBE) in 5 fractions using a single-field optimization (SFO) technique. Monte Carlo was used for the plan optimization and final dose calculations. Nominal plans were normalized such that 99% of the clinical target volume (CTV) received the prescription dose. The analysis was divided into three groups. Group 1: The increasing and decreasing spot sizes were evaluated for ±10%, ±15%, and ±20% errors. Group 2: Errors in spot size and spot positions were evaluated simultaneously (spot size: ±10%; spot position: ±1 and ±2 mm). Group 3: Simulated plans from Group 2 were evaluated for the setup (±5 mm) and range (±3.5%) errors.
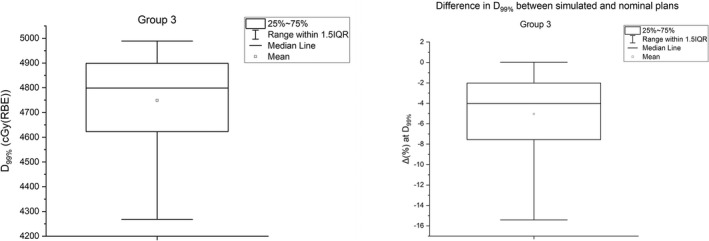
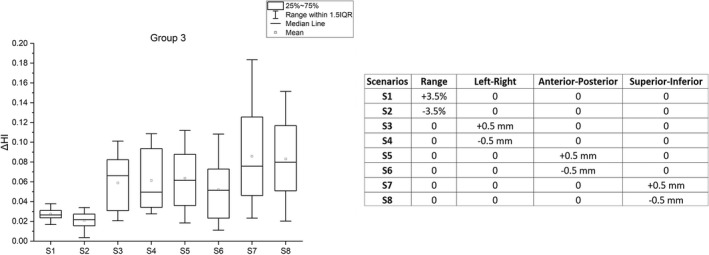
Results: Group 1: For the spot size errors of ±10%, the average reduction in D99% for -10% and +10% errors was 0.7% and 1.1%, respectively. For -15% and +15% spot size errors, the average reduction in D99% was 1.4% and 1.9%, respectively. The average reduction in D99% was 2.1% for -20% error and 2.8% for +20% error. The hot spot evaluation showed that, for the same magnitude of error, the decreasing spot sizes resulted in a positive difference (hotter plan) when compared with the increasing spot sizes. Group 2: For a 10% increase in spot size in conjunction with a -1 mm (+1 mm) shift in spot position, the average reduction in D99% was 1.5% (1.8%). For a 10% decrease in spot size in conjunction with a -1 mm (+1 mm) shift in spot position, the reduction in D99% was 0.8% (0.9%). For the spot size errors of ±10% and spot position errors of ±2 mm, the average reduction in D99% was 2.4%. Group 3: Based on the results from 160 plans (4 plans for spot size [±10%] and position [±1 mm] errors × 8 scenarios × 5 patients), the average D99% was 4748 cGy(RBE) with the average reduction of 5.0%. The isocentric shift in the superior-inferior direction yielded the least homogenous dose distributions inside the target volume.
Conclusion: The increasing spot sizes resulted in decreased target coverage and dose homogeneity. Similarly, the decreasing spot sizes led to a loss of target coverage, overdosage, and degradation of dose homogeneity. The addition of spot size and position errors to plan robustness parameters (setup and range uncertainties) increased the target coverage loss and decreased the dose homogeneity.
Keywords: Monte Carlo; SBRT; lung cancer; proton therapy; robust optimization; robustness; spot position; spot size.
© 2021 The Authors. Journal of Applied Clinical Medical Physics published by Wiley Periodicals LLC on behalf of American Association of Physicists in Medicine.
Conflict of interest statement
The authors do not have any relevant conflict of interest to disclose.
Figures


References
-
- Parodi K, Mairani A, Brons S, et al. The influence of lateral beam profile modifications in scanned proton and carbon ion therapy: a Monte Carlo study. Phys Med Biol. 2010;55:5169–5187. - PubMed
-
- Rana S, Rosenfeld AB. Parametrization of in‐air spot size as a function of energy and air gap for the ProteusPLUS pencil beam scanning proton therapy system. Radiol Phys Technol. 2020;13:392–397. - PubMed
-
- Peterson S, Polf J, Ciangaru G, Frank SJ, Bues M, Smith A. Variations in proton scanned beam dose delivery due to uncertainties in magnetic beam steering. Med Phys. 2009;36:3693–3702. - PubMed
-
- Yu J, Beltran CJ, Herman MG. Implication of spot position error on plan quality and patient safety in pencil‐beam‐scanning proton therapy. Med Phys. 2014;41:081706. - PubMed
-
- Chanrion MA, Ammazzalorso F, Wittig A, Engenhart‐Cabillic R, Jelen U. Dosimetric consequences of pencil beam width variations in scanned beam particle therapy. Phys Med Biol. 2013;58:3979–3993. - PubMed
MeSH terms
Substances
LinkOut - more resources
Full Text Sources
Medical
