

Neural G0: a quiescent-like state found in neuroepithelial-derived cells and glioma
- PMID: 34101353
- PMCID: PMC8186478
- DOI: 10.15252/msb.20209522
Neural G0: a quiescent-like state found in neuroepithelial-derived cells and glioma
Abstract
Single-cell RNA sequencing has emerged as a powerful tool for resolving cellular states associated with normal and maligned developmental processes. Here, we used scRNA-seq to examine the cell cycle states of expanding human neural stem cells (hNSCs). From these data, we constructed a cell cycle classifier that identifies traditional cell cycle phases and a putative quiescent-like state in neuroepithelial-derived cell types during mammalian neurogenesis and in gliomas. The Neural G0 markers are enriched with quiescent NSC genes and other neurodevelopmental markers found in non-dividing neural progenitors. Putative glioblastoma stem-like cells were significantly enriched in the Neural G0 cell population. Neural G0 cell populations and gene expression are significantly associated with less aggressive tumors and extended patient survival for gliomas. Genetic screens to identify modulators of Neural G0 revealed that knockout of genes associated with the Hippo/Yap and p53 pathways diminished Neural G0 in vitro, resulting in faster G1 transit, down-regulation of quiescence-associated markers, and loss of Neural G0 gene expression. Thus, Neural G0 represents a dynamic quiescent-like state found in neuroepithelial-derived cells and gliomas.
Keywords: G0; glioma; neural stem cells; quiescence; scRNA-seq.
© 2021 The Authors. Published under the terms of the CC BY 4.0 license.
Conflict of interest statement
The authors declare that they have no conflict of interest.
Figures
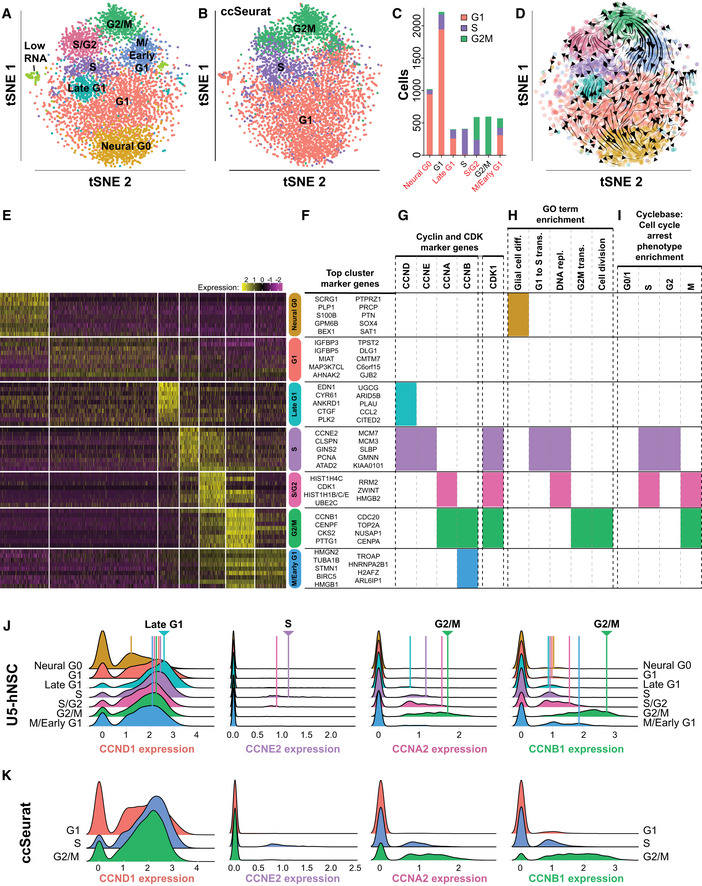
Eight transcriptional clusters were discovered from unsorted U5‐hNSCs using an unsupervised graph‐based clustering method. Single cells were embedded into a two‐dimensional space for visualization using t‐Distributed Stochastic Neighbor Embedding (tSNE).
The ccSeurat classifier was applied to the unsorted U5‐hNSCs. The G1, S, and G2M phase calls were overlaid onto the tSNE embedding.
The number of cells for each U5‐hNSC defined cell cycle phase colorized by the three ccSeurat classifier phases. Names for new U5‐hNSC defined cell cycle phases are red.
RNA velocity stream plot for U5‐hNSCs shows the directional flow of cells through the phases of the cell cycle (i.e., G1 → Late G1 → S → S/G2 → G2/M → M/Early G1 → G1) and into the novel Neural G0 phase.
Heat map of the relative expression (row‐wise z‐score) for the top 10 non‐redundant genes for each prominent cluster in U5‐NSCs and gene ontology analysis of the up‐regulated genes defining each cluster.
Top marker genes for each cluster.
Cyclin and CDK marker genes found for each cluster.
Functional GO term enrichment for key cell cycle‐related and “glial cell differentiation” terms. Full cluster‐defining gene list is in Dataset EV1, and full gene ontology is in Dataset EV2.
Enrichment of knockdown cell cycle arrest phenotype genes for each cluster.
Ridge graph comparisons of cyclin expression across the U5‐hNSC defined cell cycle phases. The x‐axis is relative expression of the cyclin, and the y‐axis is counts of cells per phase. The cell cycle phase with the peak expression is denoted by an arrowhead at the top of the plot.
Ridge graph comparison of cyclin expression across the Seurat‐classified cell cycle phases. The x‐axis is relative expression of the cyclin, and the y‐axis is counts of cells per phase.
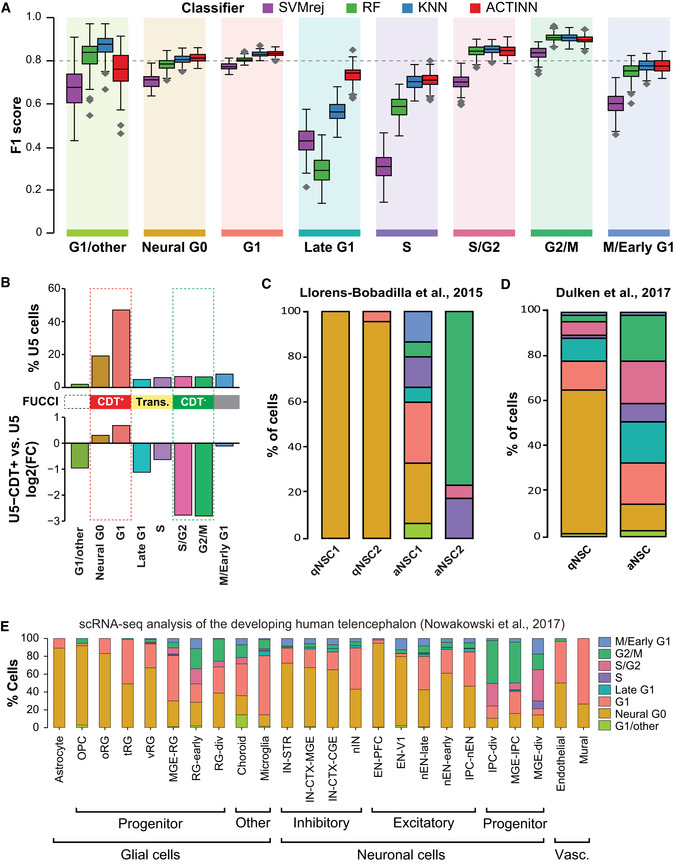
Comparison of four different classifier methods (SVMrej, RF, KNN, and ACTINN) by F1 score, which is a metric that integrates precision and recall and reaches its maximum value at 1. An F1 score is computed for each cell cycle phase to be predicted, and the boxplots represent the distribution of F1 scores from the 100‐fold cross‐validation with a hold‐out of 1,000 cells. Each boxplot shows the median (middle band), interquartile range (box), and the whiskers denote 1.5 times the interquartile range of the 100 F1 scores from the cross‐validation.
Top, percent of cells found in each cluster for the U5‐hNSCs. Middle, mapping of FUCCI reporter system to cell cycle phases. Bottom, fold‐change between U5‐hNSCs sorted for CDT+ compared to unsorted U5‐hNSC cells on the log base 2 scale. Positive values indicate an increase in a given cell cycle subpopulation in CDT+ sorted relative to unsorted, and negative values indicate reduced cell subpopulations. The expected CDT+ and CDT− cell subpopulations are found below the red bar and green bar, respectively. The others are expected to be transition subpopulations.
Percent of cells assigned to each ccAF cell cycle phase for scRNA‐seq data from GLAST and PROM1 flow‐sorted cells from the subventricular zone (SVZ) of mice (Llorens‐Bobadilla et al, 2015). qNSC1 = dormant quiescent neural stem cell; qNSC2 = primed‐quiescent neural stem cell; aNSC1 = active neural stem cell; aNSC2 = actively dividing neural stem cell.
Percent of cells assigned to each ccAF cell cycle phase for scRNA‐seq data from EGFR, GFAP, and PROM1 flow‐sorted cells from the subventricular zone (SVZ) of adult mice (Dulken et al, 2017). qNSC = quiescent neural stem cell; aNSC = active neural stem cell.
Percent of cells assigned to each ccAF cell cycle phase for scRNA‐seq data from the developing human telencephalon (Nowakowski et al, 2017). Cell types were grouped by glial, neuronal, and vascular developmental cell lineages and ordered in each group by most to least differentiated (left to right). RG = radial glia, div = dividing. All cell type abbreviations are available in Dataset EV4.
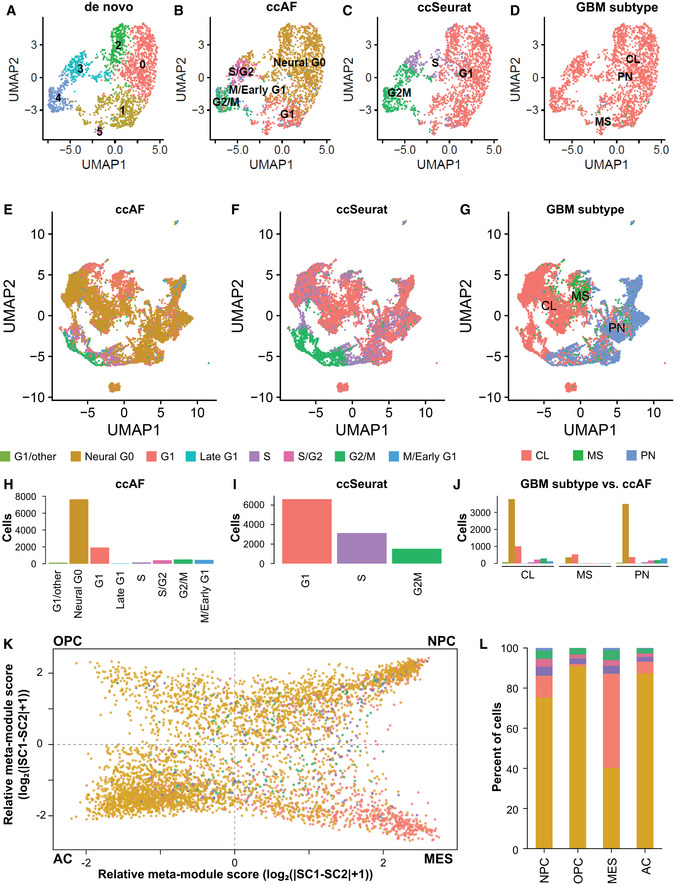
De novo clustering of all cells from patient MGH143 (Neftel et al, 2019; n = 2,182 cells).
ccAF applied to all cells from patient MGH143 matches well to de novo clustering.
ccSeurat applied to all cells from patient MGH143 matches well to de novo clustering, but has S phase in between G2 M and G1, similar to what was observed in HEK293T (Appendix Fig S4).
GBM subtypes of all cells from patient MGH143 show that the vast majority of cells are from the classical subtype.
Application of the ccAF classifier to primary GBM neoplastic cells from Neftel et al, 2019 overlaid on a two‐dimensional UMAP cell embedding (n = 11,376).
Application of the ccSeurat classifier to primary GBM neoplastic cells from Neftel et al, 2019 overlaid on a two‐dimensional UMAP cell embedding (n = 11,376).
Application of the ssGSEA GBM subtype classifier to primary GBM neoplastic cells from Neftel et al, 2019 overlaid on a two‐dimensional UMAP cell embedding (n = 11,376). CL = classical; MS = mesenchymal; PR = proneural.
Tabulation of cell counts for ccAF cell cycle phase classifications in E.
Tabulation of cell counts for ccSeurat cell cycle phase classifications in F.
Tabulation of cell counts for ccAF cell cycle phase classifications for each GBM subtype. CL = classical; MS = mesenchymal; PR = proneural.
Two‐dimensional embedding representing cellular state from Neftel et al, 2019 (Fig 3F), where each quadrant represents a different cellular state oligodendrocyte progenitor cell‐like (OPC), neural progenitor cell‐like (NPC), mesenchymal‐like (MES), and astrocyte‐like (AC).
Tabulation of cell counts for ccAF cell cycle phase classifications in each quadrant of K (OPC‐like, NPC‐like, MES‐like, and AC‐like).
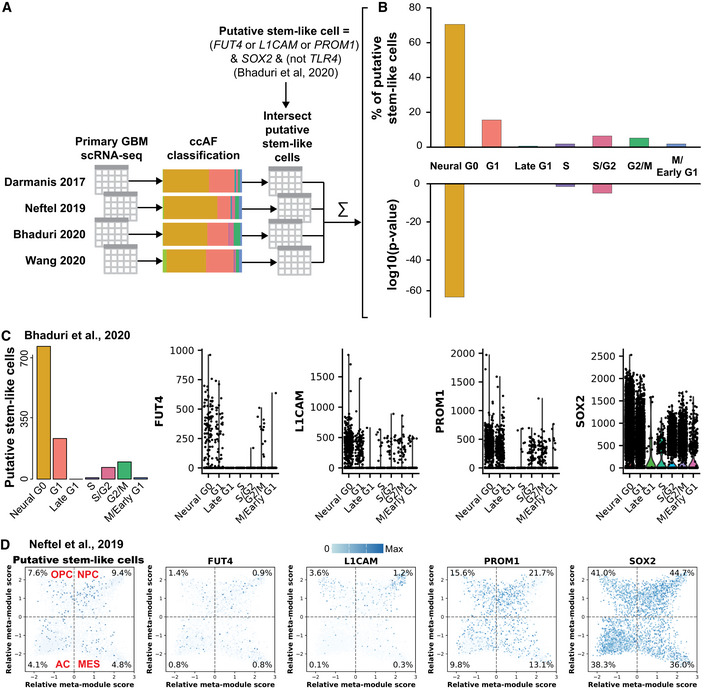
The ccAF classifier was applied to four GBM scRNA‐seq datasets with a total of 47,169 cells (Darmanis et al, 2017; Neftel et al, 2019; Bhaduri et al, 2020; Wang et al, 2020). We then applied the logic for discovering putative stem‐like cells from Bhaduri et al, 2020 to all 47,169 cells: (FUT4 > 0 or L1CAM > 0 or PROM1 > 0) & SOX2 > 0 & (TLR4 = 0). The subpopulation of cells from each ccAF cell cycle phase was intersected with the putative stem‐like cell subpopulation. The resulting intersections for each dataset were summed and a hypergeometric enrichment P‐value was computed for each ccAF cell cycle phase comparison.
Top, Percentage of putative stem‐like cells that map to each ccAF cell cycle phase. Bottom, Log 10 of hypergeometric enrichment P‐values for each ccAF cell cycle phase. More negative values indicate increased significance.
Number of putative stem‐like cells in each ccAF cell cycle phase, and distribution of absolute gene expression across ccAF cell cycle phases for the genes used to identify putative stem‐like cells in Bhaduri et al, 2020.
Putative stem‐like cells and expression of the genes used to identify the putative stem‐like cells projected onto Neftel et al, 2019. Expression of genes is overlaid as the color of each cell (white = 0, dark blue = max expression). Quadrants are broken up by dashed gray lines: OPC = upper left; NPC = upper right; AC = lower left; and MES = lower right. Percentages of gene expression greater than 0 are shown in the corners of the plot.
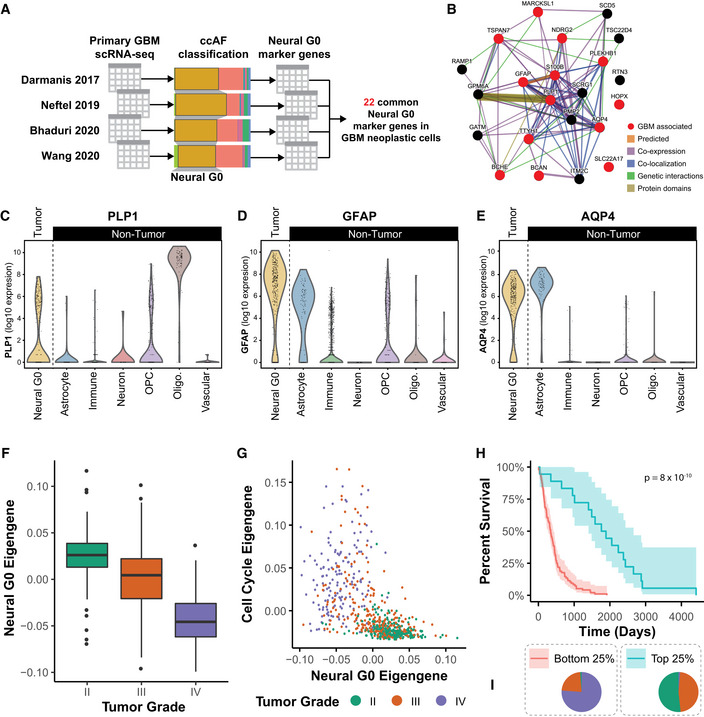
A GBM‐specific Neural G0 expression signature was developed using four GBM scRNA‐seq datasets with a total of 47,169 cells (Darmanis et al, 2017; Neftel et al, 2019; Bhaduri et al, 2020; Wang et al, 2020). The ccAF classifier was applied to each dataset, marker genes were discovered for the Neural G0 phase in each dataset, and 22 common marker genes were identified between all four datasets.
A network showing the inter‐relatedness of the 22 common GBM‐specific Neural G0 marker genes. Genes with red circles were previously known to be associated with GBM in the DisGeNET database.
Violin plot showing PLP1 expression across all cell types from Darmanis et al, 2017. Data are log 10‐transformed before plotting. Expression of PLP1 in single cells is much higher in oligodendrocytes (Oligo) than in Neural G0 or oligodendrocyte progenitor cells (OPC).
Violin plot showing GFAP expression across all cell types from Darmanis et al, 2017. Data are log 10‐transformed before plotting. Expression of GFAP in single cells is more highly expressed in Neural G0 relative to all other cell types.
Violin plot showing AQP4 expression across all cell types from Darmanis et al, 2017. Data are log 10‐transformed before plotting. Neural G0 expression of AQP4 in single cells is similar to astrocytes but has a lower median expression and lower upper limit.
Relative neural G0 eigengene expression between grade II (n = 226), III (n = 244), and IV (n = 150) tumors (TCGA; LGG and GBM). An eigengene represents the common variation across each patient tumor for the Neural G0 genes, i.e., first principal component corrected for direction if necessary. All pairwise Student's t‐tests comparisons had P‐values < 0.003.
Comparison of cell cycle (54 genes annotated to the Seurat G2 M classifier gene list) and Neural G0 eigengene relative expression in each glioma. Each tumor is colored by its grade (green = II, red = III, and purple = IV).
Kaplan–Meier survival plot of tumors with top 25% (n = 171) and bottom 25% (n = 171) of Neural G0 eigengene expression of Neural G0 genes. A Fleming–Harrington survival P‐value was used to determine significance. Shaded region is the 95% confidence interval for the survival curve.
Distribution of tumor grade between tumors with top 25% and bottom 25% of Neural G0 eigengene expression.
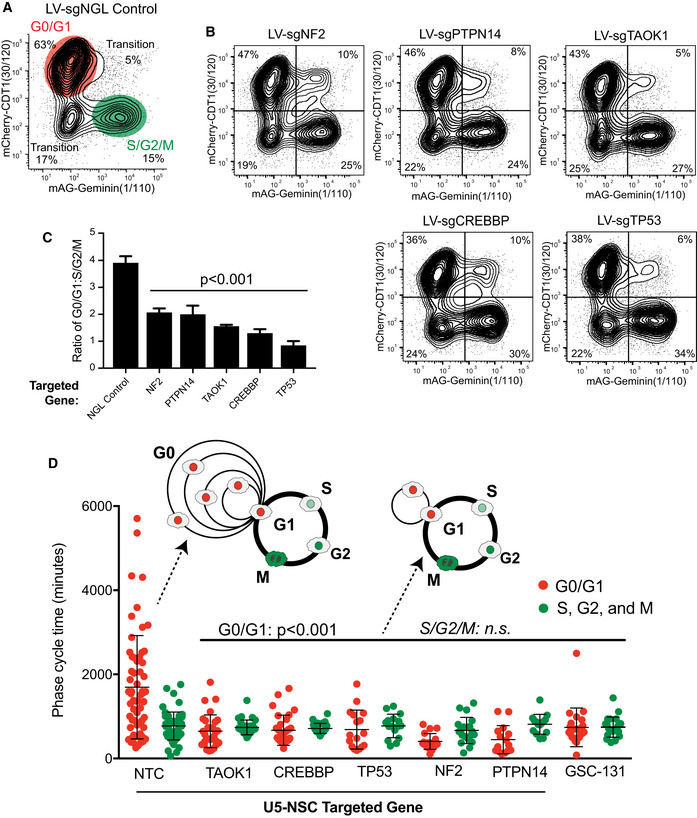
Representative contour plot of flow cytometry for FUCCI (Sakaue‐Sawano et al, 2008) in U5‐NSCs after targeting of a non‐growth limiting (NGL) control gene, GNAS1. Values are similar to wild type and non‐targeting control (NTC) U5‐NSCs under similar culture conditions. The system relies on cell cycle‐dependent degradation of fluorophores using the degrons from CDT1 (amino acids (aa) 30‐120) (present in G0 and G1; mCherry) and geminin (aa1–110) (present in S, G2, and M; monomeric Azami‐Green (mAG)).
Representative contour maps of flow cytometry for FUCCI following the loss of NF2, PTPN14, TAOK1, CREBBP, and TP53.
Ratio of G0/G1 (mCherry‐CDT1+) to S/G2/M (mAG‐Geminin+) from (A) and (B). Values are mean from 4 individually tested LV guides per gene at 21 days post‐selection.
G0/G1 and S/G2/M transit times using time‐lapse microscopy and FUCCI. Differences in G0/G1 are statistically significant with P < 0.001 for targeted U5‐NSCs and P = 0.0006 for GSC‐131 compared to NTC.
- A
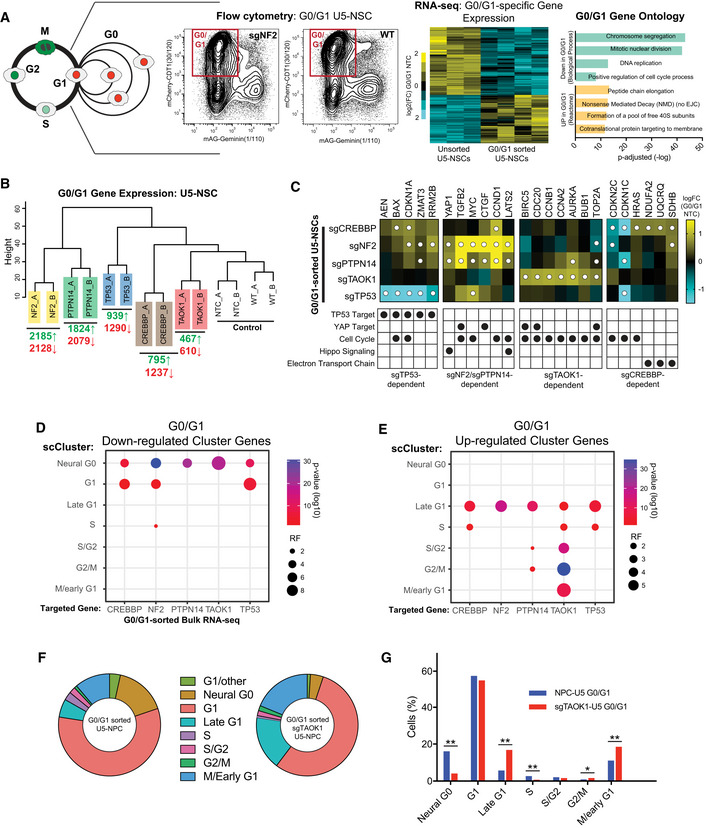
Schematic of G0/G1 sorting for gene expression analysis: mCherry‐CDT1+ U5‐NSCs (red box), heat maps of log2(fold‐change) between G0/G1 NTC the significantly altered genes (FDR < 0.05) between WT unsorted U5‐NSCs and non‐targeting control (NTC) and WT G0/G1 U5‐NSCs, and gene ontology analysis (Young et al, 2010) of some of the top biological processes down‐regulated and reactome groups (Yu & He, 2016) up‐regulated in the G0/G1‐sorted cells. Full list in Datasets EV10 and EV11.
- B
Dendrogram of unbiased hierarchical clustering of gene expression from G0/G1‐sorted U5‐NSCs with the number genes up (green) and down (red) regulated (FDR < 0.05) in each KO compared to NTC. Complete results in Dataset EV10.
- C
Heat map of log2FC compared to NTC for key genes changed in G0/G1 in following loss of TP53, NF2/PTPN14, TAOK1, and/or CREBBP, including genes from TP53 targets, YAP targets, the cell cycle, Hippo signaling, and electron transport genes. White dots indicate FDR < 0.05.
- D, E
Significance of overlap of the down (D)‐ and up (E)‐regulated genes from bulk RNA sequencing of G0/G1‐sorted cells with the single‐cell cluster definitions (up‐regulated genes). Significance assessed through hypergeometric enrichment test P‐values. RF = representation factor.
- F
Fraction of cells classified by ccAF into the cell cycle phases for scRNA‐seq profiles from CDT+ sorted WT and sgTAOK1 U5‐NSCs.
- G
Comparison of the proportions of each cell cycle phase between CDT+ sorted WT and sgTAOK1 U5‐NSCs. Significance was assessed using the proportion test. *≤ 0.05; **≤ 1 × 10⁻⁶.
References
-
- Artegiani B, Lyubimova A, Muraro M, van Es JH, van Oudenaarden A, Clevers H (2017) A single‐cell RNA sequencing study reveals cellular and molecular dynamics of the hippocampal neurogenic niche. Cell Rep 21: 3271–3284 - PubMed
Publication types
MeSH terms
Grants and funding
LinkOut - more resources
Full Text Sources
Molecular Biology Databases
Research Materials
Miscellaneous
