Observational Study
. 2021 Jul 22;6(14):e148406.
doi: 10.1172/jci.insight.148406.

Longitudinal genotype-phenotype analysis in 86 patients with PAX6-related aniridia

Affiliations
Observational Study

Longitudinal genotype-phenotype analysis in 86 patients with PAX6-related aniridia

Vivienne Kit et al. JCI Insight. .

Abstract

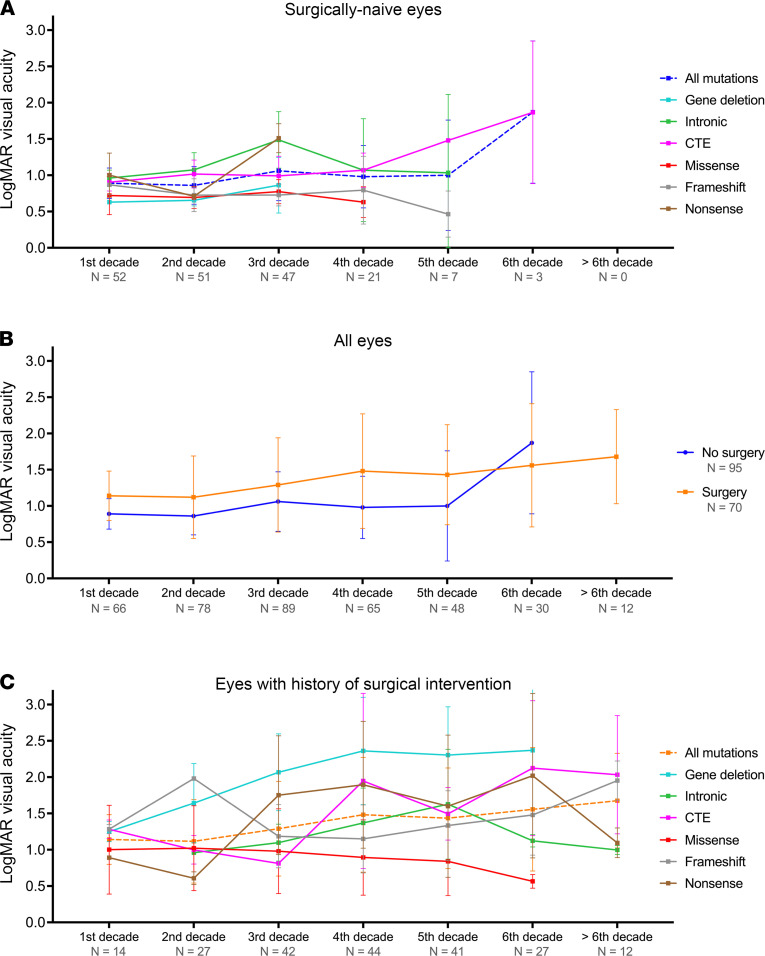
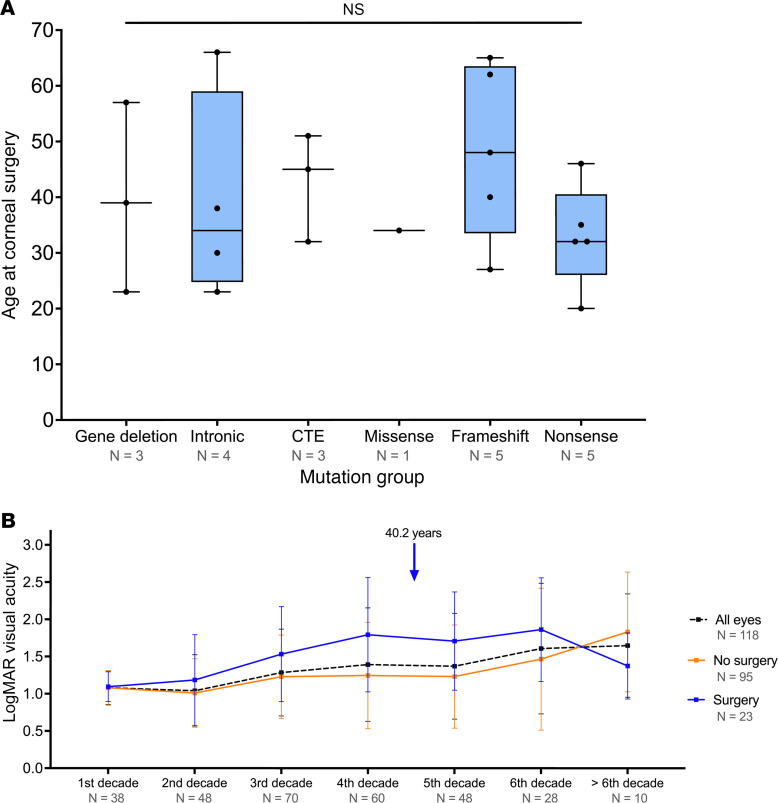
Aniridia is most commonly caused by haploinsufficiency of the PAX6 gene, characterized by variable iris and foveal hypoplasia, nystagmus, cataracts, glaucoma, and aniridia-related keratopathy (ARK). Genotype-phenotype correlations have previously been described; however, detailed longitudinal studies of aniridia are less commonly reported. We identified 86 patients from 62 unrelated families with molecularly confirmed heterozygous PAX6 variants from a UK-based single-center ocular genetics service. They were categorized into mutation groups, and a retrospective review of clinical characteristics (ocular and systemic) from baseline to most recent was recorded. One hundred and seventy-two eyes were evaluated, with a mean follow-up period of 16.3 ± 12.7 years. Nystagmus was recorded in 87.2% of the eyes, and foveal hypoplasia was found in 75%. Cataracts were diagnosed in 70.3%, glaucoma in 20.6%, and ARK in 68.6% of eyes. Prevalence, age of diagnosis and surgical intervention, and need for surgical intervention varied among mutation groups. Overall, the missense mutation subgroup had the mildest phenotype, and surgically naive eyes maintained better visual acuity. Systemic evaluation identified type 2 diabetes in 12.8% of the study group, which is twice the UK prevalence. This is the largest longitudinal study of aniridia in the UK, and as such, it can provide insights into prognostic indicators for patients and guiding clinical management of both ocular and systemic features.

Keywords: Genetic diseases; Genetics; Ophthalmology.


Conflict of interest statement

Conflict of interest: The authors have declared that no conflict of interest exists.

Figures

Figure 1
Figure 1. Distribution of the 48 different PAX6 variants identified in this cohort.
(A) PAX6 coding sequence (CDS) is shown with numbered exons and colors representing the respective protein domains: paired domain (blue, exons 5–7), homeodomain (green, exons 8–10), and proline-serine-threonine–rich domain (dark gray, exons 10–13). Linker region is represented in light gray (exons 7–8). Striped boxes represent noncoding exons 1–4. Variants are represented by white squares (nonsense), white triangles (frameshift), black circles (missense), and black diamonds (C-terminal extension). The previously undescribed variant is highlighted in red. (B) Schematic of PAX6 including intronic regions (white boxes) was used to show distribution of intronic/splice site variants, represented as white circles. Both schematics represent PAX6 transcript NM_000280.4 encoding protein isoform NP_000271.1. (C) Schematic representation of deletions in 11p13 encompassing either whole PAX6 gene or the regulatory regions 3′ of PAX6 in the ELP4 gene. PAX6 is highlighted in black and neighbor genes are represented by gray boxes. Colored bars represent approximate coordinates of deletions identified in 3 patients in this study (patients 1-i, 2-i, and 3-i). The exact chromosomal coordinates were not obtained from the genetic screening service. Adapted from ref. .
Figure 2
Figure 2. Best-corrected visual acuity in patients with PAX6 mutations.
Line charts demonstrate the longitudinal change in best-corrected visual acuity in this cohort in (A) different mutation groups with surgically naive eyes, (B) all eyes with or without surgical intervention, and (C) comparing mutation groups with a history of surgical intervention. Data represent mean ± SD. LogMAR, logarithm of the minimum angle of resolution, CTE, C-terminal extension.
Figure 3
Figure 3. Patients with PAX6 mutations and cataracts.
Box-and-whisker plots represent the differences in (A) age at diagnosis and (B) age at surgery among mutation groups. The blue box represents the 25th to 75th percentiles. The black line within the box represents the median. Whiskers extend to the minimum and maximum values. All data points were superimposed on the graph. Kruskal-Wallis and Dunn’s post hoc tests were used to compare among mutation groups. (C) Line graph demonstrates the change in logarithm of the minimum angle of resolution (LogMAR) visual acuity in patients with cataracts. Data represent mean ± SD. Black dashed arrow and blue arrow represent the mean age at cataract diagnosis and surgery, respectively. CTE, C-terminal extension. *P < 0.05, ***P < 0.001.
Figure 4
Figure 4. Patients with PAX6 mutations and glaucoma.
Box-and-whisker plots represent differences in (A) age at diagnosis and (B) age at surgery among mutation groups. The blue box represents the 25th to 75th percentiles. The black line within the box represents the median. Whiskers extend to the minimum and maximum values. All data points were superimposed on the graph. Kruskal-Wallis test was used to compare among mutation groups. (C) Line graph demonstrates change in logarithm of the minimum angle of resolution (LogMAR) visual acuity in patients with glaucoma. Data represent mean ± SD. Black dashed arrow and blue arrow represent the mean age at glaucoma diagnosis and surgery, respectively. CTE, C-terminal extension.
Figure 5
Figure 5. Patients with PAX6 mutations and aniridia-related keratopathy.
(A) Box-and-whisker plot represents the difference in the age at corneal surgery among mutation groups. The blue box represents the 25th to 75th percentiles. The black line within the box represents the median. Whiskers extend to the minimum and maximum values. All data points were superimposed on the graph. No statistically significant difference was observed between groups (Kruskal-Wallis test). (B) Line graph demonstrates the change in logarithm of the minimum angle of resolution (LogMAR) visual acuity in patients with aniridia-related keratopathy. Data represent mean ± SD. Blue arrow represents the mean age at surgery. CTE, C-terminal extension.
Figure 6
Figure 6. Complex ocular features and systemic features detected in this cohort.
(A) Distribution of the number of eyes with atypical aniridia or complex ocular phenotypes within the different mutation groups: microphthalmia (n = 1), ptosis (n = 27), optic nerve hypoplasia (including 1 optic nerve coloboma) (n = 14), ectopia lentis (n = 11), and retinal detachment (n = 9). (B) Distribution of systemic features among patients in the different groups: obesity (n = 20), type 2 diabetes (T2D) (n = 11), hypothyroidism (n = 6), hypertension (n = 9), hypercholesterolemia (n = 4), and asthma (n = 11).
Figure 7
Figure 7. Reference guide for age of cataract and glaucoma development relating to PAX6 variants.
The degree of complete and partial iris hypoplasia versus full iris structure among variant subgroups is shown based in mutation types that included nonsense (n = 14), intronic (n = 15), gene deletion (n = 3), CTE (n = 14), frameshift (n = 21), and missense (n = 19). There is no correlation with iris morphology with the average age at cataract and glaucoma onset. Prevalence of cataracts and glaucoma (in percentages) are shown within arrows. Unknown data are excluded from reference guide.

References

    1. Moosajee M, et al. PAX6-Related Aniridia. In: Adam MP, Ardinger HH, Pagon RA, et al, eds. GeneReviews((R)). University of Washington; 1993. - PubMed
    1. Hingorani M, et al. Aniridia. Eur J Hum Genet. 2012;20(10):1011–1017. doi: 10.1038/ejhg.2012.100. - DOI - PMC - PubMed
    1. Hingorani M, et al. Detailed ophthalmologic evaluation of 43 individuals with PAX6 mutations. Invest Ophthalmol Vis Sci. 2009;50(6):2581–2590. doi: 10.1167/iovs.08-2827. - DOI - PubMed
    1. Calvão-Pires P, et al. Congenital aniridia: clinic, genetics, therapeutics, and prognosis. Int Sch Res Notices. 2014;2014:305350. - PMC - PubMed
    1. Lim HT, et al. PAX6 aniridia syndrome: clinics, genetics, and therapeutics. Curr Opin Ophthalmol. 2017;28(5):436–447. doi: 10.1097/ICU.0000000000000405. - DOI - PubMed

Publication types

MeSH terms

Substances